Abstract
Adipose cells are unique in the dynamism of their sizes, a requisite for their main function of storing and releasing lipid. Lipid metabolism is crucial for energy homeostasis. However, the regulation of lipid storage capacity in conditions of energy excess and scarcity is still not clear. It is not technically feasible to monitor every process affecting storage capacity such as recruitment, growth/shrinkage and death of individual adipose cells in real time for a sufficiently long period. However, recent computational approaches have allowed an examination of the detailed dynamics of adipose cells using statistical information in the form of precise measurements of adipose cell-size probability distributions. One interesting finding is that the growth/shrinkage of adipose cells (> 50 μm diameter) under positive/negative energy balance is proportional to the surface area of cells, limiting efficient lipid absorption/release from larger adipose cells. In addition to the physical characteristics of adipose cells, quantitative modeling integrates dynamics of adipose cells, providing the mechanism of cell turnover under normal and drug-treated conditions. Thus, further use of mathematical modeling applied to experimental measurements of adipose cell-size probability distributions in conjunction with physiological measurements of metabolic state may help unravel the intricate network of interactions underlying metabolic syndromes in obesity.
Introduction
Organisms that maintain body temperature homeostatically by internal processes, heating or cooling, are able to function in a broad range of external temperatures. While this is apparently a considerable advantage as a survival strategy, it requires the maintenance of an energy store capable of buffering against the vicissitudes of weather and food supply. As the main store of energy in mammals, white adipose tissue (WAT) plays a central role in energy homeostasis. Its primary function is to efficiently store energy in the form of lipid droplets, mainly triglycerides (TG), supplying non-esterified fatty acids (NEFA) as needed. Absence of WAT leads to ectopic fat deposition in the periphery, suggesting, teleologically, that other organs have not needed to develop alternatives that allow the body to cope with dysfunction or inadequacy in WAT storage capacity. WAT dynamics, defined in this review as the hormone-mediated interplay between adipose cell growth (lipogenesis), shrinkage (lipolysis), recruitment and apoptosis/necrosis, is an intricate ensemble of processes that buffers energy supply and demand for the entire mammalian body.
WAT is constantly varying. It can expand to store excess fatty acids (FA) in the form of TG—lipogenesis—or shrink by hydrolyzing stored TG—lipolysis—to provide energy under fasting conditions. WAT expansion occurs either by enlarging the size of the adipose cells—hypertrophy—wherein existent cells uptake available FA, or by increasing their number—hyperplasia—wherein new adipose cells are recruited from adipose cell precursors, which in turn are differentiated from mesenchymal stem cells and undergo replication/proliferation.Citation1 WAT dynamics is regulated by both external stimulation, such as hormonal (e.g., insulin from the pancreas) and neural (e.g., noradrenaline) inputs and internal stimulation (e.g., leptin produced within the adipose tissue). These factors vary depending on nutritional input, environment, genetic makeup, gender, age and location of the adipose tissue depot.Citation2,Citation3
It has long been recognized that the sizes of adipose cells are indicators of metabolic state. Radiocarbon dating studies on lipidCitation4 and adipose cellsCitation5 age suggest a continuous shuttling of lipids between adipose cells of different sizes.Citation4 Similarly, a regular turnover of both adipose cell precursors and adipose cells is observed.Citation1,Citation5 Aged or malfunctioning adipose cells die and are replaced by new differentiating ones such that, in healthy human adults, the total adipose cell number stays approximately constant.Citation5,Citation6 Comprehensive surveys of the various factors affecting WAT physiology are available.Citation7-Citation9
A dysfunction in lipid storage ability of WAT leads to lipotoxicity—i.e., excess fat accumulation in non-adipose tissues such as skeletal muscles, kidneys, heart, liver and pancreas—and consequently cell apoptosis, and cardiac and metabolic diseases such as cardiomyopathy, type 2 diabetes, dyslipidemia and non-alcoholic steatohepatitis.Citation10,Citation11 Aside from lipodystrophy, obesity is a major factor in the processes leading to lipotoxicity. A possible reason is that since there is a need to keep plasma NEFA concentrations within a safe range,Citation12 an overabundance of lipids causes a redirection of the dietary fat pathway. However, not all obese individuals have the same risk of developing a metabolic syndrome. For example, insulin sensitivity varies among individuals with the same level of obesity.Citation13 A better predictor is how lipid is distributed among the various WAT depots, as the latter vary in their functional properties.Citation14,Citation15 For example, many studies show a positive correlation between upper body obesity and cardiac and metabolic diseases,Citation16,Citation17 more so in the visceral than the subcutaneous adipose depots.Citation18-Citation21 On the other hand, a preferential lower body fat accumulation, particularly in the subcutaneous gluteofemoral depot, is seen to protect against obesity-related diseases.Citation22,Citation23
During early development in humans and other mammals, WAT expansion is mainly driven by hyperplasia.Citation24,Citation25 On the other hand, in adulthood, the expansion is mainly due to hypertrophyCitation26 followed by hyperplasia, especially after prolonged obesity.Citation27,Citation28 It is generally believed that obesity-related insulin resistance is associated with adipose cell hypertrophy, particularly in the abdominal region for humans.Citation29 This is possibly due to the higher basal lipolysis rate of large adipose cellsCitation30,Citation31 and their association with a higher level of pro-inflammatory factors and cell necrosis.Citation32-Citation34 After comparing insulin sensitive and insulin resistant obese individuals, Klöting et al. reported that the latter showed larger adipose cell size in the omental and subcutaneous adipose tissue and higher amounts of macrophages, particularly in the omental depot, independent of total body fat.Citation20
Adipose Cell-Size Probability Distributions
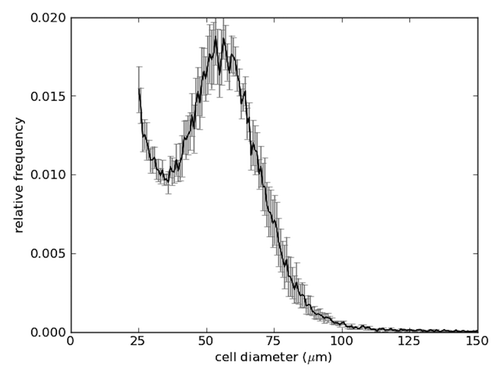
The Coulter counter serves as a useful instrument for the quantification of adipose cell size.Citation35 Precise cell-size measurements reveal that adipose cell size has a roughly bimodal distribution (). This suggests that there may be two distinct populations of cells, and that mean adipose cell size and mean cell number may not be effective measures for summarizing the state of adipose tissue. In particular, adipose cells exhibit an enormous range in their volumes. Large adipose cells have diameters more than ten times bigger than small ones. This flexibility is directly relevant to the primary function of adipose cells: storing energy in the form of lipid. The volume of lipid stored in an adipose cell increases as the third power of the diameter. As mature adipose cells consist of a large lipid droplet surrounded by a thin cytoplasmic layer, this volume increase is almost entirely available for lipid storage. Adipose cells of diameter 200 microns contain 1,000 times the lipid of an adipose cell of diameter 20 microns.
Figure 1. Adipose cell-size distribution. Adipose cells from epididymal fat depots in C56BL/6 mice (male and 3 mo old) were isolated, and relative frequencies of their diameters were measured by a coulter multisizer. Mean ± SEM (n = 6).
It is not clear, however, that there is an inherent metabolic difference between small and large adipose cells. Wueest et al. measured insulin responsiveness of adipose cells of different sizes taken from the epididymal depot of mice and found no difference between small and large cells.Citation31 McLaughlin et al. investigated the cell-size distribution of adipose cells taken from the subcutaneous adipose tissue of insulin-resistant and insulin-sensitive human subjects and reported that the former showed a larger population of very small cells than the latter.Citation36 Furthermore, small cells isolated from Zucker obese rats were shown to have higher expression of inflammatory genes as compared with large cells, and lower levels of adiponectin and PPARγ as compared with lean rats,Citation37 which may explain the lower adipose tissue lipid storage capacity in insulin-resistant individuals.Citation11 Inflammatory activity was shown to be associated with insulin-resistance independent of obesity in both abdominal subcutaneousCitation38 and omental visceralCitation39 adipose tissue. Similarly, a higher proportion of small cells is also associated with a rise in inflammationCitation40 and higher ratio of visceral to total (visceral and subcutaneous) fat.Citation21 These studies did not show, however, whether the upregulation in inflammatory markers precedes the expansion in small cell population or vice versa. As insulin resistance is also accompanied with a downregulation in adipose cell differentiation in both humanCitation36 and rodentCitation37 subjects, one can speculate that the increase in small adipose cell population in insulin-resistant subjects must be due to proliferation. If this is true, then these new small cells might not necessarily represent mature adipose cells since the latter are generally believed to be unable to replicate; adipose cell proliferation was only observed in vitroCitation41,Citation42 but is yet to be shown in vivo.Citation43 Alternatively, it is possible that though adipose cells do not normally replicate, they do so under extenuating circumstances, giving rise to new malfunctioning cells which, in turn, would increase inflammation further. If the malfunction is due to infiltration by macrophages, then one would expect large cells to be deficient in the uptake of fatty acids too. This, however, seems not to be the case as evidenced by the increase in the size of large adipose cells in Zucker obese rats.Citation37 Clearly, small adipose cells are not inherently unable to uptake new lipids as pioglitazone treatment was shown to enhance insulin sensitivityCitation44-Citation46 and increase the population of small adipose cells in the human abdominal subcutaneous fat depotCitation46,Citation47 and the ovarian, retroperitoneal and subcutaneous fat depots of Zucker obese rats.Citation45
Studies examining the size distribution of adipose cellsCitation21,Citation36-Citation40,Citation46,Citation48—as opposed to simply calculating the total cell number and mean cell size—were able to shed more light on the mechanism of adipose cell redistribution and its relation to obesity related diseases, particularly since adipose cells are not homogeneous in their ability to uptake lipids or their functional properties. Correlations may be drawn between measured physiological characteristics and attributes of the probability distributions, assuming that the state of the adipose tissue is at an approximate equilibrium with respect to the associated physiological parameters.
Our focus here is on the understanding of adipose tissue remodeling that can be gleaned from modeling the temporal dynamics of detailed adipose cell-size probability distributions. We are concerned in this review with dynamic measurements that show evolving changes in the adipose cell-size probability distributions. It is not possible to adequately fit such complex changing distributions with a small set of fitting functions as in references Citation36, Citation40, Citation46 and Citation48. Besides this inadequacy, dynamic data contains a plethora of information that should not be discarded by static fitting. The alternative is to use all the information contained in the adipose cell-size probability distributions produced by the Coulter counter and model physiological changes along with the time-evolution of the distributions. What is needed is a dynamic model that tracks the time course of the change in the adipose cell-size distribution with the progression of age and physiological inputs such as hormones, cytokines and growth factors. Current experimental techniques alone are incapable of tracking the evolution of microscopic details in vivo. Instead, one can obtain the data of interest (e.g., adipose cell-size distribution, plasma insulin concentration, etc.) at different time periods. Then, with the aid of a mathematical model, it is possible to explore the progression of events underlying the phenomenon of interest. Furthermore, such an approach allows the examination of competing hypotheses via a comparison of their likelihood values.
What questions can we answer with these fine-grained time-dependent adipose cell-size probability distributions? The appropriate questions depend on whether this data are longitudinal or cross-sectional. We focus here on what we can learn from the dynamics of adipose cell-size distributions measured at a succession of time-points. The cell-size distributions may be obtained from the same animal by means of micro-biopsies, or from animals killed at each time-point. In the latter case, it is possible to obtain absolute cell numbers from each fat location and thereby obtain estimates of the absolute adipose cell-size distribution. In the former case, the absolute cell numbers are unavailable and the analysis must be confined to easily accessible fat depots.
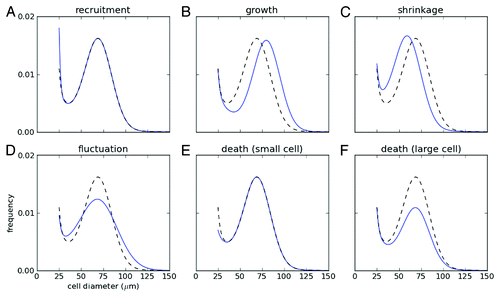
For dynamic changes in probability distributions, the standard mathematical tool is the Fokker-Planck equation. This equation describes the evolution of a probability distribution of a family of similar objects with a measured characteristic, in our case adipose cells with the cell-size as the measured characteristic, with respect to time as a result of processes that change the measured characteristic. Thus, in our case, the processes of interest are lipid turnover, lipid uptake, lipolysis, cell death and cell neogenesis, which manifest as cell-size fluctuations, cell-size increase, cell-size decrease, cell-number decrease and cell-number increase, respectively. shows how each of these processes leads to characteristic changes in the adipose cell-size probability distribution.
Figure 2. Schematic changes of cell-size distribution under various processes. Initial cell-size distribution (dotted gray line) changes with (A) recruitment of new cells at the minimal size, (B) growth and (C) shrinkage of cells, (D) fluctuation of cell size and death of cells at (E) small and (F) large size. Note that the total cell number is normalized as a unity for the initial size distribution.
To answer qualitative questions about dynamics in the adipose tissue, it may suffice to apply Bayesian model comparisonCitation49 to a variety of models suggested by the qualitative questions of interest, and avoid parameter estimation in a Fokker-Planck approach. Thus, for example, to ascertain if there is feedback in adipose cell-size distribution changes that may be correlated with additional cell recruitment, it suffices to check if there is any periodicity in the adipose cell-size probability distributions for a variety of possible periods.Citation50
Changes of Adipose Cell-Size Distribution
Lipid metabolism is critical for energy homeostasis. However, specific mechanisms of lipogenesis and lipolysis in adipose cells are not clearly understood because real-time monitoring of individual adipose cells for sufficiently long time is not technically feasible. As an indirect way, changes of adipose cell-size distribution have been examined under various conditions in chick embryo development,Citation51 lean and obese Zucker rats,Citation52,Citation53 partially lipectomized Wistar rats,Citation54 rabbit biopsyCitation55 and human adipose tissue.Citation56,Citation57
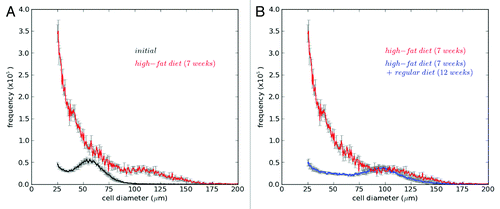
shows changes of adipose cell-size distributions under weight gain and loss conditions. In the weight gain condition (), total cell number increased, large cells appeared more and a bump at the size distribution disappeared. In the weight loss condition (), total cell number decreased especially at small size of cells, and the bump reappeared. To explain all these changes systematically, mathematical modeling has been used.Citation58,Citation59 By modeling the changes in the cell-size distribution, we can extract detailed information regarding recruitment, size-dependent growth/shrinkage, size fluctuation, and death of adipose cells.
Figure 3. Changes of adipose cell-size distributions under weight gain and loss conditions. C56BL/6 mice were fed with a high-fat diet for 7 weeks, then with a regular diet for following 12 weeks. Cell-size distributions in epididymal fat depots were measured from different mice at initial time (3 mo old; black), after 7-week high-fat diet (red) and after 7-week high-fat + 12-week regular diets (blue). Mean ± SEM (n = 6). Note that absolute frequencies of cell sizes were obtained from their relative frequencies using epididymal fat mass measured.
shows how mathematical models described changes in the adipose cell-size distributions under different energy balance conditions (see for a detailed description of the model and parameters). Details for each biological process that we considered follow:
Figure 4. Mathematical models describing cellularity dynamics. Changes of adipose cell-size distribution under various conditions were explained with a general model including recruitement of new adipose cells, growth/shrinkage, and size fluctuation of adipose cells. Detailed explanation of the model and values of model parameters are summarized in . We simulated four diet conditions: (A) small and (B) large positive energy balances; and (C) small and (D) large negative energy balances. For each condition, left panels show growth rates of cell diameter depending on cell size. Note that negative growth represents cell shrinkage. Here the net growth rates were determined by the balance between lipogenesis (red; increasing cell size) and lipolysis (blue; decreasing cell size). Right panels display 4-week evolutions of cell-size distribution starting from the same initial size distribution (blue) for each condition. Shaded region (gray) below 25 μm is excluded in the simulation since cells below the size have not been systematically measured in experiment. Here the size frequency is normalized as a unity for the initial cell-size distribution.
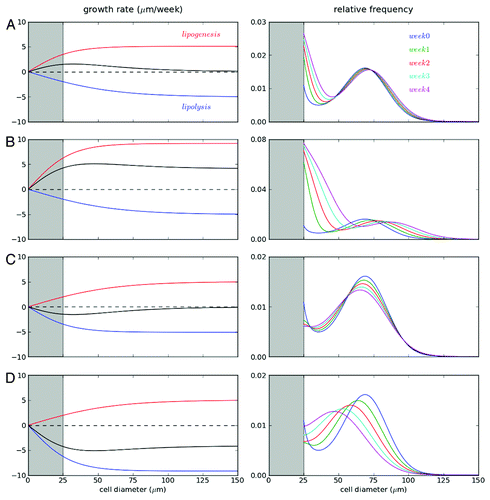
Table 1. Model parameters
Recruitment
To describe the change of total cell number under weight gain and loss conditions, it is a sufficient assumption that adipose tissues exhibit a net increase in cell number only during positive energy balance, but not during negative energy balance.Citation58 The adipose cell-size probability distribution data by itself cannot distinguish between a combination of recruitment and apoptosis, and the net effect of these processes, without additional immunohistochemistry or staining showing the frequency of DNA replication and/or apoptosis. Thus, modeling the temporal changes with both processes included independently leads to unidentifiable model parameters, and therefore, in the absence of data fixing the rate of one or the other process, it is necessary to restrict models to only the net change in cell number. To provide more storage for excess energy under a high energy diet, adipose tissues use the two available mechanisms of hyperplasia and hypertrophy. We have found that hyperplasia strongly depended on genetics as well as diet, while hypertrophy depended more on diet.Citation59
Growth/shrinkage
The growth rate of adipose cells depends on cell size. Under small positive energy balance, the cell-diameter change occurs faster at small cell size (< 50 µm), while under large positive energy balance, the cell-diameter change becomes constant independent of cell size. The latter observation suggests that the cell growth rate is determined by surface area.Citation58 Adipose cell-size changes by two processes: lipogenesis and lipolysis. A simple explanation of the size-dependent growth/shrinkage rate may be that the net growth rate is determined by the balance between lipogenesis and lipolysis. In each process, adipose cells increase/decrease their size in a sigmoidal manner depending on their size. It indicates that large cells above a certain critical size change their diameter proportionally to cell surface area, while small cells change less than the rate expected from cell surface area. This may be due to the fact that the cytosolic volume of the adipose cell becomes increasingly like a thin covering of the central lipid droplet at larger sizes, and therefore leads to lipolysis/lipogenesis proportional to the surface area of the cell. Note that the critical sizes for lipogenesis and lipolysis are not coincident, and depend on energy balance (). For positive energy balance, the critical cell size for lipogenesis is smaller than the one for lipolysis, and this relationship is the opposite of that observed during negative energy balance. Then, depending on the relative contribution of lipogenesis and lipolysis, the growth or shrinkage rate of adipose cells showed various forms ().
Size fluctuations
Adipose cells show lipid turnover.Citation4 Adipose cells release/uptake lipids to/from neighboring cells. This lipid turnover leads to size fluctuation of adipose cells. Modeling shows that this turnover plays an important role in the size of newly-recruited small cells. When these cells get larger by random size fluctuations and reach a threshold size, they start to grow at a higher rate. It is this mechanism that is correlated with the bimodality of the adipose cell-size probability distribution. Under a high energy diet, the size fluctuations increase, and provide more chance for the newly recruited small adipose cells to reach the threshold size.Citation59
Death
Under a weight loss condition, we have observed that the total number of adipose cells decreases. Two possible explanations are shrinkage of adipose cells below our size-measurement window and death of cells. Bayesian model comparison, quantifying probabilities of different models for explaining the given data, has revealed that the former is more plausible to fit the change of cell-size distribution under the negative energy balance.Citation58 On the other hand, under a prolonged weight gain condition, we have also observed that total number of adipose cells in epididymal fat decreased, and mathematical modeling revealed that large cells are removed by cell death.Citation58 If cell death occurred under both weight gain and loss, the former death may be a passive failure for storing energy, while the latter death may be an active process for removing unnecessary energy-storage space.
Adipose Cell Turnover
All observations of adipose cells show that adipose cells have an upper size limit. In particular, adipose cells cannot keep increasing their size under positive energy balance. In obesity, cell death at large adipose cells has also been suggested as due to macrophage infiltrationCitation32,Citation60 and the fragility of enlarged adipose cells.Citation61 Our mathematical modeling has found that large adipose cells undergo apoptosis or necrosis under prolonged weight-gain conditions.Citation58
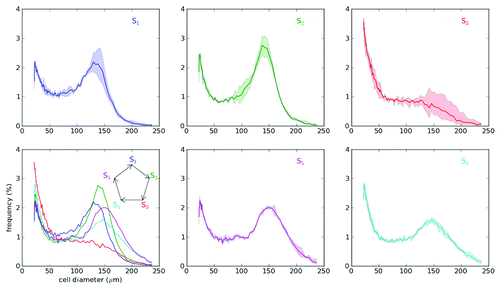
In addition to a failure in storing more energy in obesity, large adipose cells may undergo apoptosis for cell turnover under normal conditions. Spalding et al. have reported that adipose cells are renewed with 10 y lifespan in humans.Citation5 Therefore, cell turnover may result from the following sequences of events: recruitment of new cells, their growth and death of large, and possibly old, cells. A basic question that may be experimentally addressable is the possibility of a correlation between adipose cell age and size. Our longitudinal study using biopsies of subcutaneous fat tissue from rats has also found oscillation of adipose cell-size distribution with 55 d period ().Citation50 Unlike the long-term changes of size distributions in adult animals under fixed energy balance (), more dynamic models that consider time-dependent parameters are required to describe dynamic adipose cell-size distributions for the short-term oscillation, developmental period and large alternations of energy balance. One interesting example is the cyclical weight gain and loss of hibernators.Citation62
Figure 5. Oscillation of adipose cell-size distribution. Adipose cell-size distributions were measured in a Zucker fa/fa rat (4 weeks old) over a period of 151 d, using micro-biopsies to obtain subcutaneous (inguinal) fat tissue from the animal. The biopsies were done on days 0, 2, 6, 9, 13, 23, 33, 57, 69, 86, 98, 134, 141 and 150. Their cell-size distributions could be consecutively categorized into five stages (S1 to S5) based on the Bayesian analysis of data.Citation50 Those stages appear periodically with an interval of ~55 d.
Our results show that TZD treatment leads to more adipocytes and greater energy uptake by intermediate-sized adipocytes, in the inguinal fat pad of the Zucker fatty rat. We have quantitatively shown that treatment-induced hyperplasia is more or less complete within the first eight days of treatment, with subsequent hyperplasia at a much slower rate. We have also found that an increase in hypertrophy induced by treatment occurs mainly in intermediate-sized adipocytes. This hypertrophy may be related to the greater glucose utilization induced by TZD treatment,Citation63 which in turn may be linked to increased insulin sensitivity in adipocytes.Citation64 A similar size range for hypertrophy was found in reference Citation59, suggesting that the size range for hypertrophy is independent of the stimulus for generating larger adipocytes. On the other hand, the availability of additional adipocytes in a size range capable of additional energy storage due to treatment may itself alleviate hyperglycemia by enabling liponeogenesis. Data in the work of MacKellar et al.Citation47 shows that the insulin sensitizing effects of TZDs appear by day 2 of treatment but there is a decrease in plasma glucose area-under-the-curve (AUC) between day 6 and day 10 without a concurrent additional drop in insulin AUC. This suggests that the availability of additional energy storage in the form of adipocyte recruitment by day 8 leads to glucose removal from circulation by lipogenesis either in the liver or in the adipose tissue. This may support the hypotheses of de Souza et al.Citation45
Perspective
We have focused in this review on the dynamic characteristics of adipose tissue that can be elucidated with the combination of precise adipose cell-size probability distributions and mathematical modeling. Even without taking the detailed physiological status of the animals into account, mathematical modeling has elucidated characteristics of adipose tissue cellularity that impact energy storage and availability.
For example, adverse metabolic conditions such as insulin resistance may result from the less responsive behavior of large adipose cells rather than their large size. Large adipose cells are inefficient for energy storage and release: According to our mathematical models, absolute lipolysis per unit mass of adipose tissue is lowered if the proportion of large cells is increased because adipose cell-diameter change is independent of size, implying lipid absorption/release proportional to cell surface area. In addition, prolonged weight gain ultimately induces the death of large cells.Citation58 Therefore, hypertrophy by itself is inadequate for storing excess energy, and leads to hyperplasia. However, lipodystrophy/lipotoxicity induced by a dysfunction in lipid storage by adipose cell hypertrophy induces inflammation (due to reactive oxygen species generation, for exampleCitation65) affecting small adipose cells as well as large cells. Thus, insights from mathematical modeling can provide an integrative view of adipose cellularity in metabolic syndromes.Citation66 As another example, the impact of TZD administration appears to decouple the insulin-sensitizing effects and the recruitment of new adipocytes. This conclusion, reached by mathematical modeling of cell-size distribution changes under TZD administration,Citation47 has been confirmed by molecular studies.Citation67
Mathematical modeling also sheds light on the origin of bimodality. The origin of the nadir observed between the large number of adipose cells at small size and the other modal number at medium size is the size-dependent growth of adipose cells, coupled with size fluctuations associated with lipid turnover. Thus, newly recruited cells accumulate at small sizes (< 30 µm) unless size fluctuations move them to a size at which they can store lipids efficiently, leading to growth to larger sizes. Hence, the bimodality may represent two distinct populations of adipose cells.
Size-dependent features of adipose cell growth/shrinkage and death have not been explored in experiments. The changes of adipose cell size through lipogenesis and lipolysis will be linked to the lipid-droplet configurations. Small cells in WAT have multiple (multilocular) small lipid droplets, while large cells have single (monolocular) big droplets.Citation68 It is of interest that adipose cells in brown adipose tissue, playing a role for energy dissipation, have multilocular lipid droplets.Citation69 This physical configuration of droplets may affect lipid absorption and release due to the surface-to-volume ratio of entire droplets in cells. Furthermore, several molecules such as fat-specific protein of 27 kDa (FSP27)Citation70 and caveolin,Citation71 involved in the lipid droplet formation, have been identified. Therefore, recent intensive studies regarding lipid dropletsCitation72 may shed light on the microscopic details of size-dependent adipose cell growth and shrinkage.
Further progress in relating the mechanistic changes in the cellularity of adipose tissue and the metabolic state of the animal will require cell-size distribution measurements along with measurements of insulin, leptin, adipokines, cytokines and circulating metabolites.
Acknowledgments
This work was supported by funding from the intramural research program of the National Institutes of Health, National Institute of Diabetes and Digestive and Kidney Diseases.
References
- Rigamonti A, Brennand K, Lau F, Cowan CA. Rapid cellular turnover in adipose tissue. PLoS One 2011; 6:e17637; http://dx.doi.org/10.1371/journal.pone.0017637; PMID: 21407813
- Hausman DB, DiGirolamo MM, Bartness TJ, Hausman GJ, Martin RJ. The biology of white adipocyte proliferation. Obes Rev 2001; 2:239 - 54; http://dx.doi.org/10.1046/j.1467-789X.2001.00042.x; PMID: 12119995
- Gregoire FM, Smas CM, Sul HS. Understanding adipocyte differentiation. Physiol Rev 1998; 78:783 - 809; PMID: 9674695
- Arner P, Bernard S, Salehpour M, Possnert G, Liebl J, Steier P, et al. Dynamics of human adipose lipid turnover in health and metabolic disease. Nature 2011; 478:110 - 3; http://dx.doi.org/10.1038/nature10426; PMID: 21947005
- Spalding KL, Arner E, Westermark PO, Bernard S, Buchholz BA, Bergmann O, et al. Dynamics of fat cell turnover in humans. Nature 2008; 453:783 - 7; http://dx.doi.org/10.1038/nature06902; PMID: 18454136
- Arner P, Spalding KL. Fat cell turnover in humans. Biochem Biophys Res Commun 2010; 396:101 - 4; http://dx.doi.org/10.1016/j.bbrc.2010.02.165; PMID: 20494119
- Schling P, Löffler G. Cross talk between adipose tissue cells: impact on pathophysiology. News Physiol Sci 2002; 17:99 - 104; PMID: 12021379
- Frayn KN, Karpe F, Fielding BA, Macdonald IA, Coppack SW. Integrative physiology of human adipose tissue. Int J Obes Relat Metab Disord 2003; 27:875 - 88; http://dx.doi.org/10.1038/sj.ijo.0802326; PMID: 12861227
- Sun K, Kusminski CM, Scherer PE. Adipose tissue remodeling and obesity. J Clin Invest 2011; 121:2094 - 101; http://dx.doi.org/10.1172/JCI45887; PMID: 21633177
- Schaffer JE. Lipotoxicity: when tissues overeat. Curr Opin Lipidol 2003; 14:281 - 7; http://dx.doi.org/10.1097/00041433-200306000-00008; PMID: 12840659
- Savage DB, Petersen KF, Shulman GI. Mechanisms of insulin resistance in humans and possible links with inflammation. Hypertension 2005; 45:828 - 33; http://dx.doi.org/10.1161/01.HYP.0000163475.04421.e4; PMID: 15824195
- McQuaid SE, Hodson L, Neville MJ, Dennis AL, Cheeseman J, Humphreys SM, et al. Downregulation of adipose tissue fatty acid trafficking in obesity: a driver for ectopic fat deposition?. Diabetes 2011; 60:47 - 55; http://dx.doi.org/10.2337/db10-0867; PMID: 20943748
- Ferrannini E, Natali A, Bell P, Cavallo-Perin P, Lalic N, Mingrone G, European Group for the Study of Insulin Resistance (EGIR). Insulin resistance and hypersecretion in obesity. J Clin Invest 1997; 100:1166 - 73; http://dx.doi.org/10.1172/JCI119628; PMID: 9303923
- Sackmann-Sala L, Berryman DE, Munn RD, Lubbers ER, Kopchick JJ. Heterogeneity among white adipose tissue depots in male C57BL/6J mice. Obesity (Silver Spring) 2012; 20:101 - 11; http://dx.doi.org/10.1038/oby.2011.235; PMID: 21779095
- Tchoukalova YD, Votruba SB, Tchkonia T, Giorgadze N, Kirkland JL, Jensen MD. Regional differences in cellular mechanisms of adipose tissue gain with overfeeding. Proc Natl Acad Sci U S A 2010; 107:18226 - 31; http://dx.doi.org/10.1073/pnas.1005259107; PMID: 20921416
- Vague J. The degree of masculine differentiation of obesities: a factor determining predisposition to diabetes, atherosclerosis, gout, and uric calculous disease. Am J Clin Nutr 1956; 4:20 - 34; PMID: 13282851
- Rexrode KM, Carey VJ, Hennekens CH, Walters EE, Colditz GA, Stampfer MJ, et al. Abdominal adiposity and coronary heart disease in women. JAMA 1998; 280:1843 - 8; http://dx.doi.org/10.1001/jama.280.21.1843; PMID: 9846779
- Wajchenberg BL. Subcutaneous and visceral adipose tissue: their relation to the metabolic syndrome. Endocr Rev 2000; 21:697 - 738; http://dx.doi.org/10.1210/er.21.6.697; PMID: 11133069
- Demerath EW, Reed D, Rogers N, Sun SS, Lee M, Choh AC, et al. Visceral adiposity and its anatomical distribution as predictors of the metabolic syndrome and cardiometabolic risk factor levels. Am J Clin Nutr 2008; 88:1263 - 71; PMID: 18996861
- Klöting N, Fasshauer M, Dietrich A, Kovacs P, Schön MR, Kern M, et al. Insulin-sensitive obesity. Am J Physiol Endocrinol Metab 2010; 299:E506 - 15; http://dx.doi.org/10.1152/ajpendo.00586.2009; PMID: 20570822
- Kursawe R, Eszlinger M, Narayan D, Liu T, Bazuine M, Cali AM, et al. Cellularity and adipogenic profile of the abdominal subcutaneous adipose tissue from obese adolescents: association with insulin resistance and hepatic steatosis. Diabetes 2010; 59:2288 - 96; http://dx.doi.org/10.2337/db10-0113; PMID: 20805387
- Frayn KN. Adipose tissue as a buffer for daily lipid flux. Diabetologia 2002; 45:1201 - 10; http://dx.doi.org/10.1007/s00125-002-0873-y; PMID: 12242452
- Manolopoulos KN, Karpe F, Frayn KN. Gluteofemoral body fat as a determinant of metabolic health. Int J Obes (Lond) 2010; 34:949 - 59; http://dx.doi.org/10.1038/ijo.2009.286; PMID: 20065965
- Hirsch J, Han PW. Cellularity of rat adipose tissue: effects of growth, starvation, and obesity. J Lipid Res 1969; 10:77 - 82; PMID: 5764119
- Bonnet F, Gosselin L, Chantraine J, Senterre J. Adipose cell number and size in normal and obese children. Eur J Clin Biol Res 1970; 15:1101 - 4
- Salans LB, Horton ES, Sims EAH. Experimental obesity in man: cellular character of the adipose tissue. J Clin Invest 1971; 50:1005 - 11; http://dx.doi.org/10.1172/JCI106570; PMID: 5552403
- Hill JO, Peters JC, Lin D, Yakubu F, Greene H, Swift L. Lipid accumulation and body fat distribution is influenced by type of dietary fat fed to rats. Int J Obes Relat Metab Disord 1993; 17:223 - 36; PMID: 8387971
- Faust IM, Johnson PR, Stern JS, Hirsch J. Diet-induced adipocyte number increase in adult rats: a new model of obesity. Am J Physiol 1978; 235:E279 - 86; PMID: 696822
- Krotkiewski M, Björntorp P, Sjöström L, Smith U. Impact of obesity on metabolism in men and women. Importance of regional adipose tissue distribution. J Clin Invest 1983; 72:1150 - 62; http://dx.doi.org/10.1172/JCI111040; PMID: 6350364
- Zimmermann R, Strauss JG, Haemmerle G, Schoiswohl G, Birner-Gruenberger R, Riederer M, et al. Fat mobilization in adipose tissue is promoted by adipose triglyceride lipase. Science 2004; 306:1383 - 6; http://dx.doi.org/10.1126/science.1100747; PMID: 15550674
- Wueest S, Rapold RA, Rytka JM, Schoenle EJ, Konrad D. Basal lipolysis, not the degree of insulin resistance, differentiates large from small isolated adipocytes in high-fat fed mice. Diabetologia 2009; 52:541 - 6; http://dx.doi.org/10.1007/s00125-008-1223-5; PMID: 19048227
- Strissel KJ, Stancheva Z, Miyoshi H, Perfield JW 2nd, DeFuria J, Jick Z, et al. Adipocyte death, adipose tissue remodeling, and obesity complications. Diabetes 2007; 56:2910 - 8; http://dx.doi.org/10.2337/db07-0767; PMID: 17848624
- Skurk T, Alberti-Huber C, Herder C, Hauner H. Relationship between adipocyte size and adipokine expression and secretion. J Clin Endocrinol Metab 2007; 92:1023 - 33; http://dx.doi.org/10.1210/jc.2006-1055; PMID: 17164304
- Cinti S, Mitchell G, Barbatelli G, Murano I, Ceresi E, Faloia E, et al. Adipocyte death defines macrophage localization and function in adipose tissue of obese mice and humans. J Lipid Res 2005; 46:2347 - 55; http://dx.doi.org/10.1194/jlr.M500294-JLR200; PMID: 16150820
- Hirsch J, Gallian E. Methods for the determination of adipose cell size in man and animals. J Lipid Res 1968; 9:110 - 9; PMID: 4295346
- McLaughlin T, Sherman A, Tsao PS, Gonzalez O, Yee G, Lamendola C, et al. Enhanced proportion of small adipose cells in insulin-resistant vs insulin-sensitive obese individuals implicates impaired adipogenesis. Diabetologia 2007; 50:1707 - 15; http://dx.doi.org/10.1007/s00125-007-0708-y; PMID: 17549449
- Liu A, Sonmez A, Yee G, Bazuine M, Arroyo M, Sherman A, et al. Differential adipogenic and inflammatory properties of small adipocytes in Zucker Obese and Lean rats. Diab Vasc Dis Res 2010; 7:311 - 8; http://dx.doi.org/10.1177/1479164110386126; PMID: 20961992
- McLaughlin T, Deng A, Gonzales O, Aillaud M, Yee G, Lamendola C, et al. Insulin resistance is associated with a modest increase in inflammation in subcutaneous adipose tissue of moderately obese women. Diabetologia 2008; 51:2303 - 8; http://dx.doi.org/10.1007/s00125-008-1148-z; PMID: 18825363
- Liu A, McLaughlin T, Liu T, Sherman A, Yee G, Abbasi F, et al. Differential intra-abdominal adipose tissue profiling in obese, insulin-resistant women. Obes Surg 2009; 19:1564 - 73; http://dx.doi.org/10.1007/s11695-009-9949-9; PMID: 19711137
- McLaughlin T, Deng A, Yee G, Lamendola C, Reaven GM, Tsao PS, et al. Inflammation in subcutaneous adipose tissue: relationship to adipose cell size. Diabetologia 2010; 53:369 - 77; http://dx.doi.org/10.1007/s00125-009-1496-3; PMID: 19816674
- Sugihara H, Yonemitsu N, Miyabara S, Yun K. Primary cultures of unilocular fat cells: characteristics of growth in vitro and changes in differentiation properties. Differentiation 1986; 31:42 - 9; http://dx.doi.org/10.1111/j.1432-0436.1986.tb00381.x; PMID: 3732657
- Dodson MV, Fernyhough ME, Vierck JL, Hausman GJ. Adipocytes may not be a terminally differentiated cell type: implications for animal production. Anim Sci 2005; 80:239 - 40
- Negrel R. Fat cells cannot divide. Int J Obesity 1994; 18:88
- Saltiel AR, Olefsky JM. Thiazolidinediones in the treatment of insulin resistance and type II diabetes. Diabetes 1996; 45:1661 - 9; http://dx.doi.org/10.2337/diabetes.45.12.1661; PMID: 8922349
- de Souza CJ, Eckhardt M, Gagen K, Dong M, Chen W, Laurent D, et al. Effects of pioglitazone on adipose tissue remodeling within the setting of obesity and insulin resistance. Diabetes 2001; 50:1863 - 71; http://dx.doi.org/10.2337/diabetes.50.8.1863; PMID: 11473050
- McLaughlin TM, Liu T, Yee G, Abbasi F, Lamendola C, Reaven GM, et al. Pioglitazone increases the proportion of small cells in human abdominal subcutaneous adipose tissue. Obesity (Silver Spring) 2010; 18:926 - 31; http://dx.doi.org/10.1038/oby.2009.380; PMID: 19910937
- MacKellar J, Cushman SW, Periwal V. Differential effects of thiazolidinediones on adipocyte growth and recruitment in Zucker fatty rats. PLoS One 2009; 4:e8196; http://dx.doi.org/10.1371/journal.pone.0008196; PMID: 20041138
- Smith SR, Xie H, Baghian S, Needham A, McNeil M, Bogacka I, et al. Pioglitazone changes the distribution of adipocyte size in Type 2 diabetics. Adipocytes 2006; 2:11 - 22
- Gregory P. Bayesian logical data analysis for the physical sciences: a comparative approach with Mathemica support. 2005, Cambridge, UK: Cambridge University Press.
- MacKellar J, Cushman SW, Periwal V. Waves of adipose tissue growth in the genetically obese Zucker fatty rat. PLoS One 2010; 5:e8197; http://dx.doi.org/10.1371/journal.pone.0008197; PMID: 20107501
- Farkas K, Ratchford IA, Noble RC, Speake BK. Changes in the size and docosahexaenoic acid content of adipocytes during chick embryo development. Lipids 1996; 31:313 - 21; http://dx.doi.org/10.1007/BF02529878; PMID: 8900461
- Kaplan ML, Trout JR, Smith P. Adipocyte size distribution in fa/fa rats during development. Metabolism 1980; 29:333 - 9; http://dx.doi.org/10.1016/0026-0495(80)90006-2; PMID: 7374443
- Margues B, Hausman DB, Martin RJ. Association of fat cell size and paracrine growth factors in developement of hyperplastic obesity. Am J Physiol 1998; 275:1898 - 908
- Hausman DB, Lu J, Ryan DH, Flatt WP, Harris RBS. Compensatory growth of adipose tissue after partial lipectomy: involvement of serum factors. Exp Biol Med (Maywood) 2004; 229:512 - 20; PMID: 15169970
- Reyne Y, Teyssier J, Nouguès J, Tébibel S. Longitudinal study of adipose cell size in the dorsoscapular and perirenal depots of the growing rabbit. J Lipid Res 1985; 26:1036 - 46; PMID: 4067426
- Smith U. Morphologic studies of human subcutaneous adipose tissue in vitro. Anat Rec 1971; 169:97 - 104; http://dx.doi.org/10.1002/ar.1091690109; PMID: 4322670
- Smith U. Effect of cell size on lipid synthesis by human adipose tissue in vitro. J Lipid Res 1971; 12:65 - 70; PMID: 4322518
- Jo J, Guo J, Liu T, Mullen S, Hall KD, Cushman SW, et al. Hypertrophy-driven adipocyte death overwhelms recruitment under prolonged weight gain. Biophys J 2010; 99:3535 - 44; http://dx.doi.org/10.1016/j.bpj.2010.10.009; PMID: 21112277
- Jo J, Gavrilova O, Pack S, Jou W, Mullen S, Sumner AE, et al. Hypertrophy and/or Hyperplasia: Dynamics of Adipose Tissue Growth. PLoS Comput Biol 2009; 5:e1000324; http://dx.doi.org/10.1371/journal.pcbi.1000324; PMID: 19325873
- Weisberg SP, McCann D, Desai M, Rosenbaum M, Leibel RL, Ferrante AW Jr.. Obesity is associated with macrophage accumulation in adipose tissue. J Clin Invest 2003; 112:1796 - 808; PMID: 14679176
- Monteiro R, de Castro PMST, Calhau C, Azevedo I. Adipocyte size and liability to cell death. Obes Surg 2006; 16:804 - 6; http://dx.doi.org/10.1381/096089206777346600; PMID: 16756747
- Dark J, Stern JS, Zucker I. Adipose tissue dynamics during cyclic weight loss and weight gain of ground squirrels. Am J Physiol 1989; 256:R1286 - 92; PMID: 2735455
- Hallakou S, Doaré L, Foufelle F, Kergoat M, Guerre-Millo M, Berthault MF, et al. Pioglitazone induces in vivo adipocyte differentiation in the obese Zucker fa/fa rat. Diabetes 1997; 46:1393 - 9; http://dx.doi.org/10.2337/diabetes.46.9.1393; PMID: 9287037
- Jiang G, Dallas-Yang Q, Li Z, Szalkowski D, Liu F, Shen X, et al. Potentiation of insulin signaling in tissues of Zucker obese rats after acute and long-term treatment with PPARgamma agonists. Diabetes 2002; 51:2412 - 9; http://dx.doi.org/10.2337/diabetes.51.8.2412; PMID: 12145152
- Anderson EJ, Lustig ME, Boyle KE, Woodlief TL, Kane DA, Lin C-T, et al. Mitochondrial H2O2 emission and cellular redox state link excess fat intake to insulin resistance in both rodents and humans. J Clin Invest 2009; 119:573 - 81; http://dx.doi.org/10.1172/JCI37048; PMID: 19188683
- Yang J, Eliasson B, Smith U, Cushman SW, Sherman AS. The size of large adipose cells is a predictor of insulin resistance in first-degree relatives of type 2 diabetic patients. Obesity (Silver Spring) 2012; 20:932 - 8; http://dx.doi.org/10.1038/oby.2011.371; PMID: 22240722
- Choi JH, Banks AS, Estall JL, Kajimura S, Boström P, Laznik D, et al. Anti-diabetic drugs inhibit obesity-linked phosphorylation of PPARgamma by Cdk5. Nature 2010; 466:451 - 6; http://dx.doi.org/10.1038/nature09291; PMID: 20651683
- Tchoukalova YD, Harteneck DA, Karwoski RA, Tarara J, Jensen MD. A quick, reliable, and automated method for fat cell sizing. J Lipid Res 2003; 44:1795 - 801; http://dx.doi.org/10.1194/jlr.D300001-JLR200; PMID: 12777477
- Virtanen KA, Lidell ME, Orava J, Heglind M, Westergren R, Niemi T, et al. Functional brown adipose tissue in healthy adults. N Engl J Med 2009; 360:1518 - 25; http://dx.doi.org/10.1056/NEJMoa0808949; PMID: 19357407
- Nishino N, Tamori Y, Tateya S, Kawaguchi T, Shibakusa T, Mizunoya W, et al. FSP27 contributes to efficient energy storage in murine white adipocytes by promoting the formation of unilocular lipid droplets. J Clin Invest 2008; 118:2808 - 21; PMID: 18654663
- Blouin CM, Le Lay S, Eberl A, Köfeler HC, Guerrera IC, Klein C, et al. Lipid droplet analysis in caveolin-deficient adipocytes: alterations in surface phospholipid composition and maturation defects. J Lipid Res 2010; 51:945 - 56; http://dx.doi.org/10.1194/jlr.M001016; PMID: 19965594
- Reue K. A thematic review series: lipid droplet storage and metabolism: from yeast to man. J Lipid Res 2011; 52:1865 - 8; http://dx.doi.org/10.1194/jlr.E020602; PMID: 21921134