Abstract
Obesity is recognized as a low-grade chronic inflammatory state which involves a chemokine network contributing to a variety of diseases. As a first step toward understanding the roles of the obesity-driven chemokine network, we used a 3T3-L1 cell differentiation model to identify the chemokine profiles elicited during adipogenesis and how this profile is modified by epidermal growth factor (EGF) and tumor necrosis factor-α (TNF) as a growth and proinflammatory factor, respectively. The chemokine network was monitored using PCR arrays and qRT-PCR while main signaling pathways of EGF and TNF were measured using immunoblotting. The dominant chemokines in preadipocytes were CCL5, CCL8, CXCL1, and CXCL16, and in adipocytes CCL6 and CXCL13. The following chemokines were found in both preadipocytes and adipocytes: CCL2, CCL7, CCL25, CCL27, CXCL5, CXCL12, and CX3CL1. Among chemokine receptors, CXCR7 was specific for preadipocytes and CXCR2 for adipocytes. These findings indicate the development of a CXCL12–CXCR7 axis in preadipocytes and a CXCL5–CXCR2 axis in adipocytes. In addition to induction of CCL2 and CCL7 in both preadipocytes and adipocytes, EGF enhanced specifically CXCL1 and CXCL5 in adipocytes, indicating the potentiation of CXCR2-mediated pathway in adipocytes. TNF induced CCL2, CCL7, and CXCL1 in preadipocytes but had no response in adipocytes. EGFR downstream activation was dominant in adipocytes whereas NFκB activation was dominant in preadipocytes. Taken together, the adipocyte-driven chemokine network in the 3T3-L1 cell differentiation model involves CXCR2-mediated signaling which appears more potentiated to growth factors like EGF than proinflammatory factors like TNF.
Keywords: :
Introduction
Obesity represents an increased risk factor in various diseases such as heart disease, type 2 diabetes, and certain types of cancer.Citation1,Citation2 This close relationship between obesity and certain diseases is based on the fact that obesity preserves a low-grade chronic inflammatory state.Citation3,Citation4 Inflammatory links between obesity and metabolic diseases are well-known mechanisms for the recruitment of immune cells into adipose tissue.Citation5,Citation6 Orchestrating the recruitment of immune cells includes members of the chemokine network as a driving force.Citation7 Chemokines are a family of chemoattractant cytokines and consist of four subfamily groups including C (XCL1–2), CC (CCL1–28), CXC (CXCL1–17), and CX3C (CX3CL1). The main function of chemokines is to regulate leukocyte trafficking by their interaction with specific seven-transmembrane-spanning G protein-coupled receptors that are involved in development, inflammation and cancer.Citation8,Citation9
There is increasing evidence that chemokines play a pivotal role in obesity-associated diseases. Adipose tissue of obese patients elevates monocyte chemotaxis (involving CCL2, 3, 5, 7, 8, and 11 and receptors CCR1, 2, 3, and 5) and increases macrophage infiltration.Citation10 The CCL2/CCR2 pathway is also likely involved in obesity-related metabolic disease.Citation11,Citation12 CXCL14 was found to be elevated in white adipocyte tissue of obese mice and to attenuate insulin-stimulated glucose uptake in cultured myocytes.Citation13 Adipose tissue-derived CXCL5 promoted insulin resistance in muscle.Citation14 In another study, the lack of CXCR2 in hematopoietic cells was sufficient to protect the development of insulin resistance.Citation15
Interestingly, conditioned media from adipocytes stimulated production of tumor necrosis factor-α (TNF) in spleen cells, indicating the functional role of adipocytes as immune regulatory cells.Citation16 Obesity promoted liver inflammation and tumorigenesis; both processes involved enhancement of TNF expression.Citation17 TNF is particularly well known as a positive regulator for proinflammatory chemokines through NFκB signaling.Citation18,Citation19 In addition, epidermal growth factor (EGF) is closely related to obesity. EGF shows biphasic effects on adipocytes: it inhibited differentiation of preadipocytes but promoted adipogenesis in differentiated cells.Citation20 EGF was reportedly increased in childhood obesity.Citation21 It was involved in inducing obesity in ovariectomized mice,Citation22 while genetically engineered obese mice were found to have a reduced production of EGF.Citation23 In spite of the controversial results related to EGF expression in animal models and humans, EGF is also a well-known positive regulator for proinflammatory chemokines through Akt and Erk activation.Citation24 These facts suggest that TNF, acting as a proinflammatory factor, or EGF as a growth factor, alters an obesity-associated chemokine profile, probably resulting in the modulation of the adipocyte’s microenvironment.
Because of limited reports linking obesity and chemokine network, we attempted to identify, as a first step, the signatures of specific chemokines in preadipocytes and adipocytes, using the 3T3-L1 cell differentiation model. We also compared the differential response of the chemokine network to a growth factor (EGF) and a proinflammatory factor (TNF) in these cells.
Results
Adipocytes enhance dominantly CXCL13 when compared with preadipocytes
We used the 3T3-L1 cell differentialtion model to prepare nondifferentiated (preadipocytes) and differentiated cells (adipocytes), and performed customized PCR arrays containing genes that encode mouse chemokines and chemokine receptors. The present study used the nomenclature of chemokines approved by the IUIS/WHO Subcommittee on Chemokine Nomenclature (2002). The mRNA levels of a panel of 43 chemokines and 19 chemokine receptors were evaluated. Based on a web-based PCR Array Data Analysis protocol provided by SABiosciences (Qiagen), the absent, low, and high expression levels of chemokines were defined as >35, 30–35, and <30 average threshold cycles, respectively.
CCL2, CCL7, CCL25, CCL27, CXCL5, CXCL12, and CX3CL1 were highly expressed in both preadipocytes and adipocytes (). CCL5, CCL8, CXCL1, and CXCL16 were dominant chemokines in preadipocytes whereas CCL6 and CXCL13 were dominant in adipocytes. Adipogenesis from preadipocytes to adipocytes resulted in downregulation of CCL2, 5, 7, and 8, CXCL1, 5, 12, and 16 and CX3CL1. We selected CCL2, CCL7, CCL8, CXCL1, CXCL5, and CXCL12 as highly downregulated chemokines and confirmed their downregulation during adipogenesis using qRT-PCR with specific primers (; ). In addition, adipocyte-driven chemokines CCL6 and CXCL13 were confirmed using qRT-PCR (). Notably, CXCL13 was primarily expressed in adipocytes as compared with preadipocytes ().
Figure 1. Adipocytes have a predominant increase in CXCL13 and a decrease in CCL8 compared with preadipocytes. (A) Comparison of chemokine ligands in preadipocytes and adipocytes. After isolating total RNA from nondifferentiated (preadipocytes) and differentiated cells (adipocytes), a PCR array was performed using a customized PCR array plate containing complementary sequences for mouse chemokine genes. Different colors indicate the average cycle threshold with expressions that ranged from >35 to <25. Chemokines with a >2-fold increase (*) or decrease (#) were recognized as the major differences between preadipocytes and adipocytes by excluding lowly expressed chemokines with a >30 cycle threshold. (B) Confirmation of preadipocyte-dominant chemokines by qRT-PCR. (C) Confirmation of adipocyte-dominant chemokines by qRT-PCR. After isolating total RNA, qRT-PCR was performed using primers for CCL2, CCL6–8, CXCL1, CXCL5, CXCL12, and CXCL13. Fold changes were calculated as a relative value after setting the first sample of preadipocytes as a control group (1.0). * and # indicate a significant increase or decrease (P ≤ 0.05), respectively (Student t test). Experiments were performed in triplicate and all data are shown as mean ± SEM.
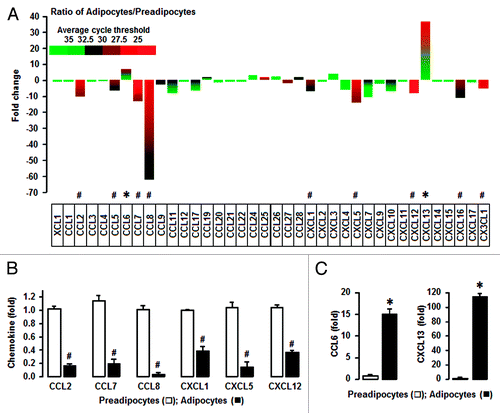
Table 1. Primers used in qRT-PCR analysis
Adipocytes specifically increase CXCR2 when compared with preadipocytes
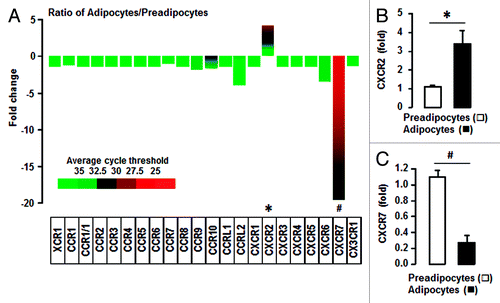
We then compared chemokine receptors in preadipocytes and adipocytes. Almost all of chemokine receptors were absent or were seen in trace amounts in both preadipocytes and adipocytes (). However, CXCR7 was predominantly expressed in preadipocytes and CXCR2 was highly induced in adipocytes. Based on our qRT-PCR results, adipocytes had a significantly increased CXCR2 level when compared with preadipocytes (). On the other hand, preadipocytes expressed higher CXCR7 levels than adipocytes (). These facts indicate the potentiation of CXCR7-mediated signaling in preadipocytes and CXCR2-mediated signaling in adipocytes.
Figure 2. Adipocytes have a significantly increased expression of CXCR2 and a decreased expression of CXCR7 relative to preadipocytes. (A) Comparison of chemokine receptors in preadipocytes and adipocytes. After isolating total RNA from preadipocytes and adipocytes, a PCR array was performed using a customized PCR array plate containing complementary sequences for mouse chemokine receptor genes. (B) Confirmation of increased CXCR2 mRNA in adipocytes by qRT-PCR. (C) Confirmation of decreased CXCR7 mRNA in adipocytes of the by qRT-PCR. After isolating total RNA, qRT-PCR was performed using primers for CXCR2 and CXCR7. Fold changes were calculated as a relative value after setting the first sample of preadipocytes as a control group (1.0). * and # indicate significant increase or decrease (P ≤ 0.05), respectively (Student t test). Experiments were performed in triplicate and all data are shown as mean ± SEM.
Adipocytes are more responsive to EGF than TNF when compared with preadipocytes
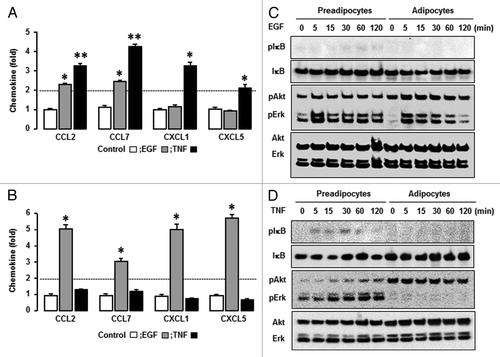
We selected EGF as a growth factor and determined the effects of EGF on the chemokine network in preadipocytes and adipocytes. Preadipocytes induced CCL2 and CCL7 in response to EGF (). In addition to CCL2 and CCL7, EGF significantly enhanced CXCL1 and CXCL5 in adipocytes (). Next we selected TNF as an inflammatory factor and identified TNF-responsive chemokines in preadipocytes and adipocytes. Preadipocytes induced CCL2, CCL7, and CXCL1 in response to TNF (). Interestingly, it had no or less effect on the chemokine network in adipocytes (). In addition, we defined the effects of EGF and TNF on chemokine receptors in preadipocytes and adipocytes. Unlike the chemokine ligands, chemokine receptors were less responsive to EGF and TNF in both preadipocytes and adipocytes (Fig. S1). We next confirmed the effects of EGF and TNF on CCL2, CCL7, CXCL1, and CXCL5 in preadipocytes and adipocytes using qRT-PCR. Although EGF significantly induced CCL2 and CCL7 in preadipocytes, the effect of TNF on CCL2 and CCL7 was significantly greater. TNF also increased CXCL1 and CXCL5 in preadipocytes (). In adipocytes, EGF significantly enhanced CCL2, CCL7, CXCL2, and CXCL5 levels while TNF had no effect on these chemokines (). These facts indicate a dominant effect of TNF on chemokines in preadipocytes and EGF in adipocytes. The difference in dominant chemokines may be attributed from differential response of EGF or TNF in preadipocytes vs. adipocytes. We then compared EGF- or TNF-mediated signaling pathways in preadipocytes and adipocytes, including Akt, Erk, and IκB. Akt activation was greater in adipocytes whereas Erk was more responsive in preadipocytes (). EGF clearly activated Akt and Erk in adipocytes whereas it activated Erk in preadipocytes, but had only a slight effect on Akt and IκB (). On the other hand, TNF clearly activated IκB (and gradually Akt and Erk) in preadipocytes whereas it had no or less effect in adipocytes (). These differential signaling pathways support the dominant effect of TNF on chemokines in preadipocytes and the dominant effect of EGF in adipocytes.
Figure 3. EGF-responsive chemokines in preadipocytes and adipocytes. (A) In preadipocytes, EGF significantly increases CCL2 and CCL7. (B) In adipocytes, EGF resulted in significant increase in not only CCL2 and CCL7 but CXCL1 and CXCL5. Cells were treated with EGF (10 ng/ml) for 1 h. After isolating total RNA from preadipocytes and adipocytes, a chemokine PCR array was performed. Different colors indicate the average cycle threshold with expression ranges from >35 to <25. Chemokines with a >2-fold increase (*) were recognized as the major effects of EGF by excluding lowly expressed chemokines with >30 cycle threshold.
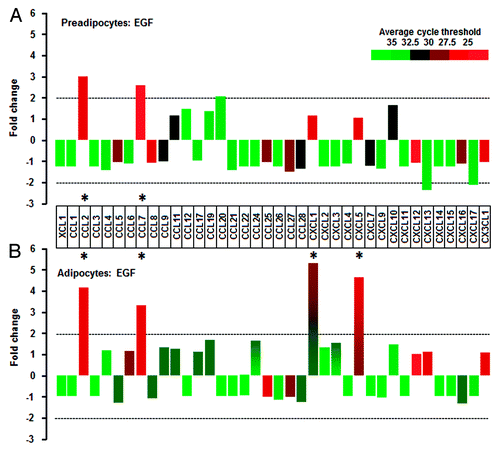
Figure 4. TNF-responsive chemokines in preadipocytes and adipocytes. (A) TNF resulted in a significant increase in CCL2, CCL7, and CXCL1 in preadipocytes, while (B) TNF had no significant effect on chemokines in adipocytes. Cells were treated with TNF (10 ng/ml) for 1 h. After isolating total RNA from preadipocytes and adipocytes, a chemokine PCR array was performed. Different colors indicate average cycle threshold with expression ranges from >35 to <25. Chemokines with a >2-fold increase (*) were recognized as the primary effects of TNF by excluding low expressed chemokines with >30 cycle threshold.
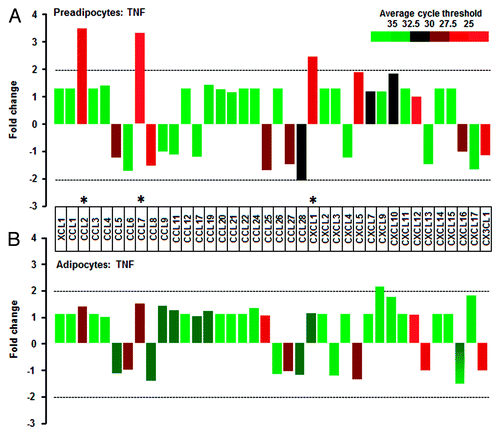
Figure 5. Confirmation of EGF- and TNF-responsive chemokines and comparison of signaling pathways in response to EGF and TNF. (A) In preadipocytes and (B) adipocytes, confirmation of EGF- and TNF-responsive chemokines. After isolating total RNA, qRT-PCR was performed using primers for CCL2, CCL7, CXCL1, and CXCL5. Fold changes were calculated as a relative value after setting the first vehicle-treated sample of preadipocytes and adipocytes as a control group (1.0), respectively. *, **, and # indicate significant increases and decrease (P ≤ 0.05), respectively (Student t test). Experiments were performed in triplicate and all data are shown as mean ± SEM. (C) EGF- and (D) TNF-responsive signaling pathways in preadipocytes and adipocytes. Cells were treated with EGF (10 ng/ml) or TNF (10 ng/ml) for 0, 5, 15, 30, 60, and 120 min. The whole cell lysates were prepared and western blots were performed using antibodies specific to IκB, Akt, Erk, and their phosphorylated forms. Experiments were performed in duplicate and a representative result is shown.
Discussion
The primary findings of this study are that the adipocyte-driven chemokine network has a CXCL5–CXCR2 axis and that EGF-induced CXCL1 and CXCL5 may potentiate the CXCR2-mediated signaling, indicating an alteration in the adipocyte microenvironment. Although adipogenesis downregulated CXCL5, adipocytes still express CXCL5 in quite low levels as compared with preadipocytes. Other authors also demonstrated using 3T3-L1 cells that CXCL5 was downregulated during adipogenesis.Citation14 The CXCL5 promoter contains several NFκB binding sites and TNF was found to induce CXCL5 via NFκB activation in human embryonic 293 cells.Citation25 Thus a lower NFκB activation to TNF in adipocytes may be associated with downregulation of CXCL5. Interestingly, a decrease in the weight of epididymal white adipose tissue following castration resulted to upregulation of CXCL5 levels.Citation26 On the other hand, obese subjects have a higher serum CXCL5 level than lean subjects.Citation14,Citation27 The source of this CXCL5 is most likely macrophages in white adipose tissue.Citation14,Citation26 This finding suggests that macrophages in adipose tissues contribute to the enhanced CXCL5 levels in the obese group despite downregulation of CXCL5 during adipogenesis. Consistent with our results, human adipocytes highly express CXCR2 compared with preadipocytes.Citation28
Other reports indicate the significance of CXCR2-mediated signaling in obesity. CXCR2−/− mice are protected against obesity-induced insulin resistance.Citation14 Even the lack of CXCR2 in hematopoietic cells is sufficient to protect adipose macrophage recruitment and the development of insulin resistance in diet-induced obese mice.Citation15 These facts indicate that CXCR2-mediated signaling is involved in obesity-related diseases such as diabetes and some types of cancer. In comparison to preadipocytes, EGF further induced CXCL1 and CXCL5 in adipocytes, thereby probably potentiating the CXCR2-mediated signaling that was diminished due to downregulation of the CXCR2 ligands, CXCL1 and CXCL5, during adipogenesis. Although CXCL1 and CXCL5 are NFκB-activated chemokines,Citation18,Citation25 EGF increased CXCL1 mRNA in ovarian cancer cellsCitation24 and CXCL5 mRNA in human umbilical vein endothelial cells and the ileum.Citation29,Citation30 EGFR-transactivated Akt signaling was involved in CXCR2-driven ovarian cancer progression by upregulating proinflammatory chemokines CXCL1/2.Citation31 Interestingly, Erk activation was not involved in upregulating the proinflammatory chemokines.Citation31 Therefore, higher Akt activation to EGF in adipocytes may contribute to EGF-induced CXCL1 and CXCL5, rather than that seen in preadipocytes.
In addition to CXCL5, CCL2, CCL5, CCL7, CCL8, CXCL1, CXCL12, CXCL16, and CX3CL1 are decreased during adipogenesis. Because chemokines such as CCL2,Citation32 CCL5,Citation33 CXCL1,Citation18 CXCL16,Citation34 and CX3CL1Citation35 are regulated by NFκB, the smaller response to TNF in adipocytes may be involved in downregulating these particular chemokines. In particular, CCL2 is one of chemokines studied intensively in obesity. CCL2 was found to be highly expressed in obese subjects.Citation10,Citation36,Citation37 Consistent with our results, CCL2 levels have been shown to be higher in preadipocytes than adipocytes.Citation28,Citation38,Citation39 Also, downregulation of CXCL1 during adipogenesis has been supported in another report.Citation15 Obesity has been found to be associated with decreased CXCL16 levels.Citation40 Because CCL7Citation18 and CCL8Citation41 are induced by TNF, the downregulation of these chemokines during adipogenesis may result again, from the smaller response to TNF in adipocytes.
In comparison, the preadipocyte-driven chemokine network is the CXCL12–CXCR7 axis, based on high expression of CXCL12 and CXCR7 in these cells. Although CXCL12 binds to two specific receptors (CXCR4 and CXCR7), CXCR4 is not expressed in preadipocytes or adipocytes despite intensive attention on CXCL12–CXCR4 axis in the cancer field.Citation42 The downregulation of CXCL12 during adipogenesis is supported by the decrease in CXCL12 levels in diet-induced obese mice.Citation27
Interestingly, NFκB and Erk activation was attenuated while Akt activation was potentiated during adipogenesis. Similarly LPS-induced NFκB and Erk activation was found to decrease as differentiation of human adipocytes increased.Citation43 Particularly, TNF has been reported to suppress adipocyte-specific genes such as Akt and GLUT4 in 3T3-L1 adipocytesCitation44 and inhibit adipocyte differentiation,Citation45 indicating a preadipocyte preference for TNF actions. As NFκB is important for TNF-induced lipolysis in human adipocytes,Citation46 many studies indicate that TNF has a clear impact in both adipocyte biologyCitation47 and obesity.Citation48
CCL6 and CXCL13 were found to be significantly increased in adipocytes. This finding will require further study, if these two chemokines are critical to adipogenesis. Thus far the roles of CCL6 and CXCL13 in obesity have not been clarified. CCL6 is a rodent-specific chemokine and plays critical roles in IL-13-induced lung inflammation through CCR1Citation49 and macrophage infiltration.Citation50 B cells from ob/ob mice have a greater propensity to migrate to the liver through a CXCL13-mediated signaling pathway.Citation51 These facts suggest that CCL6 and CXCL13 likely are involved in macrophage and lymphocyte infiltration in obesity, leading to chronic inflammation.
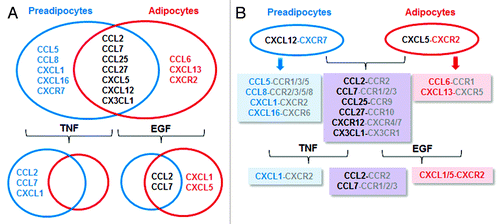
We summarize the characteristics of the chemokine network in preadipocytes and adipocytes, and describe the development of expected chemokine network for cell–cell communication in the preadipocyte and adipocyte microenvironments (). CCL2, CCL7, CCL25, CCL27, CXCL5, CXCL12, and CX3CL1 are commonly expressed in both preadipocytes and adipocytes. CXCR7 expression in preadipocytes and CXCR2 in adipocytes can drive to establish CXCL12–CXCR7 axis in preadipocytes and CXCL5–CXCR2 axis in adipocytes. Common chemokines (CCL2, CCL7, CCL25, CCL27, CXCL12, and CX3CL1), preadipocyte-driven chemokines (CCL5, CCL8, CXCL1, and CXCL16) and adipocyte-driven chemokines (CCL6 and CXCL13) can communicate with other cells containing specific receptors for these chemokines. TNF and EGF commonly induce CCL2 and CCL7. Additionally TNF induced CXCL1 in preadipocytes, and EGF enhanced CXCL1 and CXCL5 in adipocytes. Further induction of CXCR2 ligands such as CXCL1 and CXCL2 by TNF and EGF may lead to potentiation of CXCR2-mediated signaling in adipogenesis, adipocyte biology, and obesity.
Figure 6. Schematic proposal for chemokine networks between preadipocytes and adipocytes. (A) Chemokine networks during 3T3-L1 cell adipogenesis and TNF- and EGF-responsive chemokines between preadipocytes and adipocytes. (B) Differential development of chemokine networks between preadipocytes and adipocytes and TNF- and EGF-potentiated chemokine-receptor axes. Black letters, common chemokines for both preadipocytes and adipocytes; blue letters, preadipocyte-derived chemokines; red letters, adipocyte-derived chemokines; gray letters, expected chemokine receptors for chemokines.
This study represents the first step to clarify the role of the identified chemokines on adipogenesis for future direction. In conclusion, the CXCL1/5–CXCR2 axis is a central adipocyte-driven chemokine network and growth factors like EGF potentiate CXCR2-mediated signaling rather than proinflammatory factors like TNF, in the adipocyte microenvironment.
Materials and Methods
Reagents
Recombinant human EGF (236-EG-200) and TNF (210-TA-020) were obtained from R&D Systems. Antibodies for IκB (8219), Akt (8200), Erk (8201) and their phosphorylated forms were purchased from Cell Signaling Technology. The PCR array for customized mouse chemokines (CAMP10242) and SYBR® Green Master Mix (330503) came from SABiosciences/Qiagen. Specific PCR primers for chemokines or chemokine receptors were obtained from Eurofins MWG Operon. Chemiluminescent detection kits (sc-2048) were from Santa Cruz Biotechnologies. 3-Isobutyl-1-methylxanthine (IBMX, I-7018), insulin (I-5500), and dexamethasone (D-4902) were purchased from Sigma-Aldrich. All liquid culture media such as FBS (26140) and Dulbecco’s modified Eagle’s medium (DMEM, 11965) were acquired from Invitrogen.
Cell culture and differentiation
The mouse fibroblast cell line 3T3-L1 (CL-173) was purchased from the American Type Culture Collection. Cells were cultured in Dulbecco’s modified Eagle’s medium (DMEM) with 10% calf serum (16010159, Invitrogen) at 37 °C in a water-saturated atmosphere of 95% air and 5% CO2, avoiding situations in which the cells became too confluent (>70%) before the initiation of differentiation. Differentiation was initiated, however, in confluent 3T3-L1 preadipocytes by stimulation with induction media (10% FBS/DMEM with 115 μg/ml IBMX, 1 μg/ml insulin and 1 μmol/l dexamethasone). After 2 d of incubation, cells were maintained in insulin media (10% FBS/DMEM with 1 μg/ml insulin); media was changed every other day thereafter. Differentiated cells (adipocytes) were maintained in 10% FBS/DMEM. Before treatment, the medium was removed and fresh medium without FBS was added to remove the effects of ingredients contained in serum. After at least 4 h of incubation in serum-free media, vehicle (phosphate-buffered saline, PBS), 10 ng/ml EGF or 10 ng/ml TNF was added, and incubations continued for the indicated time periods. Adipogenesis experiments were carried on duplicate or triplicate as appropriate.
PCR array and qRT-PCR
After isolating total RNA and eliminating genomic DNA, reverse transcription reactions were performed at 42 °C for 15 min followed by 94 °C for 5 min. According to the manufacturer’s instructions, a real-time PCR was performed using a Bio-Rad CFX96 under the following two-step cycling program: 1 cycle at 95 °C for 10 min, 40 cycles at 95 °C for 15 s and at 60 °C for 1 min. Data analysis was performed based on a web-based PCR Array Data Analysis protocol (http://pcrdataanalysis.sabiosciences.com/pcr/arrayanalysis.php) provided by SABiosciences/Qiagen. Values for PCR array are the means from duplicate experiments. Primers used in qRT-PCR are described in . Experiments for qRT-PCR were performed at least in triplicate.
Western blot
Cell lysates were prepared, fractionated on SDS-polyacrylamide gels and transferred to nitrocellulose membranes according to established procedures. Blocking of nonspecific proteins was performed by incubation of the membranes with 5% nonfat dry milk in Tris buffered saline Tween-20 (TBST containing 10 mM Tris, 150 mM phosphate buffered saline, 0.05% Tween 20, pH 8.0) for 2 h at room temperature. Blots were incubated with primary antibodies at 1:1,000 dilution in blocking solution overnight at 4 °C. The membranes were washed 3 times with TBST for 10 min and followed by incubation for 1 h with horseradish peroxidase conjugated secondary antibody according to primary antibody, used at 1:2500 in 5% milk/TBST. The membranes were then rinsed 3 times with TBST for 10 min and the bands were visualized by enhanced chemiluminescence.
Statistical analysis
Data were expressed as mean ± SEM. Difference between two groups were analyzed by the paired Student t test with statistical significance of P ≤ 0.05.
Additional material
Download Zip (272.7 KB)Disclosure of Potential Conflicts of Interest
No potential conflicts of interest were disclosed.
Acknowledgments
This research was supported by NIGMS SC1 089630 (E.L.) and NIAID SC1AI089073 (D.S.) from the National Institutes of Health. Its contents are solely the responsibility of the authors and do not necessarily represent the official views of NIH. Suggestions and editorial assistance provided by Dr Diana Marver are gratefully acknowledged.
References
- Drong AW, Lindgren CM, McCarthy MI. The genetic and epigenetic basis of type 2 diabetes and obesity. Clin Pharmacol Ther 2012; 92:707 - 15; http://dx.doi.org/10.1038/clpt.2012.149; PMID: 23047653
- Hursting SD, Dunlap SM. Obesity, metabolic dysregulation, and cancer: a growing concern and an inflammatory (and microenvironmental) issue. Ann N Y Acad Sci 2012; 1271:82 - 7; http://dx.doi.org/10.1111/j.1749-6632.2012.06737.x; PMID: 23050968
- Johnson AR, Milner JJ, Makowski L. The inflammation highway: metabolism accelerates inflammatory traffic in obesity. Immunol Rev 2012; 249:218 - 38; http://dx.doi.org/10.1111/j.1600-065X.2012.01151.x; PMID: 22889225
- Simpson ER, Brown KA. Minireview: Obesity and breast cancer: a tale of inflammation and dysregulated metabolism. Mol Endocrinol 2013; 27:715 - 25; http://dx.doi.org/10.1210/me.2013-1011; PMID: 23518927
- Lumeng CN, Saltiel AR. Inflammatory links between obesity and metabolic disease. J Clin Invest 2011; 121:2111 - 7; http://dx.doi.org/10.1172/JCI57132; PMID: 21633179
- Odegaard JI, Chawla A. Pleiotropic actions of insulin resistance and inflammation in metabolic homeostasis. Science 2013; 339:172 - 7; http://dx.doi.org/10.1126/science.1230721; PMID: 23307735
- Sadik CD, Luster AD. Lipid-cytokine-chemokine cascades orchestrate leukocyte recruitment in inflammation. J Leukoc Biol 2012; 91:207 - 15; http://dx.doi.org/10.1189/jlb.0811402; PMID: 22058421
- Lazennec G, Richmond A. Chemokines and chemokine receptors: new insights into cancer-related inflammation. Trends Mol Med 2010; 16:133 - 44; http://dx.doi.org/10.1016/j.molmed.2010.01.003; PMID: 20163989
- Raman D, Sobolik-Delmaire T, Richmond A. Chemokines in health and disease. Exp Cell Res 2011; 317:575 - 89; http://dx.doi.org/10.1016/j.yexcr.2011.01.005; PMID: 21223965
- Huber J, Kiefer FW, Zeyda M, Ludvik B, Silberhumer GR, Prager G, Zlabinger GJ, Stulnig TM. CC chemokine and CC chemokine receptor profiles in visceral and subcutaneous adipose tissue are altered in human obesity. J Clin Endocrinol Metab 2008; 93:3215 - 21; http://dx.doi.org/10.1210/jc.2007-2630; PMID: 18492752
- Tamura Y, Sugimoto M, Murayama T, Minami M, Nishikaze Y, Ariyasu H, Akamizu T, Kita T, Yokode M, Arai H. C-C chemokine receptor 2 inhibitor improves diet-induced development of insulin resistance and hepatic steatosis in mice. J Atheroscler Thromb 2010; 17:219 - 28; http://dx.doi.org/10.5551/jat.3368; PMID: 20179360
- Kang YS, Cha JJ, Hyun YY, Cha DR. Novel C-C chemokine receptor 2 antagonists in metabolic disease: a review of recent developments. Expert Opin Investig Drugs 2011; 20:745 - 56; http://dx.doi.org/10.1517/13543784.2011.575359; PMID: 21466412
- Nara N, Nakayama Y, Okamoto S, Tamura H, Kiyono M, Muraoka M, Tanaka K, Taya C, Shitara H, Ishii R, et al. Disruption of CXC motif chemokine ligand-14 in mice ameliorates obesity-induced insulin resistance. J Biol Chem 2007; 282:30794 - 803; http://dx.doi.org/10.1074/jbc.M700412200; PMID: 17724031
- Chavey C, Lazennec G, Lagarrigue S, Clapé C, Iankova I, Teyssier J, Annicotte JS, Schmidt J, Mataki C, Yamamoto H, et al. CXC ligand 5 is an adipose-tissue derived factor that links obesity to insulin resistance. Cell Metab 2009; 9:339 - 49; http://dx.doi.org/10.1016/j.cmet.2009.03.002; PMID: 19356715
- Neels JG, Badeanlou L, Hester KD, Samad F. Keratinocyte-derived chemokine in obesity: expression, regulation, and role in adipose macrophage infiltration and glucose homeostasis. J Biol Chem 2009; 284:20692 - 8; http://dx.doi.org/10.1074/jbc.M109.018556; PMID: 19494115
- Vielma SA, Klein RL, Levingston CA, Young MR. Adipocytes as immune regulatory cells. Int Immunopharmacol 2013; 16:224 - 31; http://dx.doi.org/10.1016/j.intimp.2013.04.002; PMID: 23587489
- Park EJ, Lee JH, Yu GY, He G, Ali SR, Holzer RG, Osterreicher CH, Takahashi H, Karin M. Dietary and genetic obesity promote liver inflammation and tumorigenesis by enhancing IL-6 and TNF expression. Cell 2010; 140:197 - 208; http://dx.doi.org/10.1016/j.cell.2009.12.052; PMID: 20141834
- Son DS, Parl AK, Rice VM, Khabele D. Keratinocyte chemoattractant (KC)/human growth-regulated oncogene (GRO) chemokines and pro-inflammatory chemokine networks in mouse and human ovarian epithelial cancer cells. Cancer Biol Ther 2007; 6:1302 - 12; http://dx.doi.org/10.4161/cbt.6.8.4506; PMID: 17712227
- Son DS, Kabir SM, Dong YL, Lee E, Adunyah SE. Inhibitory effect of tumor suppressor p53 on proinflammatory chemokine expression in ovarian cancer cells by reducing proteasomal degradation of IκB. PLoS One 2012; 7:e51116; http://dx.doi.org/10.1371/journal.pone.0051116; PMID: 23300534
- Adachi H, Kurachi H, Homma H, Adachi K, Imai T, Morishige K, Matsuzawa Y, Miyake A. Epidermal growth factor promotes adipogenesis of 3T3-L1 cell in vitro. Endocrinology 1994; 135:1824 - 30; PMID: 7956906
- Schipper HS, Nuboer R, Prop S, van den Ham HJ, de Boer FK, Kesmir C, Mombers IM, van Bekkum KA, Woudstra J, Kieft JH, et al. Systemic inflammation in childhood obesity: circulating inflammatory mediators and activated CD14++ monocytes. Diabetologia 2012; 55:2800 - 10; http://dx.doi.org/10.1007/s00125-012-2641-y; PMID: 22806355
- Kurachi H, Adachi H, Ohtsuka S, Morishige K, Amemiya K, Keno Y, Shimomura I, Tokunaga K, Miyake A, Matsuzawa Y, et al. Involvement of epidermal growth factor in inducing obesity in ovariectomized mice. Am J Physiol 1993; 265:E323 - 31; PMID: 8103633
- Serrero G, Lepak NM, Hayashi J, Goodrich SP. Impaired epidermal growth factor production in genetically obese ob/ob mice. Am J Physiol 1993; 264:E800 - 3; PMID: 8498501
- Son DS, Kabir SM, Dong Y, Lee E, Adunyah SE. Characteristics of chemokine signatures elicited by EGF and TNF in ovarian cancer cells. J Inflamm (Lond) 2013; 10:25; http://dx.doi.org/10.1186/1476-9255-10-25; PMID: 23800251
- Chang MS, McNinch J, Basu R, Simonet S. Cloning and characterization of the human neutrophil-activating peptide (ENA-78) gene. J Biol Chem 1994; 269:25277 - 82; PMID: 7929219
- Floryk D, Kurosaka S, Tanimoto R, Yang G, Goltsov A, Park S, Thompson TC. Castration-induced changes in mouse epididymal white adipose tissue. Mol Cell Endocrinol 2011; 345:58 - 67; http://dx.doi.org/10.1016/j.mce.2011.07.011; PMID: 21782885
- Fenton JI, Nuñez NP, Yakar S, Perkins SN, Hord NG, Hursting SD. Diet-induced adiposity alters the serum profile of inflammation in C57BL/6N mice as measured by antibody array. Diabetes Obes Metab 2009; 11:343 - 54; http://dx.doi.org/10.1111/j.1463-1326.2008.00974.x; PMID: 19267713
- Gerhardt CC, Romero IA, Cancello R, Camoin L, Strosberg AD. Chemokines control fat accumulation and leptin secretion by cultured human adipocytes. Mol Cell Endocrinol 2001; 175:81 - 92; http://dx.doi.org/10.1016/S0303-7207(01)00394-X; PMID: 11325518
- McMellen ME, Wakeman D, Erwin CR, Guo J, Warner BW. Epidermal growth factor receptor signaling modulates chemokine (CXC) ligand 5 expression and is associated with villus angiogenesis after small bowel resection. Surgery 2010; 148:364 - 70; http://dx.doi.org/10.1016/j.surg.2010.03.020; PMID: 20471049
- Ménard D, Tremblay E, Ferretti E, Babakissa C, Perron N, Seidman EG, Levy E, Beaulieu JF. Anti-inflammatory effects of epidermal growth factor on the immature human intestine. Physiol Genomics 2012; 44:268 - 80; http://dx.doi.org/10.1152/physiolgenomics.00101.2011; PMID: 22214601
- Dong YL, Kabir SM, Lee ES, Son DS. CXCR2-driven ovarian cancer progression involves upregulation of proinflammatory chemokines by potentiating NF-κB activation via EGFR-transactivated Akt signaling. PLoS One 2013; 8:e83789; http://dx.doi.org/10.1371/journal.pone.0083789; PMID: 24376747
- Ping D, Boekhoudt GH, Rogers EM, Boss JM. Nuclear factor-kappa B p65 mediates the assembly and activation of the TNF-responsive element of the murine monocyte chemoattractant-1 gene. J Immunol 1999; 162:727 - 34; PMID: 9916692
- Fessele S, Boehlk S, Mojaat A, Miyamoto NG, Werner T, Nelson EL, Schlondorff D, Nelson PJ. Molecular and in silico characterization of a promoter module and C/EBP element that mediate LPS-induced RANTES/CCL5 expression in monocytic cells. FASEB J 2001; 15:577 - 9; PMID: 11259372
- Izquierdo MC, Sanz AB, Mezzano S, Blanco J, Carrasco S, Sanchez-Niño MD, Benito-Martín A, Ruiz-Ortega M, Egido J, Ortiz A. TWEAK (tumor necrosis factor-like weak inducer of apoptosis) activates CXCL16 expression during renal tubulointerstitial inflammation. Kidney Int 2012; 81:1098 - 107; http://dx.doi.org/10.1038/ki.2011.475; PMID: 22278019
- Garcia GE, Xia Y, Chen S, Wang Y, Ye RD, Harrison JK, Bacon KB, Zerwes HG, Feng L. NF-kappaB-dependent fractalkine induction in rat aortic endothelial cells stimulated by IL-1β, TNF-α, and LPS. J Leukoc Biol 2000; 67:577 - 84; PMID: 10770292
- Kim CS, Park HS, Kawada T, Kim JH, Lim D, Hubbard NE, Kwon BS, Erickson KL, Yu R. Circulating levels of MCP-1 and IL-8 are elevated in human obese subjects and associated with obesity-related parameters. Int J Obes (Lond) 2006; 30:1347 - 55; http://dx.doi.org/10.1038/sj.ijo.0803259; PMID: 16534530
- Samaan MC, Obeid J, Nguyen T, Thabane L, Timmons BW. Chemokine (C-C motif) Ligand 2 is a potential biomarker of inflammation & physical fitness in obese children: a cross-sectional study. BMC Pediatr 2013; 13:47; http://dx.doi.org/10.1186/1471-2431-13-47; PMID: 23557387
- Tsuchiya K, Yoshimoto T, Hirono Y, Tateno T, Sugiyama T, Hirata Y. Angiotensin II induces monocyte chemoattractant protein-1 expression via a nuclear factor-kappaB-dependent pathway in rat preadipocytes. Am J Physiol Endocrinol Metab 2006; 291:E771 - 8; http://dx.doi.org/10.1152/ajpendo.00560.2005; PMID: 16705055
- Keophiphath M, Rouault C, Divoux A, Clément K, Lacasa D. CCL5 promotes macrophage recruitment and survival in human adipose tissue. Arterioscler Thromb Vasc Biol 2010; 30:39 - 45; http://dx.doi.org/10.1161/ATVBAHA.109.197442; PMID: 19893003
- Kurki E, Shi J, Martonen E, Finckenberg P, Mervaala E. Distinct effects of calorie restriction on adipose tissue cytokine and angiogenesis profiles in obese and lean mice. Nutr Metab (Lond) 2012; 9:64; http://dx.doi.org/10.1186/1743-7075-9-64; PMID: 22748184
- Secchiero P, Corallini F, di Iasio MG, Gonelli A, Barbarotto E, Zauli G. TRAIL counteracts the proadhesive activity of inflammatory cytokines in endothelial cells by down-modulating CCL8 and CXCL10 chemokine expression and release. Blood 2005; 105:3413 - 9; http://dx.doi.org/10.1182/blood-2004-10-4111; PMID: 15644410
- Domanska UM, Kruizinga RC, Nagengast WB, Timmer-Bosscha H, Huls G, de Vries EG, Walenkamp AM. A review on CXCR4/CXCL12 axis in oncology: no place to hide. Eur J Cancer 2013; 49:219 - 30; http://dx.doi.org/10.1016/j.ejca.2012.05.005; PMID: 22683307
- Chung S, Lapoint K, Martinez K, Kennedy A, Boysen Sandberg M, McIntosh MK. Preadipocytes mediate lipopolysaccharide-induced inflammation and insulin resistance in primary cultures of newly differentiated human adipocytes. Endocrinology 2006; 147:5340 - 51; http://dx.doi.org/10.1210/en.2006-0536; PMID: 16873530
- Ruan H, Hacohen N, Golub TR, Van Parijs L, Lodish HF. Tumor necrosis factor-α suppresses adipocyte-specific genes and activates expression of preadipocyte genes in 3T3-L1 adipocytes: nuclear factor-kappaB activation by TNF-α is obligatory. Diabetes 2002; 51:1319 - 36; http://dx.doi.org/10.2337/diabetes.51.5.1319; PMID: 11978627
- Kurebayashi S, Sumitani S, Kasayama S, Jetten AM, Hirose T. TNF-α inhibits 3T3-L1 adipocyte differentiation without downregulating the expression of C/EBPbeta and δ. Endocr J 2001; 48:249 - 53; http://dx.doi.org/10.1507/endocrj.48.249; PMID: 11456275
- Laurencikiene J, van Harmelen V, Arvidsson Nordström E, Dicker A, Blomqvist L, Näslund E, Langin D, Arner P, Rydén M. NF-kappaB is important for TNF-α-induced lipolysis in human adipocytes. J Lipid Res 2007; 48:1069 - 77; http://dx.doi.org/10.1194/jlr.M600471-JLR200; PMID: 17272828
- Cawthorn WP, Sethi JK. TNF-α and adipocyte biology. FEBS Lett 2008; 582:117 - 31; http://dx.doi.org/10.1016/j.febslet.2007.11.051; PMID: 18037376
- Tzanavari T, Giannogonas P, Karalis KP. TNF-α and obesity. Curr Dir Autoimmun 2010; 11:145 - 56; http://dx.doi.org/10.1159/000289203; PMID: 20173393
- Ma B, Zhu Z, Homer RJ, Gerard C, Strieter R, Elias JA. The C10/CCL6 chemokine and CCR1 play critical roles in the pathogenesis of IL-13-induced inflammation and remodeling. J Immunol 2004; 172:1872 - 81; PMID: 14734772
- LaFleur AM, Lukacs NW, Kunkel SL, Matsukawa A. Role of CC chemokine CCL6/C10 as a monocyte chemoattractant in a murine acute peritonitis. Mediators Inflamm 2004; 13:349 - 55; http://dx.doi.org/10.1080/09629350400014172; PMID: 15770051
- Bigorgne AE, Bouchet-Delbos L, Naveau S, Dagher I, Prévot S, Durand-Gasselin I, Couderc J, Valet P, Emilie D, Perlemuter G. Obesity-induced lymphocyte hyperresponsiveness to chemokines: a new mechanism of Fatty liver inflammation in obese mice. Gastroenterology 2008; 134:1459 - 69; http://dx.doi.org/10.1053/j.gastro.2008.02.055; PMID: 18471520
