
 ?Mathematical formulae have been encoded as MathML and are displayed in this HTML version using MathJax in order to improve their display. Uncheck the box to turn MathJax off. This feature requires Javascript. Click on a formula to zoom.
Abstract
In this study, total RNA was collected from abdominal adipose tissue samples obtained from ten broiler chickens at 3, 4, 5, and 6 weeks of age and prepared for gene microarray analysis with Affymetrix GeneChip Chicken Genome Arrays (Affymetrix) and quantitative real-time PCR analysis. Studies of global gene expression in chicken adipose tissue were initiated since such studies in many animal species show that adipose tissue expresses and secretes many factors that can influence growth and physiology. Microarray results indicated 333 differentially expressed adipose tissue genes between 3 and 6 wk, 265 differentially expressed genes between 4 and 6 wk and 42 differentially expressed genes between 3 and 4 wk. Enrichment scores of Gene Ontology Biological Process categories indicated strong age upregulation of genes involved in the immune system response. In addition to microarray analysis, quantitative real-time PCR analysis was used to confirm the influence of age on the expression of adipose tissue CC chemokine ligands (CCL), toll-like receptor (TLR)-2, lipopolysaccharide-induced TNF factor (LITAF), chemokine (C-C motif) receptor 8 (CCR8), and several other genes. Between 3 and 6 wk of age CCL5, CCL1, and CCR8 expression increased (P = 0.0001) with age. Furthermore, TLR2, CCL19, and LITAF expression increased between 4 and 6 wk of age (P = 0.001). This is the first demonstration of age related changes in CCL, LITAF, and TLR2 gene expression in chicken adipose tissue. Future studies are needed to elucidate the role of these adipose tissue genes in growth and the immune system.
Introduction
White adipose tissue stores excess energy as triglycerides in animals. It is desirable to reduce the deposition of adipose tissue since this would increase feed efficiency and decrease production costs. However, it is important to note that adipose tissue secretes a variety of proteins that include leptin, chemokines, adiponectin, interleukin (IL)-6, and IL-8 (for a review, see ref. 1). Secretion of these factors by adipose tissue impacts a number of physiological and metabolic processes (for a review, see ref. 1). For instance, secretion of cytokines and expression of toll-like receptors (TLR) regulate the host response to infection and immunity.Citation2 Gene expression of adipose tissue secreted factors and other regulatory factors has been studied with cDNA microarrays,Citation3 but this approach has been employed on a very limited basis in studies of broiler chicken adipose tissue.Citation4-6 Production of broiler chickens represents a significant segment of the meat animal industry since growing broilers may be the most efficient producer of lean meat compared with swine and bovine species.Citation7,8 Selection for leanness in broiler chickens has produced significant increases in muscle in a remarkably short period of time.Citation7,8 The major fat depot in broiler chickens is the abdominal fat depot and selection reduced the abdominal fat depot during growth in a remarkable short period of time.Citation7 Simply put, no other species grows as fast and efficiently as does the broiler chicken.Citation7,8 We examined the possibility that the expression of many immune system and related factors in broiler adipose tissue respond to the rapid rate of broiler growth which may induce an inflammatory response. Little is known of gene expression of other immune system components in broiler adipose tissue throughout development. Therefore, we report, herein, for the first time, with microarray and quantitative real-time PCR (qPCR) assays key immune related gene expression in chicken adipose tissue in growing broiler chickens.
Results
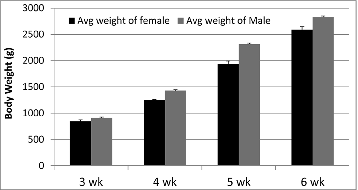
Broiler body weights (g), using means ± SEM where female to male ratios were 4:5, 4:5, 4:4, and 4:5 for 3, 4, 5, and 6 wk respectively, display a difference (P value < 0.001; one way ANOVA) from each other at each age (). There was no gender × age interaction detected for body weights.
Figure 1. Body weights by gender and age of broilers. Each age group represents 4 females and 5 males except 5 wk, which has 4 females and 4 males (data = mean ± SEM). Age similarly increased body weights of male and female broiler chickens (P value < 0.05).
Patterns of gene expression in broiler adipose tissue across all ages
We calculated expression of each gene relative to a reference gene for several gene groups after gene percentages from adipose tissue microarrays were combined for all ages. Comparing the “relative expression” of TLR, IL, and CCL17 genes to each other within each gene group helped to establish patterns of expression for these gene groups. The expression patterns showed that TLR2, IL-5, and CCL7 were clearly predominantly expressed in the respective gene groups regardless of the reference gene (unpublished data). Since fatty acid binding protein (FABP)4 is the adipose tissue FABP and lipoprotein lipase (LPL) also effectively marks adipose tissue we determined the ratio of gene expression for FABP4 and LPL relative to glycoprotein hormones, α protein (CGA), a gene found primarily in the brain. These ratios were 7.2 ± 0.01 for FABP4/CGA and 6.5 ± 0.1 for LPL/CGA. We similarly expressed the enzyme folate hydrolase (FOLH1), a non-adipocyte gene (prostate-specific) FOHL1/CGA = 1.1 ± 0.02 and liver FABP (FABP1)/GCA = 3.3 ± 0.1 as tissue controls. As expected in adipose tissue, among the genes with the highest relative expression were FABP4 and LPL.
Effects of age on expression of genes in adipose tissue from growing broiler chickens
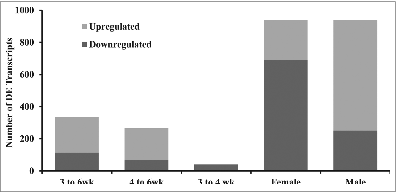
Microarray results identified 113 downregulated and 220 upregulated differentially expressed (DE) transcripts between 3 and 6 wk and 67 downregulated and 198 upregulated DE transcripts between 4 and 6 wk. The majority of DE transcripts between 3 and 6 wk and 4 and 6 wk were upregulated (). Across all ages, 689 transcripts were downregulated and 251 upregulated in females compared with males, whereas 251 were downregulated and 689 were upregulated in male chickens (). The gene-by-gene analysis that was conducted indicated no evidence of an interaction between age and gender transcripts at q ≤ 0.07. For simplicity, changes in RNA levels detected by these probe sets will be referred to as gene expression differences.
Figure 2. Summary of differentially expressed (DE) transcripts (q < 0.07) in chicken adipose tissue. Number of differentially expressed transcripts for female and male are across all ages. P value cutoffs for 3 to 6 wk, 4 to 6 wk, 3 to 4 wk, female, and male are 6.1E–4, 4.8E–4, 8.0E–5, 1.9E–3, and 1.9E–3 respectively.
Biological processes affected by age in adipose tissue
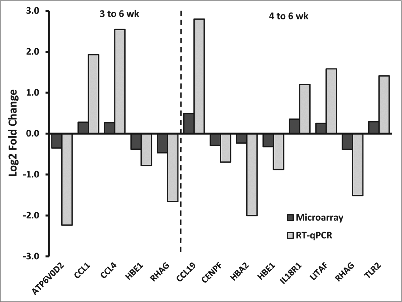
To identify biological processes that were influenced by age, DE genes in adipose tissue were analyzed for overrepresentation in GO Biological Process categories and KEGG biological pathways ( and ). In addition, the KEGG biological pathway database was used to identify specific biological pathways overrepresented by genes that responded to age in adipose tissue (). Adipose tissue underwent significant upregulation of transcriptional changes in response to age. Major groups of genes associated with the immune system process, immune response and immune system comprised a major component of the upregulation of transcriptional changes in adipose tissue. We selected a group of DE genes for quantitative real-time PCR () based on the GO enrichment analysis and pathway analysis and the extent of fold changes ( and ). Note the marked fold changes in CCL1, CCL5, CCL19, CCR8 (RCJMBO4_31M22), LITAF, and TLR2B with age (). A number of genes involved in Toll-like receptor signaling were significantly upregulated (TLR15, TLR4, TLR7 and similar to TLR21) with age as were chemokine receptors and ligands (CX3CRI, CCL4; Table S1). Furthermore, expression of CD8a, CD8b, and CD7 antigens were also upregulated in adipose tissue with age (Table S1). Microarray analysis also indicated that genes expressing complement component 1 and tumor necrosis factor superfamily member 13d were expressed by chicken adipose tissue in an age independent manner (Table S1).
Table 1. Main themes and enrichment scoresa from DAVIDb of clusters of GO Biological Process categories for up and downregulated genes (q < 0.07) in adipose tissue
Table 2. Summary of changes in adipose tissue with age displaying pathway themes,a pathways,b and number of genesc associated
Table 3. Immune related and other genes in chicken adipose tissue that were influenced by age. Log2 fold changes are a comparison of quantitative real-time PCR expression values from different ages
Groups of genes associated with signal transduction, chemotaxis, signaling molecules and interaction represented a minor component of the upregulation of transcriptional changes in adipose tissue relative to genes associated with immune response and immune system process ( and ; Table S1). Overall, there was little downregulation of gene expression in broiler adipose tissue with age ( and ). Our data indicated little change in the expression of genes involved lipid metabolism such as acyl-CoA synthetase long-chain family member 3 and 3-hydroxy-3-methylglutaryl-Coenzyme A synthase1in adipose tissue from growing broilers (Table S1). Furthermore, there was little age associated change in expression of genes involved in carbohydrate metabolism such as phosphoglucomutase 3 and fructose-1,6-bisphosphatase in broiler adipose tissue (Table S1).
Microarray data validation
Expression of selected upregulated and several downregulated genes in the microarray analysis were verified by qPCR (). Genes were selected based on gene expression in the microarray analysis. Although the microarray data fold changes for these genes were not substantial they were significantly different with age (Table S1). The direction of change was the same for RT-PCR and microarray values (). Therefore, the results obtained from the microarray analysis were confirmed for these genes
Figure 3. Quantitative real-time PCR (qPCR) validation of microarray data on a subset of genes in adipose tissue. Gene expression, log2-fold changes, measured by microarray compared with qPCR. Genes were selected based on relevant age related changes in the microarray analysis. Representative Affymetrix probe sets were chosen by the best alignment of the Affymetrix probe set target sequence to the Taqman Gene Expression Assay context sequence. All genes had a difference (P < 0.05, factorial ANOVA) in qPCR expression between age groups. Microarray changes were statistically significant.
Discussion
Considering the results of the present study with our previous demonstration of IL-IB, IL-15, and IL-18 genes expressed by broiler chicken adipose tissueCitation9 indicates that chicken adipose tissue meets many of the criteria necessary to be considered an immunological organ as has been suggested for adipose tissue in general.Citation10 For example, our results demonstrate age associated changes in the expression of many immune related genes in broiler chicken adipose tissue. Two main GO enrichment cluster themes indicated that genes upregulated by age were predominantly involved in several major processes i.e., the immune response and the immune system processes. Furthermore, anatomically. chicken abdominal adipose tissue can be considered a “visceral” adipose tissue which is involved in differential expression of pro- and anti-inflammatory adipokines in the mouse during diet induced obesity.Citation11 Upregulated inflammatory genes in mouse visceral adipose tissue include pro-inflammatory cytokines, chemokines, and their upstream signaling pathway genes.Citation11
Furthermore, nine genes associated with the Toll-like receptor (TLR) signaling pathway were upregulated with age. Numerous genes associated with the natural killer cell mediated cytotoxicity were also upregulated with age in brolier adipose tissue in the present study as were a number of chemokine ligands and receptor genes. For instance CCL1, CCL5, CCL4, CCL19, and CX3R1 were significantly up- regulated with age. Chemokines are secreted chemotactic cytokines that regulate and determine the nature of the immune response.Citation2,12,13 Therefore, the anatomical location of the bulk of broiler chicken adipose tissue may pre-dispose it to be functionally immunological.
Over the past 44 y genetic selection for leanness has increased the rate of growth in broiler chickens 6-fold and doubled breast muscle.Citation7,8 It is possible that this rapid change in rate of growth in broiler chickens may have induced an inflammatory response since growth processes may have been stimulated beyond normal homeostatic mechanisms. Therefore the upregulation of immune system related factors may be attributable to inflammation induced by the extreme growth rates in broiler chickens. Although, an infection or infectious agents would upregulate immune system related factors it is unlikely to be involved based on the health and appearance of the chickens.
In the present study a number of genes associated with adipogenesis, i.e., LPL, FABP4, peroxisome proliferator-activated receptor γ, and CCAAT/enhancer binding protein α did not change with age coupled with little upregulation of genes involved in lipid metabolism indicated by microarray analysis. This is not totally unexpected since in the chicken, liver is the primary source of de novo fatty acid synthesis compared with adipose tissue.Citation14 Nevertheless, microarray studies of pig adipose tissue also showed that these adipogenic genes changed little to not at all with age despite increased adiposity.Citation15,16 Furthermore, the adipogenic genes FABP4 and LPL were not differentially expressed between obese and lean chicken adipose tissue.Citation5,6 Therefore, these adipogenic factors may be maximally expressed and therefore not rate limiting at the gene level during lipid accretion in vivo.
In conclusion, chicken abdominal adipose tissue may be considered an immunological organ and analogous to visceral fat in other species. Furthermore, the genetically induced extreme growth rate in broiler chickens may precipitate upregulation of immune system related factors in abdominal fat.
Impact
Rodent and human studies show that fat tissue secretes many gene products indicating that fat tissue plays an unexpected but important role in the innate immune response, immune system response, and inflammatory responses. Identification of gene products secreted by fat tissue continues on as global approaches are used to study fat tissue proteins and genes. A number of chicken fat tissue genes were studied in our studies of growing broilers and many immune related gene levels changed with age. However, several gene levels did not change with age but a number of genes were identified in chicken fat tissue for the first time. Many of these immune related genes can significantly influence the immune response and possibly growth. Therefore, fat tissue immune related genes represent a potential new target for regulating physiological processes in the growing broiler chickens.
Materials and Methods
Three hundred Cobb 500 straight run broilers were placed within 12 pens at a bird density of 0.07 m2/bird (0.7 ft2/bird). Birds were reared on pine shavings at a depth of 10 cm (4 in). Birds were fed standard broiler diets, including a crumbled starter (d 0–21) and a pelleted grower (d 21–42). Birds had unrestricted access to food and water via a hanging tube feeder and nipple drinker line. Birds were managed according to primary breeder guidelines (http://www.cobb-vantress.com/products/guide-library/general/brooding-fundamentals-guide; http://www.cobb-vantress.com/products/guide-library/general/broiler-management-guide). Bird and feed weights were recorded on d 0, 7, 21, and 42. Mortality was recorded daily. The current experimental protocol was approved by the Institutional Animal Care and Use Committee of The University of Georgia.
Isolation of total RNA
Total RNA was isolated from adipose tissues by extraction with QIAzol Lysis Reagent (Qiagen Inc.) followed by isopropanol precipitation of the aqueous phase. RNA was resuspended in water and immediately purified on Qiagen's RNEasy Mini Columns according to the manufacturer's procedure. Total RNA quality and quantity was determined by microfluidic analysis on an Agilent 2100 Bioanalyzer (Agilent Technologies). Each RNA extract was divided into aliquots for use with Affymetrix Gene Chips and qPCR.
Affymetrix arrays
Affymetrix GeneChip Chicken Genome Arrays (Affymetrix) were processed at Almac Diagnostics. RNA samples were analyzed for concentration, purity and integrity by using spectrophotometric methods in combination with the Agilent Bioanalyzer. Total RNA was amplified using the NuGEN Applause 3′ Amp System (NuGEN Technologies, Inc.). First-strand synthesis of cDNA was performed using a unique first-strand DNA/RNA chimeric primer mix, resulting in cDNA/mRNA hybrid molecules. Following fragmentation of the mRNA component of the cDNA/mRNA molecules, second-strand synthesis was performed and double-stranded cDNA was formed with a unique DNA/RNA heteroduplex at one end. In the final amplification step, RNA within the heteroduplex was degraded using RNase H, and replication of the resultant single-stranded cDNA was achieved through DNA/RNA chimeric primer binding and DNA polymerase enzymatic activity. The amplified single-stranded cDNA was purified for accurate quantitation of the cDNA and to ensure optimal performance during the fragmentation and labeling process. The single stranded cDNA was assessed using spectrophotometric methods in combination with the Agilent Bioanalyzer. The appropriate amount of amplified single-stranded cDNA was fragmented and labeled using the Encore Biotin Module (NuGEN Technologies, Inc.). The enzymatically and chemically fragmented product (50–100 nucleotides) was labeled via the attachment of biotinylated nucleotides onto the 3′-end of the fragmented cDNA. The resultant fragmented and labeled cDNA was added to the hybridization cocktail in accordance with the NuGEN guidelines for hybridization onto Affymetrix GeneChip arrays. Following the hybridization for 16–18 h at 45°C in an Affymetrix GeneChip Hybridization Oven 640, the array was washed and stained on the GeneChip Fluidics Station 450 using the appropriate fluidics script, before being inserted into the Affymetrix autoloader carousel and scanned using the GeneChip Scanner 3000. Quality control measures to assess sample preparation, hybridization, and data integrity were as follows: comparisons of (1) average backgrounds, (2) percent present calls, (3) scaling factors, (4) raw Q noise values, and (5) glyceraldehyde 3-phosphate dehydrogenase and β-actin 3′/5′ ratios, E. coli and P1 bacteriophage hybridization controls, B. subtilis polyA control gene spikes, Pearson correlation hierarchical clustering analysis, and principal components analysis. One sample was identified as an outlier and was excluded from downstream expression analysis.
Gene ontology biological process enrichment and pathway analysis
Gene Ontology (GO) enrichment analysis was performed by tools available at Database for Annotation, Visualization and Integrated Discovery (DAVID) v6.7 Bioinformatics Resources.Citation17,18 The transcriptome background for adipose tissue consisted of all genes on the GeneChip Chicken Genome Arrays that were in DAVID's Affy array database. Redundancies caused by multiple probe sets that were annotated to the same gene were eliminated. This resulted in a transcriptome of 28 556 genes for adipose tissue. For GO enrichment analysis, the lists of differently expressed (DE) genes (q ≤ 0.07) were divided into up and down expression and redundant genes were eliminated. Each list was analyzed for overrepresentation (enrichment P ≤ 0.1) in all levels of GO Biological Processes using DAVID's Gene Functional Annotation tool with medium stringency settings. GO enrichment cluster themes were denoted by the biological process with the smallest P value for each cluster. Kyoto Encyclopedia of Genes and Genomes (KEGG) (release 49.0) pathwaysCitation19-21 were assigned to DE genes and pathway themes were determined by KEGG orthology identifiers in KEGG's BRITE database.
Quantitative real-time PCR
Quantitative real-time PCR was performed using Gallus gallus Taqman Gene Expression Assays (Applied Biosystems Inc.), consisting of forward primer, reverse primer, and 6FAM dye: MGB labeled probe (). A custom Taqman Gene Expression Assay based on chicken 18S rRNA was designed as an endogenous control. Three micrograms of total RNA was transcribed into cDNA in a volume of 20 μL with Superscript III First-Strand Synthesis System (Invitrogen Corp.) utilizing random hexamers and following the manufacturer's protocol (25°C for 10 min, 50°C for 50 min). The cDNA was diluted for use as template in the amplification reaction. The cDNA input per reaction corresponded to 15 ng RNA. The amplification reaction consisted of 1 μL diluted cDNA, 10 μL iQ Supermix (Bio-Rad Laboratories), 0.8 μL 20× custom TaqMan® Gene Expression Assay, and water up to a total volume of 20 μL. To measure each assay's probe reaction efficiency, a series of 20 μL reactions was performed similar to the above using as template 1 μL of a 3-fold to 2187-fold range of serial dilutions of a pool of all available cDNA's. PCR was performed in the CFX 96 Real-Time PCR Detection System (Bio-Rad Laboratories). Thermal cycling parameters were as follows: an initial denaturation step (95°C for 10 min), followed by 40 cycles of denaturation and annealing/extension (95°C for 15 s, 60°C for 1 min) in a 96-well optical plate.
Table 4. Taqman primers
Analysis of quantitative real-time PCR data
Threshold cycle (Ct) values were determined using CFX Manager Software (Bio-Rad Laboratories). Automatic background fluorescence and thresholds were checked and no adjustments were determined necessary. Within-sample triplicate well reactions that did not fall within 1 cycle of each other were repeated and the original reactions excluded from analysis. The Ct values of within-sample triplicate wells were averaged. Relative differences in gene expression were determined by two-way ANOVA using the Statistical Analysis Software System for Windows V8 (SAS Institute Inc.) with age and gender as the main effects, followed by analysis in Relative Expression Software Tool V2.0.7 (REST 2008) (Corbett Research Pty Ltd.; 5). REST was used both to specify differences identified by two-way ANOVA and to incorporate probe efficiencies in the calculation of differential expression ratios. Sample, endogenous control and probe reaction efficiency Ct's were imported into REST. Biological replicates were not averaged before import. Statistical significance was set at (P ≤ 0.05) and the reference gene was 18S rRNA. The ratio in each case compared the expression of older to younger age. Log base 2 transformations were performed on these ratios.
Analysis of affymetrix data
Background adjustment and data normalization of raw data were done in R 2.11.1 using Bioconductor's affy package.Citation22,23 Probe intensities were adjusted based upon a weighted average of the backgrounds for each region. The weights were based on the distances between the location of the probe and the centroids of 16 different regions. Several studiesCitation24 have reported the limited contribution of mismatch (MM) data as well as the potential for adding more noise; consequently, only perfect match (PM) data were used in this study.
A scaling/linear method for normalizing the raw Affymetrix data was used in the analysis. This method was implemented by selecting a baseline array and then fitting a linear regression without intercept term between each array and the chosen array. The resulting fitted regression line was used as the normalizing relationship. The log base 2 transformation was performed on the background adjusted and normalized PM intensities as suggested by previous studies.Citation25
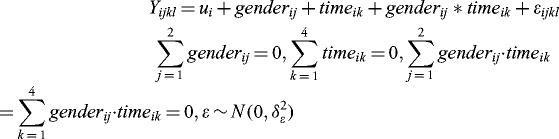
A mixed linear model was used to analyze the probe level intensities for every gene separately. For each gene i, to estimate the marginal effects of gender or time on the values of gene expression, the following ANOVA model was used:
by executing the R command “aov(value∼factor(time)+factor(gender),temp).” The P values for the pairwise differences between the different levels of a factor were computed using Tukey Honest Significant Differences by executing the R command “TukeyHSD (m1).” The fold changes were the ratios of mean expression values between ages or between genders. To assess the interactive effects between gender and time on the values of gene expression, the following ANOVA model was used:
by executing the R command “aov(value∼factor(time)*factor(gender),temp).” The Hochberg Benjamini methodCitation26 for false discovery rate calculation was used in order to account for the multiple comparisons.
Disclosure of Potential Conflicts of Interest
No potential conflicts of interest were disclosed.
Supplemental Material
Supplemental data for this article can be accessed on the publisher's website.
964518_Supplemental_files.zip
Download Zip (248 KB)References
- Trayhurn P. Endocrine and signalling role of adipose tissue: new perspectives on fat. Acta Physiol Scand 2005; 184:285-93; PMID:16026420; http://dx.doi.org/10.1111/j.1365-201X.2005.01468.x
- Schäffler A, Schölmerich J. Innate immunity and adipose tissue biology. Trends Immunol 2010; 31:228-35; PMID:20434953; http://dx.doi.org/10.1016/j.it.2010.03.001
- Taleb S, Van Haaften R, Henegar C, Hukshorn C, Cancello R, Pelloux V, Hanczar B, Viguerie N, Langin D, Evelo C, et al. Microarray profiling of human white adipose tissue after exogenous leptin injection. Eur J Clin Invest 2006; 36:153-63; PMID:16506959; http://dx.doi.org/10.1111/j.1365-2362.2006.01614.x
- Bourneuf E, Hérault F, Chicault C, Carré W, Assaf S, Monnier A, Mottier S, Lagarrigue S, Douaire M, Mosser J, et al. Microarray analysis of differential gene expression in the liver of lean and fat chickens. Gene 2006; 372:162-70; PMID:16513294; http://dx.doi.org/10.1016/j.gene.2005.12.028
- Wang H, Li H, Wang Q, Wang Y, Han H, Shi H. Microarray analysis of adipose tissue gene expression profiles between two chicken breeds. J Biosci 2006; 31:565-73; PMID:17301494; http://dx.doi.org/10.1007/BF02708408
- Wang HB, Li H, Wang QG, Zhang XY, Wang SZ, Wang YX, Wang XP. Profiling of chicken adipose tissue gene expression by genome array. BMC Genomics 2007; 8:193; PMID:17594506; http://dx.doi.org/10.1186/1471-2164-8-193
- Havenstein GB, Ferket PR, Qureshi MA. Carcass composition and yield of 1957 versus 2001 broilers when fed representative 1957 and 2001 broiler diets. Poult Sci 2003; 82:1509-18; PMID:14601726; http://dx.doi.org/10.1093/ps/82.10.1509
- Havenstein GB, Ferket PR, Qureshi MA. Growth, livability, and feed conversion of 1957 versus 2001 broilers when fed representative 1957 and 2001 broiler diets. Poult Sci 2003; 82:1500-8; PMID:14601725; http://dx.doi.org/10.1093/ps/82.10.1500
- Hausman GJ, Barb CR, Fairchild BD, Gamble J, Lee-Rutherford L. Expression of genes for interleukins, neuropeptides, growth hormone receptor, and leptin receptor in adipose tissue from growing broiler chickens. Domest Anim Endocrinol 2012; 43:260-3; PMID:22560177; http://dx.doi.org/10.1016/j.domaniend.2012.03.008
- Schäffler A, Schölmerich J, Salzberger B. Adipose tissue as an immunological organ: Toll-like receptors, C1q/TNFs and CTRPs. Trends Immunol 2007; 28:393-9; PMID:17681884; http://dx.doi.org/10.1016/j.it.2007.07.003
- Kwon EY, Shin SK, Cho YY, Jung UJ, Kim E, Park T, Park JH, Yun JW, McGregor RA, Park YB, et al. Time-course microarrays reveal early activation of the immune transcriptome and adipokine dysregulation leads to fibrosis in visceral adipose depots during diet-induced obesity. BMC Genomics 2012; 13:450; PMID:22947075; http://dx.doi.org/10.1186/1471-2164-13-450
- Kaiser P, Wu Z, Rothwell L, Fife M, Gibson M, Poh TY, Shini A, Bryden W, Shini S. Prospects for understanding immune-endocrine interactions in the chicken. Gen Comp Endocrinol 2009; 163:83-91; PMID:18957294; http://dx.doi.org/10.1016/j.ygcen.2008.09.013
- Zlotnik A, Yoshie O. Chemokines: a new classification system and their role in immunity. Immunity 2000; 12:121-7; PMID:10714678; http://dx.doi.org/10.1016/S1074-7613(00)80165-X
- Hermier D. Lipoprotein metabolism and fattening in poultry. J Nutr 1997; 127(Suppl):805S-8S; PMID:9164241
- Hausman GJ, Barb CR, Dean RG. Patterns of gene expression in pig adipose tissue: transforming growth factors, interferons, interleukins, and apolipoproteins. J Anim Sci 2007; 85:2445-56; PMID:17644780; http://dx.doi.org/10.2527/jas.2007-0142
- Hausman GJ, Barb CR, Dean RG. Patterns of gene expression in pig adipose tissue: insulin-like growth factor system proteins, neuropeptide Y (NPY), NPY receptors, neurotrophic factors and other secreted factors. Domest Anim Endocrinol 2008; 35:24-34; PMID:18325722; http://dx.doi.org/10.1016/j.domaniend.2008.01.004
- Huang W, Sherman BT, Lempicki RA. Bioinformatics enrichment tools: paths toward the comprehensive functional analysis of large gene lists. Nucleic Acids Res 2009; 37:1-13; PMID:19033363; http://dx.doi.org/10.1093/nar/gkn923
- Huang W, Sherman BT, Lempicki RA. Systematic and integrative analysis of large gene lists using DAVID bioinformatics resources. Nat Protoc 2009; 4:44-57; PMID:19131956; http://dx.doi.org/10.1038/nprot.2008.211
- Kanehisa M, Goto S, Hattori M, Aoki-Kinoshita KF, Itoh M, Kawashima S, Katayama T, Araki M, Hirakawa M. From genomics to chemical genomics: new developments in KEGG. Nucleic Acids Res 2006; 34:D354-7; PMID:16381885; http://dx.doi.org/10.1093/nar/gkj102
- Kanehisa M, Araki M, Goto S, Hattori M, Hirakawa M, Itoh M, Katayama T, Kawashima S, Okuda S, Tokimatsu T, et al. KEGG for linking genomes to life and the environment. Nucleic Acids Res 2008; 36:D480-4; PMID:18077471; http://dx.doi.org/10.1093/nar/gkm882
- Kanehisa M, Goto S. KEGG: kyoto encyclopedia of genes and genomes. Nucleic Acids Res 2000; 28:27-30; PMID:10592173; http://dx.doi.org/10.1093/nar/28.1.27
- Gentleman RC, Carey VJ, Bates DM, Bolstad B, Dettling M, Dudoit S, Ellis B, Gautier L, Ge Y, Gentry J, et al. Bioconductor: open software development for computational biology and bioinformatics. Genome Biol 2004; 5:R80; PMID:15461798; http://dx.doi.org/10.1186/gb-2004-5-10-r80
- Gautier L, Cope L, Bolstad BM, Irizarry RA. affy–analysis of Affymetrix GeneChip data at the probe level. Bioinformatics 2004; 20:307-15; PMID:14960456; http://dx.doi.org/10.1093/bioinformatics/btg405
- Chu TM, Weir B, Wolfinger R. A systematic statistical linear modeling approach to oligonucleotide array experiments. Math Biosci 2002; 176:35-51; PMID:11867082; http://dx.doi.org/10.1016/S0025-5564(01)00107-9
- Irizarry RA, Hobbs B, Collin F, Beazer-Barclay YD, Antonellis KJ, Scherf U, Speed TP. Exploration, normalization, and summaries of high density oligonucleotide array probe level data. Biostatistics 2003; 4:249-64; PMID:12925520; http://dx.doi.org/10.1093/biostatistics/4.2.249
- Benjamini Y, Hochberg Y. Controlling the false discovery rate:a practical and powerful approach to multiple testing. J Roy Stat Soc B 1995; 57:289-300.