Abstract
Subcutaneous adipose tissue expansion through adipogenesis is increasingly recognized as a major determinant of body fat distribution and obesity-related cardiometabolic alterations. Our objective was to assess whether adipogenic rates of cultured human primary preadipocytes from the visceral and subcutaneous compartments relate to visceral obesity and cardiometabolic alterations. We recruited 35 women undergoing gynecological surgery and assessed body fat distribution by CT as well as fasting plasma lipids and glycemia. Fat samples from the greater omentum and abdominal subcutaneous (SC) compartments were used to assess mature adipocyte cell size and establish primary preadipocyte cultures. Differentiation was induced using adipogenic media and adipogenic rates were assessed using Oil Red O (ORO) absorbance/DNA content ratio and glyceraldehyde 3-phosphate dehydrogenase (G3PDH) activity/DNA of differentiated cells. We found a lower adipogenic capacity of omental (OM) preadipocytes than SC preadipocytes originating from the same women (P < 0.05). Whereas only OM cell size was different among groups of low vs high OM adipogenic rate, SC adipogenic rates were clearly related to increased OM cell size and dyslipidemia when women were separated on median value of either ORO/DNA or G3PDH activity/DNA ratios. When matched for BMI, women with low SC preadipocyte adipogenic rates had a higher visceral adipose tissue area (P < 0.01), omental adipocyte hypertrophy (P < 0.05), higher VLDL-lipid content (P < 0.01) and higher fasting glycemia (P < 0.05) than those with low SC adipogenic rates. In conclusion, low abdominal subcutaneous preadipocyte differentiation capacity in vitro is associated with visceral obesity, visceral adipocyte hypertrophy, and a dysmetabolic state.
Introduction
Obesity is a heterogeneous condition in terms of body fat distribution and cardiometabolic complications, but also in terms of adipose tissue cellular composition in each fat compartment.Citation1 Expansion of any given compartment occurs through fat cell hypertrophy (increase in cell size) and/or hyperplasia (increase in cell number), the latter which results from the differentiation of precursor cells (preadipocytes) into lipid-storing, mature adipocytes.Citation2 Cell hypertrophy has been widely documented. In fact, hypertrophy occurs in both fat compartments as subcutaneous (SC) and omental (OM) adipocyte sizes increase with BMI, in men and women, to reach a plateau in morbidly obese patients.Citation3 In women, OM adipocytes are known to be smaller than SC cells independently of BMI.Citation4 Adipocyte hypertrophy is related to impaired adipose tissue function including high responses to lipolytic agonists, lower DGAT activity and macrophage infiltration.Citation5-Citation7 Data linking adipocyte hyperplasia to obesity and metabolic alterations are more limited.Citation8 Adipocyte precursors have been reported to be in smaller amounts in visceral adipose tissue (VAT) than in subcutaneous adipose tissue (SAT).Citation9 A majority of studies reported that preadipocyte adipogenesis is higher in SC than in OM adipose tissue,Citation10-Citation12 although this is not unanimous.Citation13,Citation14
Excess visceral fat accumulation is a well-known predictor of obesity-related cardiometabolic alterations such as dyslipidemia and insulin resistance (reviewed in ref. Citation3). These conditions have increasingly been recognized to result from a default in the lipid storage capacity of adipose tissue.Citation15,Citation16 Consistent with this notion, Arner and collaborators showed that reduced generation of new adipocytes (low hyperplasia) was related to hypertrophy of mature adipocytes, a phenomenon that was also correlated with insulin values and insulin resistance.Citation17 Moreover, a study from Park et al. demonstrated that among a sample of Korean obese women, the ones characterized by the metabolic syndrome had a lower SC adipogenic capacity assessed by oil red O (ORO) staining compared with metabolically healthy women.Citation18
In a recent review on obesity and adipogenesis,Citation8 we showed that assessments of adipogenic capacity appeared to be reduced in obesity. However, we found that no study had ever examined how the ability of primary preadipocytes from various fat compartments to undergo in vitro differentiation relates to visceral obesity in the tissue donors. A sample of women for whom we obtained a precise quantification of SAT and VAT area through axial tomography and adipose tissue sampling on the day of surgery provided a unique experimental design to relate in vitro adipogenesis to cell size in the tissue, body fat distribution, and metabolic dysfunction. Our objective was to evaluate whether preadipocyte adipogenic rates assessed in vitro reflect the levels of visceral obesity and the presence of obesity-related cardiometabolic alterations. We tested the hypothesis that low preadipocyte adipogenic rates in the SC fat compartment are related to visceral obesity and concomitant metabolic alterations.
Results
Adipogenic rates of OM and SC preadipocytes are not correlated with overall adiposity indices in women covering a wide range of obesity values
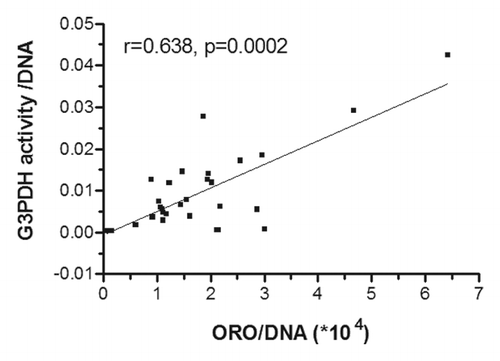
We obtained SC and OM adipose tissues from 35 women undergoing gynecological surgery for whom characteristics are described in . These women were covering a large spectrum of adiposity values and had a mean body mass index (BMI) of 26.2 kg/m2. After collagenase digestion, mature adipocyte diameters were measured and preadipocytes were cultivated to assess their ability to differentiate into lipid-storing cells. To do so, we cultivated cells isolated from each woman with adipogenic differentiation media and then quantified adipogenic rates by evaluating incorporation of ORO into lipid droplets and G3PDH activity after 21 d of culture. Rates were normalized on DNA content in each well (ng) for both measurements. As demonstrated in , ORO/DNA adipogenic rates correlated positively with G3PDH activity-measured adipogenic rates.
Table 1. Study sample characteristics and subgroup with paired OM and SC adipogenic rates
Figure 1. Correlation between adipogenic rates measured by G3PDH activity and oil red O (ORO) lipid staining. Primary cultures of preadipocytes isolated from SC adipose tissue were cultivated under adipogenic condition for 21 d. ORO quantification was performed for 35 samples and G3PDH activity for 29 samples. Pearson correlation coefficient is shown.
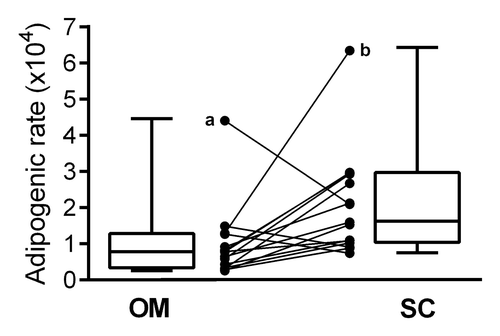
In vitro cultures of OM preadipocytes were less efficient than those of SC cells and we were able to measure less OM preadipocyte adipogenic rates (n = 15). Anthropometric and metabolic parameters for this subgroup are presented in . Statistical comparison revealed no difference compared with the remaining n = 20 patients, suggesting that it is representative of the whole cohort. When comparing these 15 paired OM and SC adipogenic rates, we found that OM preadipocytes had a significantly lower adipogenic capacity based on ORO/DNA ratio than their counterparts from SC tissue ().
Figure 2. ORO-assessed adipogenic rates of paired OM and SC preadipocytes from 15 women. Adipogenic rates were measured from OM and SC preadipocytes cultivated in adipogenic differentiation medium. Absorbance of ORO incorporation into lipid droplets was quantified and normalized for DNA content. Paired OM and SC values are represented with connected dots and box plots show the distribution of adipogenic rates for each depot. (a) Patient with the lowest visceral adipose tissue area; (b) patient among the most obese of the sample. Excluding values from patients a or b or a and b did not affect the depot difference. OM, omental; SC, subcutaneous; *Paired t test P < 0.05.
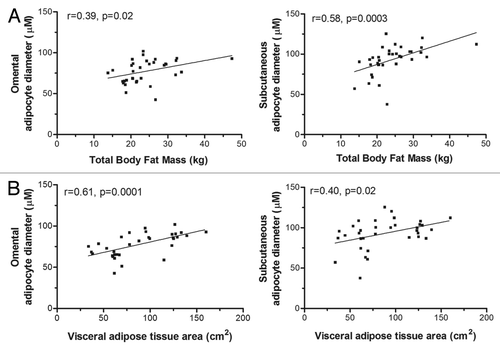
Although women covered a wide range of BMI values (from 20.3 to 41.1 kg/m2), overall adiposity indices (weight, BMI, total body fat mass) were not related to preadipocyte adipogenic rates in either fat compartment, despite the fact that OM and SC mature adipocyte sizes were positively correlated with total body fat mass and visceral adipose tissue area (). Regarding OM adipogenic rate, the sole statistically significant result revealed that women with high OM adipogenic rates had larger OM adipocytes (P = 0.02). These results show a correlation between OM and SC mature adipocyte hypertrophy with total body fat mass and visceral obesity whereas OM adipogenic capacity was only related to OM adipocyte size.
Figure 3. OM and SC mature cell sizes correlate with total body fat mass and visceral adipose tissue areas. (A) Correlations between total body fat mass and OM or SC adipocyte diameters. (B) Correlations between visceral adipose tissue area and OM or SC adipocyte diameters. Pearson correlation coefficients are shown.
ORO incorporation and G3PDH activity of SC preadipocytes vs. OM adipocyte size, visceral obesity, and plasma lipid concentrations
Women were separated into subgroups based on median value of SC ORO adipogenic rate for ANOVA analysis. Subgroups were composed of 17 women with low and 18 women with high SC adipogenic capacity. As presented in , women with low SC ORO adipogenic rates tended to have a higher visceral adipose tissue area (P = 0.09) and higher fasting glycemia (P = 0.10). Interestingly, they were characterized by higher OM mature adipocyte size (P = 0.008), which was not observed with SC adipocyte size (P = 0.77). Moreover, women with a low SC adipogenic rate presented higher plasma triglyceride (TG) concentrations and higher VLDL lipid content (P < 0.05 for both).
Table 2. Groups of women with low (n = 17) vs. high (n = 18) SC adipogenic rates according to median ORO/DNA
As shown in , we also separated women according to the median value of G3PDH activity adipogenic rates. Similar results to those with ORO adipogenic rates were obtained. Women with low G3PDH activity (n = 14) had larger OM adipocytes (P = 0.058) compared with women with high activity (n = 15). In addition, the subgroup with low adipogenic capacity had higher concentrations of TG (P = 0.06), VLDL-TG, VLDL-C/TG, LDL-TG, and Chol/HDL (P ≤ 0.05 for all). These results demonstrate that low SC preadipocyte adipogenic capacity, assessed with two different approaches, is related to visceral adipocyte hypertrophy and a dyslipidemic state in women covering a wide range of adiposity values.
Table 3. Groups of women with low (n = 14) vs. high (n = 15) SC adipogenic rates stratified according to median G3PDH activity
Low SC adipogenic rates are strongly associated with visceral obesity, omental adipocyte hypertrophy, and a dysmetabolic status independent of BMI
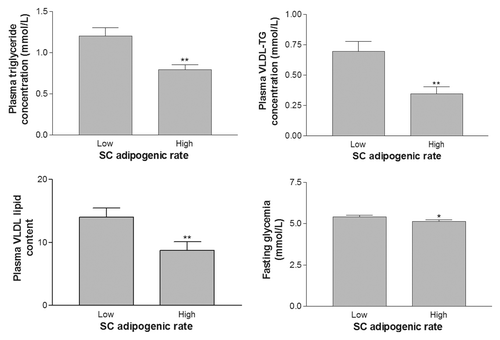
Women with either high or low ORO/DNA ratio were matched for BMI. ORO and G3PDH adipogenic rates were statistically different between these two groups, each composed of 13 women (P ≤ 0.05). As expected, matched women displayed similar body fat mass and BMI values (). However, women with a low SC adipogenic capacity were characterized by higher visceral adipose tissue area, but had similar SC adipose tissue area (). The same pattern was observed with mature adipocyte size, where adipocytes were larger in OM adipose tissue of women in the low adipogenic capacity group and no significant difference in SC mature cell size (). As shown on , plasma lipid concentrations, including TG, VLDL-TG, and VLDL lipid content, were higher in women presenting a low adipogenic capacity (P = 0.05, 0.001, and 0.007 respectively). Fasting glycemia was also higher in this group of women (P = 0.05).
Figure 4. Differences in adipose tissue area and mature cell size of subgroups of women with low vs. high subcutaneous (SC) preadipocyte adipogenic rates but matched for BMI. (A) Women with low vs. high SC adipogenic rates showed similar total body fat mass and BMI values (no statistical difference). (B) Women with low SC adipogenic rates had significantly higher visceral adipose tissue area (P < 0.01), but no difference in SC adipose tissue area. (C) Differences in fat cell size in matched patients with low vs. high SC preadipocyte adipogenic rates. Statistical difference was observed for OM mature adipocyte size only (P < 0.05).
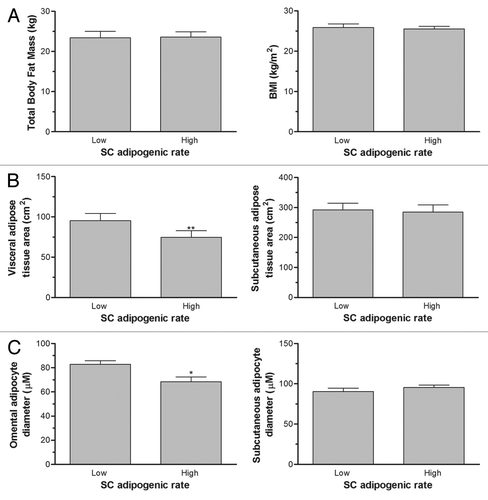
Figure 5. Differences in plasma lipid and glucose concentrations of subgroups of women with low vs. high subcutaneous (SC) preadipocyte adipogenic rates but matched for BMI. Women with low SC adipogenic capacities had significantly higher plasma TG and VLDL-TG concentrations. VLDL lipid content and plasma glucose concentration were also significantly higher in women with low SC adipogenesis (**P < 0.01, *P < 0.05).
Discussion
Our findings support the hypothesis that limited SC adipose tissue expandability, as assessed by in vitro preadipocyte adipogenic rates, is related to a clear phenotype of visceral obesity, OM adipocyte hypertrophy, and a dysmetabolic state. We are the first group reporting differences between patients with either low and high SC preadipocyte adipogenic rates and CT measurements of visceral adipose tissue area. The normalization of our data for the amount of biological material in the tissue culture plates (DNA content) adds to the validity of our findings. Moreover, we used two approaches, ORO staining and G3PDH activity which generated consistent results.
As mentioned earlier, comparisons of OM vs. SC preadipocytes to differentiate into lipid-storing cells were not unanimous. Our results support the notion that OM preadipocyte adipogenic rates are lower than in SC preadipocytes of the same patient. In addition, OM preadipocyte adipogenic rates were not consistently related to adiposity and cardiometabolic risk variables. The higher OM adipocyte size found in patients with low OM preadipocyte adipogenic rates suggests that adipose cell dynamics may be different in visceral adipose tissue than in the SC compartment. As demonstrated in , mature cell sizes from both compartments were correlated with total body fat mass and visceral obesity, suggesting that hypertrophy occurs in both depots with total and abdominal obesity. Our results indirectly suggest that hyperplasia may be a more determinant aspect of SC adipose expansion than in OM tissue. Yet, SC preadipocyte terminal differentiation capacity is related to OM adipocyte size. The relation we have shown between adipogenesis and OM cell size is concordant with results from Park and collaborators, who measured differentiation capacity of SC cells in obese Korean women.Citation18 They also reported a negative correlation between SC differentiation and OM adipocyte size among obese subjects.Citation18
Permana and collaborators reported a decrease in adipogenic capacity with increases in fat mass percentage and also with waist circumference.Citation19 Two other groups published that lower differentiation capacity of SC cells was associated with higher BMI.Citation20,Citation21 We did not find a significant correlation between preadipocyte adipogenic rates and overall obesity level, which was far from statistically significance when performing power analyses. However, our results clearly show an inverse relation between SC preadipocyte adipogenic rates and visceral obesity with precise CT measured-visceral adipose tissue areas. Our data extend previous studies suggesting that SC preadipocyte differentiation rate is negatively related to waist circumference,Citation18,Citation19 which has been already suggested as a good indicator of visceral adipose tissue accumulation.Citation22
We also demonstrate that independent of BMI, low preadipocyte adipogenic rates are related to markers of metabolic dysfunction such as elevated plasma concentrations of fasting glucose, TG, and VLDL-C. Interestingly, VLDL lipid content was significantly higher among women with low vs. high SC preadipocyte adipogenic rates, indicating that the effect relates to lipid content instead of VLDL particle number. Park and collaborators observed that women with the metabolic syndrome had lower SC adipogenesis.Citation18 In our sample, subjects were relatively healthy, as the majority of women presented less than 3 features of the metabolic syndrome. In a similar manner, our sample did not include type 2 diabetic subjects, possibly explaining the lack of association between adipogenic rates and fasting insulinemia or HOMA index. Yet, even in patients with a relatively healthy metabolic profile, we found higher fasting glucose concentrations in women with low SC preadipocyte adipogenic rates. This is in agreement with other studies showing an impact of adipogenic capacity on insulin sensitivity.Citation17,Citation18,Citation23
In conclusion, our findings provide strong support to the notion that limited expandability of SC adipose tissue possibly resulting from weak preadipocyte adipogenesis may lead to lipid overflow toward visceral compartments, visceral fat cell hypertrophy, and concomitant metabolic alterations.
Methods
Subjects
Women (age 35.2 to 58.0 y and BMI 20.3 to 41.1 kg/m2) undergoing elective gynecological surgery were recruited at the Laval University Medical Center and provided written informed consent before the beginning of the study. This study was approved by the Research Ethics Committee of our institution. Patients were scheduled for total (n = 33) or subtotal (n = 2) abdominal hysterectomies, sometimes accompanied by salpingo-oophorectomy of one (n = 1) or two (n = 11) ovaries. Reasons for surgery included one or more of the following: pelvic adhesions (n = 2), asymptomatic cholelithiasis (n = 1), mucinous cystadenoma (n = 1), incapacitating dysmenorrhea (n = 4), abdominal or pelvic pain (n = 5), ovarian cyst (n = 3), uterine leiomyoma (n = 6), right adnexal mass (n = 1), dysfunctional uterine bleeding (n = 17), uterine fibroids (n = 9), uterine myoma (n = 9), endometriosis (n = 4), uterine myomatosis (n = 1), adhesions syndrome (n = 1), and human papillomavirus (n = 1). Criteria of exclusion included weight gain or loss in the past year, Cushing syndrome, cancers, documented cardiovascular diseases, type 1 or 2 diabetes, and hyperthyroidism.
Body fatness and fat distribution measurements
Before surgery, patients underwent a dual-energy X-ray absorptiometry exam (Hologic QDR-4500A densitometer with whole-body fan beam software v8.26a:3-Hologic) to assess body composition. Subjects also underwent a CT exam (GE Light Speed1.1 CT scanner, General Electric Medical Systems) to assess abdominal SC and visceral adipose tissue cross-sectional area measurements at the L4L5 vertebrae level.Citation24
Plasma lipid/lipoprotein and glucose measurements
From fasting blood samples collected on the morning of surgery, we measured cholesterol and triglyceride levels, in plasma and in lipoprotein fractions using an Olympus AU400 apparatus (Beckman Coulter). Glucose was measured with the automated Modular P800 system (Roche Diagnostics). VLDL particles were isolated by ultracentrifugation.
Adipose tissue sampling, adipocyte isolation, and cell size measurement
SC adipose tissues were sampled at the site of incision (lower abdomen) and visceral (omental [OM]) adipose tissues were collected at the distal portion of the greater omentum. Samples were immediately brought to the laboratory for preadipocyte and adipocyte isolation as described previously.Citation25 The stromal–vascular fractions containing preadipocytes were obtained as previously described,Citation10 with exception of the erythrocyte lysis step. Isolated mature adipocytes were spread on a slide and pictures were taken using a phase contrast microscope. Two hundred fifty cell diameters per depot were calculated using Scion Image software (Scion Corporation).
Preadipocyte differentiation and ORO measurement
Cells were seeded with DMEM-F12 in 96-well plates and cultivated to confluence, and consequently growth arrest.Citation26 Adipogenesis was then induced using DM-2 media for SC preadipocytes and OM-DM media for visceral preadipocytes (ZenBio). After 7 d, medium was changed to adipocyte maintenance medium (ZenBio) for an additional 14 d. Lipid accumulation was quantified by ORO staining as previously described.Citation10 DNA content was measured by UV spectrophotometer. We computed the ORO absorbance-to-DNA ratio and used this variable as a measure of preadipocyte adipogenic rate.
G3PDH activity measurements
Glycerol-3-phosphate dehydrogenase activity was measured as described previouslyCitation27 with some modifications. Differentiated preadipocytes in 96-wells were washed with PBS and homogenized (100 μL/well; 20 mM Tris pH 7.3, 1 mM EDTA, 1 mM β-mercaptoethanol). G3PDH activity was assessed in the following buffer (90 μL/well; 100 mM triethanolamine pH 7.7, 2.5 mM EDTA, 0.1 mM β-mercaptoethanol, 353 μM NADH) with the addition of 10 µL of 8 mM dihydroxyacetone phosphate. A Spectramax340pc (Molecular Devices) was used to measure optical density at 340 nm during 2 min at 37 °C. A standard curve was generated to calculate G3PDH activity in mU of purified enzyme. DNA content per well was quantified with a NanoVue spectrophotometer (GE Healthcare Life Sciences) and used to normalize G3PDH activity.
Statistical analyses
Pearson correlation coefficients were computed with normally-distributed variables. Non-normal variables according to a Shapiro–Wilk test P value lower than 0.05 were log10-transformed or Box Cox-transformed. The variables that were transformed prior to t test analysis included weight, BMI, adipose tissue areas, TG concentration, fasting glycemia, VLDL lipid content, and SC adipogenic rate. Three different stratifications were performed according to median values of ORO/DNA, G3PDH activity/DNA and ORO/DNA matched for BMI. Separated subgroups were compared with Student t test or paired t test for matched women. For Student t tests, the Welch analysis of variance was used when variances were unequal according to the Levene test (P < 0.05).
| Abbreviations: | ||
| BMI | = | body mass index |
| DGAT | = | diacylglycerol acyltransferase |
| G3PDH | = | glyceraldehyde 3-phosphate dehydrogenase |
| HDL | = | high density lipoprotein |
| LDL | = | low density lipoprotein |
| OM | = | omental |
| ORO | = | oil red O |
| SAT | = | subcutaneous adipose tissue |
| SC | = | subcutaneous |
| TG | = | triglyceride |
| VAT | = | visceral adipose tissue |
| VLDL | = | very low density lipoprotein |
Disclosure of Potential Conflicts of Interest
No potential conflicts of interest were disclosed.
Acknowledgments
We acknowledge the contribution of the gynecologists, nurses, and radiology technicians of Laval University Medical Research Center and the collaboration of study participants. This study was supported by grant MOP-64182 (A.T.) from the Canadian Institutes of Health Research.
References
- Lee MJ, Wu Y, Fried SK. Adipose tissue heterogeneity: implication of depot differences in adipose tissue for obesity complications. Mol Aspects Med 2013; 34:1 - 11; http://dx.doi.org/10.1016/j.mam.2012.10.001; PMID: 23068073
- Drolet R, Richard C, Sniderman AD, Mailloux J, Fortier M, Huot C, Rhéaume C, Tchernof A. Hypertrophy and hyperplasia of abdominal adipose tissues in women. Int J Obes (Lond) 2008; 32:283 - 91; http://dx.doi.org/10.1038/sj.ijo.0803708; PMID: 17726433
- Tchernof A, Després JP. Pathophysiology of human visceral obesity: an update. Physiol Rev 2013; 93:359 - 404; http://dx.doi.org/10.1152/physrev.00033.2011; PMID: 23303913
- Bélanger C, Hould FS, Lebel S, Biron S, Brochu G, Tchernof A. Omental and subcutaneous adipose tissue steroid levels in obese men. Steroids 2006; 71:674 - 82; http://dx.doi.org/10.1016/j.steroids.2006.04.008; PMID: 16762384
- Michaud A, Boulet MM, Veilleux A, Noel S, Paris G, Tchernof A. Abdominal subcutaneous and omental adipocyte morphology and its relation to gene expression, lipolysis and adipocytokine levels in women. Metabolism 2014; 63:372 - 81; PMID: 24369916
- Côté JA, Nadeau M, Leboeuf M, Blackburn L, Tchernof A. Adipose tissue diacylglycerol acyltransferase activity and blood lipoprotein triglyceride enrichment in women with abdominal obesity. Atherosclerosis 2014; 233:172 - 7; http://dx.doi.org/10.1016/j.atherosclerosis.2013.12.041; PMID: 24529140
- Michaud A, Pelletier M, Noël S, Bouchard C, Tchernof A. Markers of macrophage infiltration and measures of lipolysis in human abdominal adipose tissues. Obesity (Silver Spring) 2013; 21:2342 - 9; http://dx.doi.org/10.1002/oby.20341; PMID: 23408706
- Lessard J, Tchernof A. Depot- and obesity-related differences in adipogenesis. Clin Lipidol 2012; 7:587 - 96; http://dx.doi.org/10.2217/clp.12.49
- Hauner H, Wabitsch M, Pfeiffer EF. Differentiation of adipocyte precursor cells from obese and nonobese adult women and from different adipose tissue sites. Horm Metab Res Suppl 1988; 19:35 - 9; PMID: 3235057
- Blouin K, Nadeau M, Mailloux J, Daris M, Lebel S, Luu-The V, Tchernof A. Pathways of adipose tissue androgen metabolism in women: depot differences and modulation by adipogenesis. Am J Physiol Endocrinol Metab 2009; 296:E244 - 55; http://dx.doi.org/10.1152/ajpendo.00039.2008; PMID: 18984855
- Tchkonia T, Giorgadze N, Pirtskhalava T, Tchoukalova Y, Karagiannides I, Forse RA, DePonte M, Stevenson M, Guo W, Han J, et al. Fat depot origin affects adipogenesis in primary cultured and cloned human preadipocytes. Am J Physiol Regul Integr Comp Physiol 2002; 282:R1286 - 96; PMID: 11959668
- Sewter CP, Blows F, Vidal-Puig A, O’Rahilly S. Regional differences in the response of human pre-adipocytes to PPARgamma and RXRalpha agonists. Diabetes 2002; 51:718 - 23; http://dx.doi.org/10.2337/diabetes.51.3.718; PMID: 11872672
- Shahparaki A, Grunder L, Sorisky A. Comparison of human abdominal subcutaneous versus omental preadipocyte differentiation in primary culture. Metabolism 2002; 51:1211 - 5; http://dx.doi.org/10.1053/meta.2002.34037; PMID: 12200769
- Van Harmelen V, Röhrig K, Hauner H. Comparison of proliferation and differentiation capacity of human adipocyte precursor cells from the omental and subcutaneous adipose tissue depot of obese subjects. Metabolism 2004; 53:632 - 7; http://dx.doi.org/10.1016/j.metabol.2003.11.012; PMID: 15131769
- Karpe F, Dickmann JR, Frayn KN. Fatty acids, obesity, and insulin resistance: time for a reevaluation. Diabetes 2011; 60:2441 - 9; http://dx.doi.org/10.2337/db11-0425; PMID: 21948998
- Virtue S, Vidal-Puig A. Adipose tissue expandability, lipotoxicity and the Metabolic Syndrome--an allostatic perspective. Biochim Biophys Acta 2010; 1801:338 - 49; http://dx.doi.org/10.1016/j.bbalip.2009.12.006; PMID: 20056169
- Arner E, Westermark PO, Spalding KL, Britton T, Rydén M, Frisén J, Bernard S, Arner P. Adipocyte turnover: relevance to human adipose tissue morphology. Diabetes 2010; 59:105 - 9; http://dx.doi.org/10.2337/db09-0942; PMID: 19846802
- Park HT, Lee ES, Cheon YP, Lee DR, Yang KS, Kim YT, Hur JY, Kim SH, Lee KW, Kim T. The relationship between fat depot-specific preadipocyte differentiation and metabolic syndrome in obese women. Clin Endocrinol (Oxf) 2012; 76:59 - 66; http://dx.doi.org/10.1111/j.1365-2265.2011.04141.x; PMID: 21711372
- Permana PA, Nair S, Lee YH, Luczy-Bachman G, Vozarova De Courten B, Tataranni PA. Subcutaneous abdominal preadipocyte differentiation in vitro inversely correlates with central obesity. Am J Physiol Endocrinol Metab 2004; 286:E958 - 62; http://dx.doi.org/10.1152/ajpendo.00544.2003; PMID: 14970008
- Isakson P, Hammarstedt A, Gustafson B, Smith U. Impaired preadipocyte differentiation in human abdominal obesity: role of Wnt, tumor necrosis factor-alpha, and inflammation. Diabetes 2009; 58:1550 - 7; http://dx.doi.org/10.2337/db08-1770; PMID: 19351711
- van Harmelen V, Skurk T, Röhrig K, Lee YM, Halbleib M, Aprath-Husmann I, Hauner H. Effect of BMI and age on adipose tissue cellularity and differentiation capacity in women. Int J Obes Relat Metab Disord 2003; 27:889 - 95; http://dx.doi.org/10.1038/sj.ijo.0802314; PMID: 12861228
- Pouliot MC, Després JP, Lemieux S, Moorjani S, Bouchard C, Tremblay A, Nadeau A, Lupien PJ. Waist circumference and abdominal sagittal diameter: best simple anthropometric indexes of abdominal visceral adipose tissue accumulation and related cardiovascular risk in men and women. Am J Cardiol 1994; 73:460 - 8; http://dx.doi.org/10.1016/0002-9149(94)90676-9; PMID: 8141087
- van Tienen FH, van der Kallen CJ, Lindsey PJ, Wanders RJ, van Greevenbroek MM, Smeets HJ. Preadipocytes of type 2 diabetes subjects display an intrinsic gene expression profile of decreased differentiation capacity. Int J Obes (Lond) 2011; 35:1154 - 64; http://dx.doi.org/10.1038/ijo.2010.275; PMID: 21326205
- Deschênes D, Couture P, Dupont P, Tchernof A. Subdivision of the subcutaneous adipose tissue compartment and lipid-lipoprotein levels in women. Obes Res 2003; 11:469 - 76; http://dx.doi.org/10.1038/oby.2003.64; PMID: 12634447
- Blouin K, Richard C, Bélanger C, Dupont P, Daris M, Laberge P, Luu-The V, Tchernof A. Local androgen inactivation in abdominal visceral adipose tissue. J Clin Endocrinol Metab 2003; 88:5944 - 50; http://dx.doi.org/10.1210/jc.2003-030535; PMID: 14671194
- Holley RW, Kiernan JA. “Contact inhibition” of cell division in 3T3 cells. Proc Natl Acad Sci U S A 1968; 60:300 - 4; http://dx.doi.org/10.1073/pnas.60.1.300; PMID: 5241531
- Blouin K, Nadeau M, Perreault M, Veilleux A, Drolet R, Marceau P, Mailloux J, Luu-The V, Tchernof A. Effects of androgens on adipocyte differentiation and adipose tissue explant metabolism in men and women. Clin Endocrinol (Oxf) 2010; 72:176 - 88; http://dx.doi.org/10.1111/j.1365-2265.2009.03645.x; PMID: 19500113
