
Abstract
The objective was to determine the effect of nutritional milieu of isolated stromal vascular (SV) cells on proliferative capacity of preadipocytes, and adipogenic and lipogenic capacity in adipocytes in vitro. Proliferation of the preadipocytes increased over time with 48 and 72 h being greater than 24 h; however, preadipocytes from steers supplemented with corn (LC) had lower proliferation rates compared with those without corn grain supplementation (L) at 72 h. Adipocyte cultures isolated from LC group had higher mean diameter on d 4 and 6, and higher mean volume on d 0, 4, 6, and 12 of culture. Adipocytes from steers supplemented with corn grain (LC) had lower expression of key adipogenic genes during extended days in culture. The results show that prior nutritional treatment of the donor animal used to isolate SV cultures alters their proliferative, adipogenic, and lipogenic capacity in culture. These differences may be related to lower induction/expression of AP2 gene in the adipose cultures from corn supplemented group. Corn grain supplementation to steers grazing legumes could have stimulated more active adipogenic progenitor cells to differentiate, which would leave fewer behind in the SV pool for subsequent isolation.
Introduction
The use of primary adipocyte cultures for examination of nutritional treatments in vitro is common today. Adipocytes used for these experiments come from stromal vascular cells isolated from adipose tissues of animals typically obtained at slaughter. Research shows that specific differentiation cocktailsCitation1,2 facilitate the differentiation of these SV cells into adipocytes that are able to incorporate exogenous fatty acids and/or synthesize long-chain fatty acids in vitro.Citation3,4 Numerous research articles are available to address the function of these adipocytes in culture and how exogenous compounds alter lipogenesis (for a review see ref. 5). However, little attention has been paid to the nutritional background that the donor animal received prior to the isolation of the SV cell population.
Nutritional content of the animal's diet prior to slaughter alters fat deposition rates and fatty acid composition of adipose tissues. Comparisons of grain- vs. grass-finishing systems show that adipose tissue deposition is greater and polyunsaturated fatty acid contents are lower for grain-finished steers.Citation6-9 The longer time period that cattle are fed high-concentrate diets results in linear increases in subcutaneous fat deposition, intramuscular total lipid content, and monounsaturated fatty acid concentrations due to increased triacylglyceride storage in the adipocyte.Citation10 Corn grain supplementation to grazing steers can also alter fat deposition, fatty acid composition and lipogenic gene expression of adipose tissue depots.Citation11,12 Fat deposition in finishing animals is the result of both hyperplasia and hypertrophy.Citation13-15 We hypothesized that the nutritional milieu of the donor animals from which SV cells were isolated from would alter proliferative, adipogenic, and lipogenic capacity of preadipocytes/adipocytes. The specific objective of the experiment was to determine the effect of nutritional milieu of isolated SV cells on proliferative capacity of preadipocytes, and adipogenic and lipogenic capacity in adipocytes in vitro.
Results
The fatty acid composition of the subcutaneous adipose tissues of the donor animals is presented in . Previous research in our laboratory has shown that the fatty acid composition of subcutaneous and intermuscular adipose tissues is very similar in composition (Duckett, unpublished data). Eguinoa et al.Citation16 compared lipogenic enzyme rates of various fat depots (omental, perirenal, subcutaneous, and intermuscular) to find that lipogenic enzyme activities were similar in subcutaneous and intermuscular adipose depots in cattle and that these depots had lower activities than omental and perirenal adipose depots. In a proteomics approach, Gondret et al.Citation17 evaluated intramuscular, subcutaneous, intermuscular, and perirenal adipose depots in pigs and found that depots from intermuscular, subcutaneous, and perirenal regions were similar in protein expression. The total lipid content of subcutaneous adipose tissue was higher (P < 0.05) in steers supplemented with corn (LC) compared with those without corn grain supplementation (L). These results show that corn grain supplementation stimulated lipid filling of the adipocytes. Corn grain supplementation increased the amount of myristic (C14:0), myristoleic (C14:1), palmitic (C16:0), palmitoleic (C16:1), oleic (C18:1 cis-9), and cis-11 vaccenic (C18:1 cis-11) acid compared with no supplementation (L). Corn grain supplementation decreased (P < 0.05) the concentration trans-11 vaccenic (C18:1 trans-11) acid. Total saturated and monounsaturated fatty acid contents were increased (P < 0.05) in the corn supplemented group (LC) compared with pasture only (L). The increases in palmitic acid would indicate greater de novo lipogenesis in the adipose tissues of LC compared with L. Increases in myristoleic, palmitoleic and oleic acids would indicate greater desaturase activity in the adipose tissue of LC compared with L as well. Therefore, corn grain supplementation to grazing steers stimulates lipid filling apparently due to greater de novo lipogenesis and desaturase activity.
Table 1. Fatty acid profile (g/100 g adipose tissue) of subcutaneous adipose tissue for donor steers that grazed legume pastures with (LC) or without (L) corn grain supplementation (0.75% of body weight/d)
The total fatty acid content of differentiated adipocyte cultures is shown in . Interactions between nutritional treatments (L and LC) and linoleic acid addition were non-significant except for C18:2. Adipocytes from L group had increased (P < 0.01) total fatty acid content after 6 d in culture compared with LC. The L adipocytes had higher (P < 0.05) concentrations of palmitic, palmitoleic, stearic, oleic, arachidonic, docosapentaenoic (DPA), and docosahexaenoic (DHA) acids than LC adipocytes. Addition of linoleic acid to the cultures decreased (P < 0.05) stearic, oleic, arachidonic, DPA, and DHA acid amounts in both L and LC adipocytes. Linoleic acid was increased (P < 0.05) with C18:2 supplementation; however the magnitude of the increase was greater (P < 0.05) for L than LC.
Table 2. Fatty acid profile (μg/well) of intermuscular adipocyte cultures at 6 d from steers that grazed legume pastures with (LC) or without (L) corn gain supplementation (0.75% of body weight/d). Cultures from each treatment group (L or LC) received 0 or 100 μM addition of linoleic (C18:2)
Proliferation of the preadipocytes increased (P < 0.05) over time with 48 and 72 h being greater (P < 0.05) than 24 h (). Preadipocytes from LC had lower (P < 0.05) proliferation rates than L preadipocytes at 72 h. These results indicate the preadipocytes from L treatment were able to proliferate longer in culture than those from LC.
Figure 1. Cell proliferation of intermuscular preadipocytes at 24, 48, and 74 h in culture from steers that grazed legume pastures with (LC) or without (L) corn grain supplementation (0.75% of body weight/d). *Within a time point, LC group differs from L group (P < 0.05). **Time means differ from 24 h (P < 0.05).
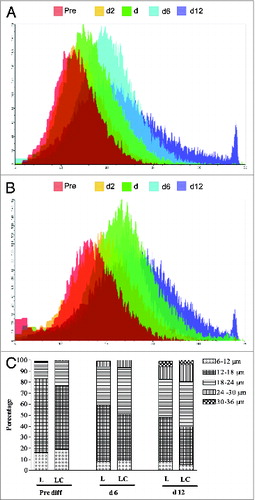
The adipocyte mean diameter and volume at different days of culture are presented in respectively. Adipocyte diameter (μM) and volume (pL) increased (P < 0.05) over time with the maximum average sizes observed at d 12. The adipocyte cultures isolated from LC group had higher (P < 0.05) mean diameter on d 4 and 6, and higher (P < 0.05) mean volume on d 0, 4, 6, and 12 of culture. The cell size distribution of adipocyte cultures are presented in . Adipocytes grew larger (P < 0.05) with increasing days in culture. Approximately 78–82% of the adipocytes were <18 μM in size at d −2. By d 12 of culture, the percentage of small (<18 μM) adipocytes was reduced to 40–50% of the total cellular population. Adipocyte populations with larger sizes (>24 μM) were seen in d 6 and 12 of culture. The cellular size distribution during culture differed (P < 0.05) between nutritional treatments, L and LC. Adipocytes from LC had greater percentages (P < 0.05) of larger adipocytes than L adipocytes.
Figure 2. Cell sizing [(A) diameter, μM; (B) volume, pL] of intermuscular adipocyte cultures from steers that grazed legume pastures with (LC) or without (L) corn grain supplementation (0.75% of body weight/d) at various days in culture. *Within a time point, LC group differs from L group (P < 0.05). Each time point with a different alphabet differs significantly (P < 0.05).
![Figure 2. Cell sizing [(A) diameter, μM; (B) volume, pL] of intermuscular adipocyte cultures from steers that grazed legume pastures with (LC) or without (L) corn grain supplementation (0.75% of body weight/d) at various days in culture. *Within a time point, LC group differs from L group (P < 0.05). Each time point with a different alphabet differs significantly (P < 0.05).](/cms/asset/bd939608-4e8e-4962-ac40-9ff6cb174c7c/kadi_a_964532_f0002_b.gif)
Figure 3. Cell size distribution of intermuscular adipocyte cultures at different days in culture from steers that grazed legumes with (LC) or without (L) corn grain supplementation (0.75% of body weight/d). Differentiation cocktail was added on d0. (A) L group, (B) LC group, and (C) Distribution.
Relative gene expression of key adipogenic genes in L and LC adipocytes at various days in culture is shown in . The expression of AP2 was downregulated (P < 0.05) in LC adipocytes at 2, 4, 6, and 12 d in culture compared with L. Expression of C/EBPα was downregulated in LC compared with L adipocytes at d 2 and 6 of culture. PPAR-γ mRNA expression was upregulated in LC at d −2 of culture but downregulated in d 2 and 4 compared with L. SCD-1 mRNA expression was downregulated (P < 0.05) in LC vs. L adipocytes at d 4 and 6 in culture. The expression of GPDH mRNA was downregulated in LC adipocytes at d 4, 6, and 12 of culture compared with L. Overall, adipocytes from steers supplemented with corn grain (LC) had lower expression of key adipogenic genes during extended days in culture.
Figure 4. Relative mRNA expression of bovine intermuscular adipocytes at various days (d −2, 2, 4, 6, and 12) in culture. Bovine preadipocytes were isolated from steers that grazed legume pastures with (LC) or without (L) corn grain supplementation (0.75% of body weight/d) and differentiation cocktail added on d0 to stimulate differentiation. *Within a time point, LC group differs from L group (P < 0.05).
The enrichment of precursor 1,2-13C2 estimated by MIDA did not change within the time points suggesting isotopic steady-state in the adipocyte cultures (). However, the enrichment of the precursor was lower (P < 0.05) in LC adipocyte cultures than L. The enrichment of C16:0 (M+2), expressed as TTR of C16:0, increased with time from 6 to 48 h, with no difference due to nutritional treatment (). The TTR16:0 of M+4 did not differ between the treatments at 6, 12, and 24 h; however at 48 h, M+4 was lower (P < 0.05) in LC adipocytes (). The TTR of C18:0 (M+2) increased from 6 to 48 h but TTR was lower (P < 0.05) for LC at 12, 24, and 48 h (). C18:0 (M+4) increased from 24 to 48 h in both the adipocyte cultures but TTR was lower (P < 0.05) for LC than L adipocytes (). Lipogenesis, as indicated by FSR16:0, increased from 12 to 48 h; however, LC adipocytes had lower (P < 0.05) lipogenic rates than L adipocytes (). Stearic acid is formed in culture via elongation of palmitic acid and therefore is also part of the lipogenesis rate. The FSR18:0 was greater (P < 0.05) in the LC adipocyte cultures than L from 24 to 48h (). GPDH activity (nmol/mg protein/ min), another index of lipogenesis, was reduced (P < 0.05) in LC compared with L on both d 6 and 12 of culture (). Activity of GPDH was higher (P < 0.05) in L cells at d 12 compared with d 6.
Figure 5. Lipogenesis in bovine intermuscular adipocyte cultures from steers that grazed legume pastures with (LC) or without (L) corn grain supplementation (0.75% of body weight/d). (A) Estimation of molar percent excess (MPE) of acetate after [1-13C]2 addition to the media. (B) Tracer-to-tracee (TTR) ratio of C16:0. (C) Tracer-to-tracee (TTR) ratio of C16:0. (D) Tracer-to-tracee (TTR) ratio of C18:0. (E) Tracer-to-tracee (TTR) ratio of C18:0. (F) Fractional synthetic rate of 13C-16:0 synthesized from 1,2-13C-acetate over a period of 48 h. (G) Fractional synthetic rate of 13C-18:0 synthesized from 1,2-13C-acetate over a period of 48 h.
![Figure 5. Lipogenesis in bovine intermuscular adipocyte cultures from steers that grazed legume pastures with (LC) or without (L) corn grain supplementation (0.75% of body weight/d). (A) Estimation of molar percent excess (MPE) of acetate after [1-13C]2 addition to the media. (B) Tracer-to-tracee (TTR) ratio of C16:0. (C) Tracer-to-tracee (TTR) ratio of C16:0. (D) Tracer-to-tracee (TTR) ratio of C18:0. (E) Tracer-to-tracee (TTR) ratio of C18:0. (F) Fractional synthetic rate of 13C-16:0 synthesized from 1,2-13C-acetate over a period of 48 h. (G) Fractional synthetic rate of 13C-18:0 synthesized from 1,2-13C-acetate over a period of 48 h.](/cms/asset/9823c9fb-af32-4380-8648-cdc546093b50/kadi_a_964532_f0005_b.gif)
Figure 6. Glycerol 3-phosphate dehydrogenase activity of intermuscular adipocyte cultures at 6 and 12 d of culture from steers that grazed legume pastures with (LC) or without (L) corn grain supplementation (0.75% of body weight/d). *Within a time point, LC group differs from L group (P < 0.05). **Time means differ from 24 h (P < 0.05).
Discussion
Subcutaneous adipose tissue samples from the donor steers that were on two different nutritional treatments, grazing legume pastures with (LC) or without (L) corn grain supplement, differed in total fatty acid content and composition. The increase in total fatty acid content of the adipocytes would indicate the increased hypertrophy or filling with lipid occurred with the supplementation of corn grain. RobelinCitation15 reported that postnatal adipose tissue growth is a combination of both hyperplasia of preadipocytes and hypertrophy of adipocytes; however as animals reach mature size, hypertrophy or lipid filling of adipocytes predominates (70%). Cianzio et al.Citation14 also reported that hypertrophy of the adipose tissue is the major contributor of adipose tissue mass expansion of steers in the growing phase from 11 to 17 mo of age. Corn grain supplementation also increased the content of saturated (myristic and palmitic acids) and monounsaturated (myristoleic, palmitoleic, and oleic acids) fatty acids. Supplementation increased cis-11 vaccenic acid, which is an elongation production of palmitoleic acid.Citation4 The changes in these fatty acid composition of the subcutaneous adipose tissue suggest that de novo lipogenesis, desaturase, and elongase activities in the adipocytes were heightened with corn grain supplementation. Duckett et al.Citation11 reported 46-fold and 18-fold upregulation of SCD-1 mRNA expression in subcutaneous adipose tissue in steers finishing on high-concentrate diets (85% corn grain) or corn grain supplementation (0.5% of body weight/d), respectively, compared with steers finished on pasture only. Exposure to corn grain during the finishing phase of beef production increases adipocyte hypertrophy and lipogenic enzyme activities to alter fatty acid composition.
Adipose tissue consists of mature adipocytes and SV cells comprising of several cell types such as predifferentiated adipocytes, mesenchymal stem cells, nerve cells, macrophages, and capillary endothelial cells. It has been suggested that the mature adipocytes could originate from three different sources, the transdifferentiation of non-differentiated stem cells, preadipocytes and proliferation of mature adipocytes (for a review see ref. 5). Based on our results, we could speculate that there could be differences in the recruitment and proliferative nature of these precursor cells. Cells isolated from L steers were more proliferative for longer periods of time in culture. These results would indicate that exposure to corn supplementation may have resulted in increased hyperplasia and hypertrophy of SV cells in vivo that resulted in diminished ability of these SV cells to proliferate in culture.
Adipocyte cell size and distribution in culture also differed due to nutritional milieu of donor steers. Further, differences in the adipose cell size distributions at different time points showed that the two groups of adipocyte cultures differed in their hypertrophic abilities as well. Adipocytes isolated from steers supplemented with corn grain (LC) had a greater proportion of larger adipocyte sizes than L at all days in culture. This suggests that greater differentiation of LC preadipocytes in vivo may have altered the remaining SV pool. This raises the possibility that adipose tissue from non-supplemented steers could have had more number of SV cells compared with those from corn supplemented steers resulting in differences in the primary cultures. However, we plate the same number of SV cells in the initial step of establishing primary cultures and also at the beginning of each experiment so that the number of SV cells in the cell culture experiments should not have been a major factor in examination of these adipocytes in culture between the nutritional treatments.
The adipose differentiation program involves expression of several genes and transcriptional regulators in a sequential manner. In vitro, the supplementation of differentiating cocktail two days after cells reach confluence induces the expression of several proteins (transient expression of c-jun, c-fos, and c-myc) and transcriptional factors, CCAAT/enhancer binding proteins ([C/EBP] β and δ), which influence the appearance of PPARγ and C/EBPα (for a review see ref. 5). Thus, C/EBPα, PPARγ, SCD-1, and AP2 (FABP4) are considered markers of adipocyte differentiation. Pratt et al.Citation18 showed that AP2 is upregulated by 100-fold by d 2 after addition of primary differentiation cocktail. Similarly, AP2 gene expression was upregulated by over 100-fold in L cells in this study; however, LC cells only showed about 20-fold increase in AP2 expression. Expression of SCD-1 increases after differentiation of SV cells and precedes lipid filling in 3T3-L1Citation19 and bovine preadipocytes.Citation20 In this study, SCD-1 expression increased (P < 0.05) above d −2 and 2 levels at d 4 in L and d12 in LC. The SV cells from both nutritional treatments (L and LC) differentiated to mature adipocytes with our differentiating protocol as evidenced both by measuring the expression of key genes involved in adipogenesis, activity of GPDH, and incorporation of 13C2 intro long-chain fatty acids. In addition, further confirmation was also evaluated by histological examination of the cell culture to show change in cell shape and evidence of lipid droplets (data not shown). All these parameters unequivocally suggested that the SV cells in both the groups were differentiated to fully mature adipocytes. However, clear differences in the markers of adipose differentiation suggested that the source of SV cells could influence the differentiating capabilities of adipocytes. Adipocytes from steers supplemented with corn grain (LC) had lower relative expression of AP2, C/EBPα, PPARγ, SCD-1, and GPDH during extended days in culture. Thus, adipocytes isolated from steers supplemented with corn grain had lower expression of key adipogenic genes that likely influenced their capacity for de novo lipogenesis, desaturation, and elongation in culture. Indeed, adipocytes from steers supplemented with corn grain had lower total fatty acid content after 6 d in culture than L adipocytes. Fatty acid composition was also altered with lower amounts of saturated (palmitic and stearic acids), monounsaturated (palmitoleic and oleic acids), and polyunsaturated (arachidonic, DPA, DHA) fatty acids. Addition of linoleic acid to the cultures also altered uptake of C18:2 into the adipocytes dependent on nutritional milieu of donor cells. Adipocytes from L were able to incorporate more C18:2 into the cells then LC (40.5 vs. 19.5 μg/well). Therefore, the lower expression of key adipogenic genes in LC altered their capacity for de novo lipogenesis, desaturation, and uptake of long-chain fatty acids in culture.
Lipogenic rate as measured by 13C2 incorporation into fatty acids and GPDH activity at d 6 and 12 showed differences among SV cells dependent on nutritional milieu of donor samples. Activity of GPDH, another index of lipogenesis, was lower for LC than L adipocytes at d 6 and 12 of culture. Lipogenesis, as determined by FSR16:0 and FSR18:0, was lower in LC adipocytes than L. The lipogenic capacity of adipocytes isolated from steers supplemented with corn grain was reduced in culture.
Together these results show that prior nutritional treatment of the donor animal used to isolate SV cultures alters their proliferative, adipogenic and lipogenic capacity in culture. These differences may be related to lower induction/expression of AP2 gene in the adipose cultures from corn supplemented group. Corn grain supplementation to steers grazing legumes could have stimulated more active adipogenic progenitor cells to differentiate, which would leave fewer behind in the SV pool for subsequent isolation. Additional research in this area is needed to further determine how corn grain supplementation altered the SV pool isolated for primary adipocyte culture experiments. This study highlights the importance of knowing that details regarding the nutritional treatments of the donor animal and source of SV cells used in subsequent primary adipocyte culture experiments in order to attain appropriate in vitro results.
Materials and Methods
Cell isolation
Bovine primary stromal vascular (SV) cells were isolated from intermuscular adipose tissue immediately underneath the subcutaneous adipose tissue layer at the lateral edge of the longissimus muscle from the 10–12th rib of Angus × Hereford steers (n = 8; 21 mo of age; 503 ± 10 kg) that grazed legume pastures (alfalfa, Medicago sativa, Alfagraze 600R, Pennington Seed, and forage soybeans, Glycine max, Large Lad RR, Eagle Seed) with or without corn grain supplementation (0.75% of body weight). Subcutaneous adipose tissue samples from each steer were collected for subsequent long-chain fatty acid analyses by GLC. In our laboratories, we found that SV cells could be isolated from the intermuscular fat from the 12th rib area from adipose tissue immediately underneath the subcutaneous fat layer and adjacent to the lateral edge of the longissimus muscle. Isolating fat from this location provided us with a much cleaner sample and less contamination than removing the subcutaneous fat from the similar region because it was exposed to numerous contaminates during the slaughter process. It is important to note that these samples were from forage-finished beef, which have a lower amount of subcutaneous adipose tissue for sampling making more difficult to isolate subcutaneous adipose tissues that have not been exposed to contaminants during the slaughter process. Upon development of this method, we compared these SV cells from intermuscular adipose tissue to previous research with SV cells isolated from subcutaneous fat and found that they behaved similarly to subcutaneous SV cells in culture (i.e., characteristic increase in AP2 expression after differentiation, increase in lipid filling and specific fatty acid composition as demonstrated by GC analyses, uptake of supplemental fatty acids, lipogenic gene expression and miRNA expression, etc.Citation18). Therefore, we continued to use this procedure for isolation of SV cells from intermuscular adipose tissues in order to reduce contamination from the slaughter process and several publications existCitation3,4,21,22 from our laboratory using intermuscular adipocytes in culture. OthersCitation16,17 have shown that subcutaneous and intermuscular adipocytes are similar in lipogenic enzyme activities and protein expression. The SV cells were isolated according to Hirai et al.Citation23 by digesting with Type I collagenase for 1 h at 37°C with shaking. Cells were plated at 1 × 10⁴ cells/cm2 and passaged every 2 to 4 d when 60% confluent. Cells were incubated at 37°C under 5% CO2 humidified atmosphere with media (Dulbecco's modified eagles medium [DMEM] containing 10% fetal calf serum [FCS], and 2× antibiotic/antimycotic [AB/AM; containing 10 000 U/mL penicillin G, 10 000 g/mL streptomycin, and 25 g/mL amphotericin B]) replacement every 2 d. After 4 passages, cell lines were stored in liquid nitrogen at 1 × 10⁶ cells/mL in freezing media (DMEM, 20% FCS, and 10% dimethyl sulfoxide) for later use. Cell culture hormones and DMEM were purchased from Sigma-Aldrich, and AB/AM and Hyclone fetal calf serum were purchased from Thermo Scientific. All adipose tissues samples were harvested and SV cells isolated on the same day and time.
Cell experiments
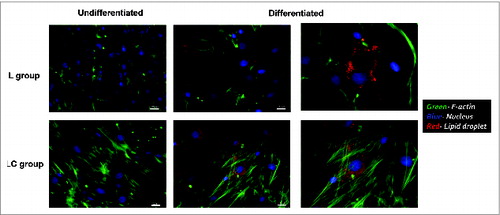
Individual cultures from 3 steers per nutritional treatment (L and LC) were used in duplicate for this study. Cells were thawed, cultured in growth media for 3 passages, and seeded in 6-well plates (1.6 cm2/well) at 1 × 10⁵ cells/cm2. Three experiments were conducted to assess proliferation capacity of preadipocytes (Expt. 1), fatty acid composition and uptake of linoleic acid in differentiated adipocytes (Expt. 2), and cell size/volume, relative expression of key adipogenic genes and lipogenesis in differentiated adipocytes (Expt. 3). In experiment 1, preadipocytes were seeded in 6-well plates as described above and then proliferation capacity assessed using Cell Counting Kit-8 (CCK-8; Dojindo Molecular Technologies, Inc.). In experiment 2 and 3, cells were seeded in 6-well plates as described above and then allowed to reach confluence. Cells were held for an additional 2 d and then differentiated on d 0 with primary differentiation media (DMEM containing 5% FCS, 2× AB/AM, 2.5 μg/mL insulin, 0.25 μM dexamethasone [DEX], 1 μM rosiglitazone [ROSI], 0.5 mM 2-isobutyl-l-methylxanthine [IBMX], and 10 mM acetate). Secondary differentiation media (DMEM containing 5% FCS, 2× AB/AM, 2.5 μg/mL insulin, 1 μM ROSI, and 10 mM acetate) was applied for 10 d from d 2 to 12. The differentiation hormones and media used in our experiment have been tested for their efficacy in inducing differentiation in bovine SV cultures (see refs. 1–2, and 24). In our laboratory, our SV cultures show the characteristic changes from fibroblastic to round following differentiation and become lipid-filled (see refs. 3 and 18). Cells were washed 3 times with PBS and released from the cultureware with trypsin to harvest the cells. In experiment 2, L and LC cells were plated in quadruplicate. Bovine serum albumin bound linoleic acid (C18:2 n-6; 0 or 100 μM; Sigma-Aldrich Corp) was added to the culture media of two replicates from d 2 to 6 of differentiation to assess the fatty acid composition and linoleic acid uptake in adipocytes. Cell cultures without FA supplementation received equal amounts of fatty acid free-bovine serum albumin as their counterparts. In experiment 3, cell lines (n = 3 per treatment) from both treatments (L and LC) were plated in duplicate and then examined for cell size distribution, adipogenic gene expression, and lipogenic rate in culture. Pictures of the preadipocytes before differentiation and adipocytes after differentiation are shown in . Three fluorophores were used to identify cell nucleus (POPO™-1 iodide, Life Technologies; blue color), F-actin cytoskeleton (Alexa Fluor 488® phalloidin, Life Technologies; green color), and neutral lipids (HCS LipidTOX™ red neutral lipid stain, Life Technologies; red color). As would be expected, no lipid staining occurred in the preadipocyte cultures; however after differentiation, lipid staining is evident in both nutritional treatment groups.
Figure 7. Photomicrographs of the intermuscular preadipocytes and adipocytes after differentiation from steers that grazed legume pasture with (LC) or without (L) corn grain supplementation (0.75% of body weight/d).
Cell proliferation
Cell proliferation in preadipocytes was assayed using Cell Counting Kit-8 according to manufacturer's instructions. Cells were plated at density of 5 × 10⁴ cells/well in a 24-well plate (200 mm2/well). The cell proliferation was measured at 24, 48, and 72 h. Cell Counting Kit-8 contains a water-soluble tetrazolium salt, WST-8 [2-(2-methoxy-4-nitrophenyl)-3–4-nitrophenyl)-5-(2,4-disulfophenyl)-2H-tetrazolium, monosodium salt], which upon reduction by dehydrogenases in cells produces a water soluble formazan dye that is yellow in color. The intensity of the color measured using a plate reader (Bio-Tek Snergy HT, Bio-Tek, Winooski, VT) and is proportional to the number of living cells. Values were also measured at 0 h normalize for the initial number of cells.
Cell size and distribution
The cell size distribution of preadipocytes (−2 d) and adipocytes (0, 2, 4, 6, and 12 d of culture) was measured with ScepterTM handheld automated cell counter (EMD Millipore). The cell counter detects the cells using coulter principle, coulter impedance-based particle detection. A 60 μM sensor, which measures cell sizes from 6 to 36 μM, was used to measure the cells released from the plates with trypsin.
Fatty acid analysis
Fatty acid composition of the intermuscular adipose tissue from the donor animals as well as cultured adipocytes was determined. Cellular FA were extracted according to Folch et al.Citation25 and transmethylated to fatty acid methyl esters (FAME) using sodium methoxide followed by boron trifluoride.Citation26 The FAME were analyzed using an Agilent 6850 GLC equipped with Agilent 7673A automatic sampler (Agilent Technologies, Inc.). Separations were accomplished using a 100 min SP-2560 (Supelco) fused silica capilary column (0.25 mm i.d. and 0.20 μM film thickness) according to Duckett et al.Citation9 Individual fatty acids were identified by comparison of retention times with standards (Sigma-Aldrich; Matreya). Fatty acids were quantified by incorporating an internal standard, methyl tricosanoic (C23:0) acid into each sample during methylation and expressed as amount (ug) per well (cells) or weight percentages.
Lipogenic rate
To determine de novo lipogenesis in the adipocytes from the two nutritional treatments, 1,2-13C2 (10 mM) was supplemented in place of unlabelled acetate on d 4 and the samples harvested directly into 2:1 chloroform:methanol (v/v) to terminate the enzyme activity at 0, 6, 12, 24, and 48 h for GC-MS analysis. The cellular FAs were prepared for GC-MS analysis as described above. The enrichment of 13C16:0 were analyzed using Agilent 6890N gas chromatograph (GLC; Agilent Technologies, Inc.) equipped with 30 min Agilent 19091 S-433 (Agilent Technologies, Inc.) capillary column (0.25 mm i.d. and 0.25 μm film thickness) and Agilent 5975C mass spectrometer (MS). Peaks of mass-to-charge ratio (m/z) 270 (m), 272 (m + 2), and 274 (m + 4) were measured using selected ion monitoring to calculate the isotopic enrichment of C16:0, the primary product of de novo lipogenesis. The calculations were done using Mass Isotopomer Distribution Analysis (MIDA) according to Wolfe and ChinkesCitation27 as detailed in our previous publications (see refs. 3 and 4). Briefly, the FA enrichment was calculated as tracer-to-tracee Ratio (TTR) by accounting for background noise and natural abundance of 13C-isotope i.e., TTR16:0 = (RAsample – RAblank) × (1 – A)N, where A was the natural abundance of 13C, A = 0.011; N was the number of C in the fatty acid molecule, n = 16; RA was relative abundance. The blank samples used for background correction did not have labeled FA isotope in the media. Precursor enrichment in molar percent excess (MPE) was estimated by: MPEprecursor = {2 × [TTR(m + 4) / TTR(m + 2)]}/[(p – 1) + {2 × [TTR(m + 4) / TTR(m + 2)]}] where, p is the number of precursor monomers present in the polymer, P = 8. The estimate of lipogenesis was derived by calculating fractional synthesis rate (FSR). FSRlipogenesis = (TTRc16:0, time1 – TTRc16:0, time0) / [(p × MPEprecursor) (1 − MPEprecursor)p − 1 (time1 – time0)].
Activity of GDPH was assayed using commercial kit (Clontech Laboratories, Inc.) according to manufacturer's instructions. The cells were washed twice with ice cold PBS and extracted with enzyme extraction buffer. Protein activity was determined by measuring the decrease in absorbance at 340 nm using a plate reader (Bio-Tek Snergy HT, Bio-Tek). Total protein concentration was measured using a commercial kit (DC Protein assay kit, Bio-rad) and GPDH activity was represented as the amount NADH oxidized/min per mg of protein.
Adipogenic gene expression
Total cellular RNA was extracted using mirVANA miRNA isolation kit (Ambion) according to the manufacturer's instructions. The RNA concentrations were measured using a Nanodrop ND-1000 spectrophotometer (Thermo Fisher Scientific) and the quality was assessed as a ratio of 260:280 absorbance. All the samples had a ratio of 1.9–2.1. RNA integrity was measured using Agilent Bioanalyzer 2100 with Agilent RNA 600 Nano kit. The RNA integrity Number of the samples ranged from 7.5 to 9.6. RNA (500 ng) was used for first-strand cDNA synthesis by reverse transcription using SuperScript III First-strand Synthesis SuperMix (Invitrogen) in a 20-μL reaction. The conditions used for cDNA synthesis were 25°C for 10 min, 50°C for 30 min, and 85°C for 5 min followed by addition of RNase H and incubation at 37°C for 10 min. A control reaction in parallel was run in the absence of reverse transcriptase for each first-strand synthesis. First-strand cDNA synthesis was done in duplicate for each sample.
For RT-PCR, 2 μL aliquot of cDNA reaction product and 100 pM of each primer were used per 25 μL PCR reaction with 12.5 μL of QuantiTect SYBR Green RT-PCR Master Mix (Qiagen). Previously reported primer sequences were used for acetyl CoA carboxylase (ACC), fatty acid synthase (FASN), stearoyl-coA desaturase (SCD1), peroxisome proliferator-activated receptor gamma (PPARG), glyceraldehyde-3-phosphate dehydrogenase (GAPDH), ELOVL fatty acid elongase 6 (ELOVL6), glycerol-3-phosphate dehydrogenase (GPDH), fatty acid binding protein 4 (AP2), and CCAAT/enhancer binding protein α (C/EBPα). Primer sets were initially evaluated using end-point PCR as described previously by Duckett et al.Citation11 Standard curves were generated for each primer set with a 2-fold dilution of initial total RNA at 50, 25, 12.5, 6.25, and 3.125 ng for each reaction and the primer efficiencies were calculated using Eppendorf Mastercycler software. Real-Time PCR was done using Eppendorf Mastercycler ep realplex instrument (Eppendorf) with the following conditions: DNA polymerase activation at 95°C for 15 min, 40 PCR cycles for 15 s at 94°C, 30 s at annealing temperature, and 30 s at 72°C, with fluorescence detected during the 72°C extension step. Melting curves were generated at the end of the amplification to verify the presence of a single product. The expression of GAPDH was used for normalization. The validation of GAPDH as internal control gene was as explained in our earlier reports (see refs. 3, 4, and 11).
Statistical analyses
Data are presented as mean ± SEM. The mixed procedure of SAS (SAS Enterprise Guide, version 4.3, SAS Institute Inc.) was used with treatments as fixed effects and replicates as random effects. Differences in the treatments were separated using the Fisher least square significant difference pair-wise comparisons. The results were considered significant at P ≤ 0.05.
Disclosure of Potential Conflicts of Interest
No potential conflicts of interest were disclosed.
Funding
This project was funded in part by USDA-NIFA grant award 2010-38942-20745.
References
- Grant AC, Ortiz-Colòn G, Doumit ME, Buskirk DD. Optimization of in vitro conditions for bovine subcutaneous and intramuscular preadipocyte differentiation. J Anim Sci 2008; 86:73-82; PMID:17911240; http://dx.doi.org/10.2527/jas.2007-0379
- Lengi AJ, Corl BA. Factors influencing the differentiation of bovine preadipocytes in vitro. J Anim Sci 2010; 88:1999-2008; PMID:20154153; http://dx.doi.org/10.2527/jas.2009-2439
- Burns TA, Duckett SK, Pratt SL, Jenkins TC. Supplemental palmitoleic (C16:1 cis-9) acid reduces lipogenesis and desaturation in bovine adipocyte cultures. J Anim Sci 2012; 90:3433-41; PMID:22851248; http://dx.doi.org/10.2527/jas.2011-4972
- Burns TA, Kadegowda AKG, Duckett SK, Pratt SL, Jenkins TC. Palmitoleic (16:1 cis-9) and cis-vaccenic (18:1 cis-11) acid alter lipogenesis in bovine adipocyte cultures. Lipids 2012; 47:1143-53; PMID:23077002; http://dx.doi.org/10.1007/s11745-012-3723-9
- Hausman GJ, Dodson MV, Ajuwon K, Azain M, Barnes KM, Guan LL, Jiang Z, Poulos SP, Sainz RD, Smith S, et al. Board-invited review: the biology and regulation of preadipocytes and adipocytes in meat animals. J Anim Sci 2009; 87:1218-46; PMID:18849378; http://dx.doi.org/10.2527/jas.2008-1427
- Realini CE, Duckett SK, Brito GW, Dalla Rizza M, De Mattos D. Effect of pasture vs. concentrate feeding with or without antioxidants on carcass characteristics, fatty acid composition, and quality of Uruguayan beef. Meat Sci 2004; 66:567-77; PMID:22060866; http://dx.doi.org/10.1016/S0309-1740(03)00160-8
- Faucitano L, Chouinard PY, Fortin J, Mandell IB, Lafrenière C, Girard CL, Berthiaume R. Comparison of alternative beef production systems based on forage finishing or grain-forage diets with or without growth promotants: 2. Meat quality, fatty acid composition, and overall palatability. J Anim Sci 2008; 86:1678-89; PMID:18375659; http://dx.doi.org/10.2527/jas.2007-0756
- Duckett SK, Neel JPS, Fontenot JP, Clapham WM. Effects of winter stocker growth rate and finishing system on: III. Tissue proximate, fatty acid, vitamin, and cholesterol content. J Anim Sci 2009; 87:2961-70; PMID:19502506; http://dx.doi.org/10.2527/jas.2009-1850
- Duckett SK, Neel JPS, Lewis RM, Fontenot JP, Clapham WM. Effects of forage species or concentrate finishing on animal performance, carcass and meat quality. J Anim Sci 2013; 91:1454-67; PMID:23345568; http://dx.doi.org/10.2527/jas.2012-5914
- Duckett SK, Wagner DG, Yates LD, Dolezal HG, May SG. Effects of time on feed on beef nutrient composition. J Anim Sci 1993; 71:2079-88; PMID:8376232
- Duckett SK, Pratt SL, Pavan E. Corn oil or corn grain supplementation to steers grazing endophyte-free tall fescue. II. Effects on subcutaneous fatty acid content and lipogenic gene expression. J Anim Sci 2009; 87:1120-8; PMID:19028850; http://dx.doi.org/10.2527/jas.2008-1420
- Wright AM, Andrae JG, Miller M, Gunter P, Fernandez Rosso C, Pavan E, Duckett SK. Effect of forage type with or without corn grain supplementation on beef fatty acid composition and palatability. J Anim Sci 2013; 91:17.
- Hood RL, Allen CE. Cellularity of bovine adipose tissue. J Lipid Res 1973; 14:605-10; PMID:4742557
- Cianzio DS, Topel DG, Whitehurst GB, Beitz DC, Self HL. Adipose tissue growth and cellularity: changes in bovine adipocyte size and number. J Anim Sci 1985; 60:970-6; PMID:3988658
- Robelin J. Growth of adipose tissues in cattle; Partitioning between depots, chemical composition, and cellularity. A Review. Livest Prod Sci 1986; 14:349-64; http://dx.doi.org/10.1016/0301-6226(86)90014-X
- Eguinoa P, Brocklehurst S, Arana A, Mendizabal JA, Vernon RG, Purroy A. Lipogenic enzyme activities in different adipose depots of Pirenaican and Holstein bulls and heifers taking into account adipocyte size. J Anim Sci 2003; 81:432-40; PMID:12643487
- Gondret F, Guitton N, Guillerm-Regost C, Louveau I. Regional differences in porcine adipocytes isolated from skeletal muscle and adipose tissues as identified by a proteomic approach. J Anim Sci 2008; 86:2115-25; PMID:18310487; http://dx.doi.org/10.2527/jas.2007-0750
- Pratt SL, Burns TA, Curry E, Duckett SK. Expression of microRNA during bovine adipogenesis. J Nucl Acids Invest 2010; 1(e12):62-70.
- Casimir DA, Ntambi JM. cAMP activates the expression of stearoyl-CoA desaturase gene 1 during early preadipocyte differentiation. J Biol Chem 1996; 271:29847-53; PMID:8939924; http://dx.doi.org/10.1074/jbc.271.47.29847
- Chung KY, Lunt DK, Choi GB, Chae SH, Rhoades RD, Adams TL, Booren B, Smith SB. -10 cis-12 conjugated linoleic acid antagonizes arginine-promoted differentiation of bovine preadipocytes. Adipocytes 2006; 2:93-100.
- Kadegowda AKG, Burns TA, Miller MC, Duckett SK. Cis-9, trans-11 conjugated linoleic acid is endogenously synthesized from palmitelaidic (C16:1 trans-9) acid in bovine adipocytes. J Anim Sci 2013; 91:1614-23; PMID:23408826; http://dx.doi.org/10.2527/jas.2012-5590
- Kadegowda AKG, Burns TA, Pratt SL, Duckett SK. Inhibition of stearoyl-CoA desaturase 1 reduces lipogenesis in primary bovine adipocytes. Lipids 2013; 48:967-76; PMID:23929455; http://dx.doi.org/10.1007/s11745-013-3823-1
- Hirai S, Matsumoto H, Hino N, Kawachi H, Matsui T, Yano H. Myostatin inhibits differentiation of bovine preadipocyte. Domest Anim Endocrinol 2007; 32:1-14; PMID:16431073; http://dx.doi.org/10.1016/j.domaniend.2005.12.001
- Aso H, Abe H, Nakajima I, Ozutsumi K, Yamaguchi T, Takamori Y, Kodama A, Hoshino FB, Takano S. A preadipocyte clonal line from bovine intramuscular adipose tissue: nonexpression of GLUT-4 protein during adipocyte differentiation. Biochem Biophys Res Commun 1995; 213:369-75; PMID:7646489; http://dx.doi.org/10.1006/bbrc.1995.2141
- Folch J, Lees M, Sloane Stanley GH. A simple method for the isolation and purification of total lipides from animal tissues. J Biol Chem 1957; 226:497-509; PMID:13428781
- Park PW, Goins RE. In situ preparation of fatty acid methyl esters for analysis of fatty acid composition in foods. J Food Sci 1994; 59:1262-6; http://dx.doi.org/10.1111/j.1365-2621.1994.tb14691.x
- Wolfe RR, Chinkes DL. Isotope Tracers in Metabolic Research: Principles and Practice of Kinetic Analysis. 2nd ed. Hoboken: Wiley-Liss; 2005. Chapter 9, Mass Isotopomer Distribution Analysis; p 203-13.