
 ?Mathematical formulae have been encoded as MathML and are displayed in this HTML version using MathJax in order to improve their display. Uncheck the box to turn MathJax off. This feature requires Javascript. Click on a formula to zoom.
Abstract
Early studies reported that the size of adipose cells positively correlates with insulin resistance, but recent evidence suggests that the relationship between adipose cell size and insulin resistance is more complex. We previously reported that among BMI-matched moderately obese subjects who were either insulin sensitive or resistant insulin resistance correlated with the proportion of small adipose cells, rather than the size of the large adipose cells, whereas the size of large adipose cells was found to be a predictor of insulin resistance in the first-degree relatives of type 2 diabetic (T2D) patients. The relationship between adipose cellularity and insulin resistance thus appears to depend on the metabolic state of the individual. We did a longitudinal study with T2D patients treated with the insulin-sensitizer rosiglitazone to test the hypothesis that improved insulin sensitivity is associated with increased adipocyte size. Eleven T2D patients were recruited and treated with rosiglitazone for 90 days. Blood samples and needle biopsies of abdominal subcutaneous fat were taken at six time points and analyzed for cell size distributions. Rosiglitazone treatment ameliorated insulin resistance as evidenced by significantly decreased fasting plasma glucose and increased index of insulin sensitivity, QUICKI. In association with this, we found significantly increased size of the large adipose cells and, with a weaker effect, increased proportion of small adipose cells. We conclude rosiglitazone treatment both enlarges existing large adipose cells and recruits new small adipose cells in T2D patients, improving fat storage capacity in adipose tissue and thus systemic insulin sensitivity.
Introduction
Obesity leads to insulin resistance, which in turn increases the risk for Type 2 diabetes (T2D).Citation1 It has been proposed that a failure of adipocyte differentiation or defect in fat storage capacity in subcutaneous adipose tissue leads to fat storage in the main insulin responsive organs such as muscle and liver, causing insulin resistance and possibly T2D.Citation2-4 However, the underlying mechanism that regulates adipose cell size remains unclear. Numerous early human studies have suggested that insulin resistance is associated with larger adipose cells.Citation5-12 Indeed, at the cell level, larger adipose cells are more insulin resistant.Citation5,6 On the population level, however, recent evidence suggests that the situation may be different and more complex.Citation13 It was found that among equally and moderately obese subjects, insulin resistance was associated with a larger proportion of small adipose cells, with only a trend toward increased size of the large adipose cells that was not significant.Citation13 On the contrary, in first-degree relatives of T2D patients with BMI ranging from 18 to 34, we found an inverse correlation between insulin sensitivity and the size of the large adipose cells, but no correlation between insulin sensitivity and the proportion of large cells.Citation14
These studies suggest that the relationship between adipose cell-size distribution and insulin sensitivity depends on the metabolic status of the subjects studied. We have proposed the unifying interpretation that in the various cases studied, insulin resistance is at least in part a consequence of reduced capacity to store fat; impairment of this capacity would lead to ectopic deposition of fat in non-adipose organs that are poorly equipped to handle the load and become insulin resistant. Here we extend our approach to T2D patients. We reasoned that in such subjects fat-cell size would be limited by insulin resistance combined with inadequate increase of insulin to compensate. We therefore hypothesized that insulin sensitization would result in increased fat-cell size. Based on our earlier studies, we further hypothesized that improved insulin sensitivity would also increase recruitment of new small adipocytes, which would increase the ability of adipose tissue to absorb increased fat loads.
The study design was to treat T2D patients with rosiglitazone, a member of the class of thiazolidinediones (TZDs) and observe changes in cell-size parameters over time. These agonists of the nuclear receptor peroxisome proliferator-activated receptor (PPAR) γ are insulin-sensitizing agents used clinically to treat insulin resistance and T2D.Citation15,16 Early studies showed that TZD treatment ameliorates insulin resistance, which is associated with increased numbers of small adipose cells in adipose tissue both in animal modelsCitation17-20 and in human T2D subjects.Citation21,22 However, other studies showed that TZD treatment did not changeCitation23,24 or even increasedCitation25 adipose cell size despite increased insulin sensitivity in those treated T2D patients. In order to improve our power to observe changes, we for the first time studied the effects of a TZD longitudinally, with assessments at multiple time points over the course of 90 d. We obtained biopsies of subcutaneous adipose tissue and assessed them for cell size distributions and expression of key adipose genes along with blood samples to track ancillary metabolic parameters.
Results
Clinical characteristics of subjects
We recruited 12 patients (11 men and 1 woman) with T2D. The clinical characteristics of the 11 patients who completed the 90-d treatment are presented in . At baseline these subjects had an average BMI of 27.8 ± 2.7, fat mass of 29.8 ± 4.6%, HbA1C of 6.2 ± 1.4%, fasting plasma glucose of 8.7 ± 2.4 mM, and fasting plasma insulin of 13.7 ± 8.4 mU/L.
Table 1. Clinical and laboratory characteristics of the subjects (n = 11) before and after rosiglitzone treatment for 90 d
Adipose cell size distribution by curve fitting
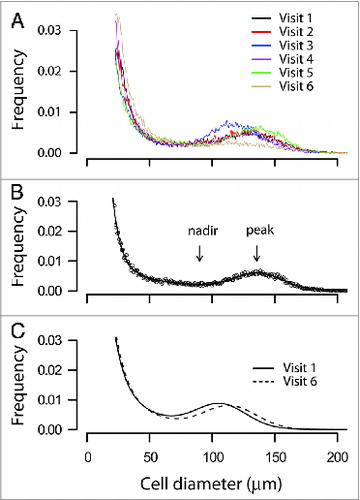
We observed typical multimodal adipose cell-size distributions in abdominal subcutaneous fat biopsies of the subjects before treatment and during five subsequent visits after rosiglitazone treatment (), similar to those seen previously in non-diabetic, moderately obese subjects,Citation13 T2D patients,Citation21,26 and the first-degree relatives of T2D patients.Citation14 shows an example of the adipose cell-size distribution from one individual fitted to the seven-parameter formula described in Materials and Methods. Comparison of the fitted curves of adipose cells size distributions generated from the average parameters of the 11 subjects before (visit 1) and after rosiglitazone treatment (visit 6) shows a right shift of the peak center of the large adipose cells after rosiglitazone treatment ().
Figure 1. Adipose cell size distribution by curve fitting. (A) Raw adipose cell size distributions of a representative subject (no. 5) from pre-treatment and subsequent five visits with rosiglitazone. Abdominal subcutaneous fat biopsies (20–30 mg) from the patient before and after each treatment with rosiglitazone were obtained with a needle aspiration technique from the paraumbilical region, fixed with osmium tetroxide, and analyzed with Coulter Counter Multisizer III as described in Materials and Methods. Data were plotted with cell diameter (μm) using linear bins against relative frequency in percentage. The data also show labile character of fraction of large adipose cells and peak center, which first increase then decrease. (B) An example of the adipose cell size distribution from one individual fitted to a formula that generates seven parameters as described in the Materials and Methods. Dotted line represents the raw data points and the solid line the fitted curve. The fitted curve consists of two exponentials, capturing the tail of small adipose cells, plus a Gaussian function, capturing the peak of large adipose cells. Nadir, the lowest point between the fraction of the small adipose cells (the area under the two exponentials) and that of the large adipose cells (the area under the Gaussian peak); peak or cp, the peak diameter of the large adipose cells. (C) Fitted curves of adipose cells size distributions generated from the average parameters of 11 subjects before (visit 1, solid line) and after rosiglitazone treatment (visit 6, dashed line).
Rosiglitazone treatment ameliorates insulin resistance
As shown in , rosiglitazone treatment improved insulin sensitivity of the subjects, as judged by a significant increase of QUICKI (pre-treatment, 0.221 ± 0.031, vs. post-treatment, 0.234 ± 0.033, P = 0.002), an index of insulin sensitivity.Citation27 The linear trend over all six visits from the linear mixed effect model was also significant (P = 0.014).
The metabolic improvement was primarily manifest as a decrease in plasma glucose. The final (6th) glucose measurement was significantly below baseline (pre-treatment, 8.7 ± 2.4 mM, vs. post-treatment, 7.4 ± 1.5 mM, P = 0.02) by Student paired t test. The linear mixed effect model (Fig. S1) showed that the linear trend over all six visits was highly significant (P < 0.0001). Plasma insulin also trended down, but final values were not significantly below baseline (pre-treatment, 13.7 ± 8.4 mU/L; post-treatment, 11.7 ± 5.8 mU/L). The linear mixed effect model showed a trend to decrease with treatment days (P = 0.08), but with a slope that was close to 0 (Fig. S2).
As further evidence that rosiglitazone treatment was effective in reducing insulin resistance in our subjects, plasma adiponectin rose robustly with P = 0.0001 for the last visit vs. the first visit and P < 1e−15 for the linear mixed effect model (; Fig. S3). Also, Table S1 shows that rosiglitazone treatment increased mRNA expression of GLUT4 (pre vs. post, 1.45 ± 1.07 vs. 3.43 ± 2.08, P = 0.0005), ADIPOQ (1.07 ± 0.33 vs. 1.72 ± 0.35, P = 0.001), and UCP2 (0.58 ± 0.34 vs. 1.53 ± 0.6, P = 0.0002), but not PGC1 and aP2, indicating that rosiglitazone treatment had beneficial metabolic effects on adipose tissue.
Rosiglitazone treatment increases the size and reduces the proportion of large adipose cells
Based on our previous findings,Citation13,22,28 we focused on two parameters of the adipose cell-size distributions, the size of the large cells, assessed as the location of the peak of large cells, and the proportion of small cells, assessed as the fraction of cells below the fitted nadir (see ). These are plotted in and , respectively.
Figure 2. Time courses of the centers of the large adipose cell peak from all subjects (n = 11) treated with rosiglitazone for 90 d. The center (cp) of the large adipose cell was defined in and Materials and Methods. The values of cp were obtained from the fitted curves of adipose cell size distributions of each patient before and following each treatment at indicated time points. Time courses were fit to a linear (dashed line). Data were analyzed with a linear mixed effects model using the function 1mer in R as described in the Materials and Methods.
Figure 3. Time courses of the fraction of adipose cells below nadir from all subjects (n = 11) treated with rosiglitazone for 90 d. The fraction below nadir (FBN) represents the fraction of small adipose cells as defined in and Methods. The values of FBN were obtained from the fitted curves of adipose cell size distributions of each patient before and following each treatment at indicated time points. Data were analyzed as in . Note that the disconnection in the data points in subject No. 9 was due to an accidental loss of the data point of the third visit.
There is evidently a great deal of variability, but there was a significant linear trend for the peak of large adipose cells to increase, meaning that the typical size of the large cells increased (P = 0.0008 for the mixed model, P = 0.005 for last vs. first visit via t test), in spite of decreases for subjects 5 and 12 at the last visit (). An increase in the size of the large adipose cells is not unexpected, as the subjects gained weight modestly (mean increase in BMI over the 90 d was 0.45 kg/m2, P = 0.02 by paired t test). We note, however, that the relationship between BMI and peak center was weaker after treatment and suggest that at least part of the increase in BMI was due to improved insulin sensitivity rather than weight gain (see Discussion). In addition, some of the weight gain may have been water, which would further strengthen the case.
The fraction of cells below the nadir also showed dynamic changes, but it is more difficult to discern a trend, as some subjects showed an increase followed by a decrease and others the reverse. Nonetheless, there is a linear trend for fraction below the nadir to increase modestly that was statistically significant (P = 0.01). This was the only variable for which the mixed model was not significant when the 6th visit was dropped (P = 0.5). Nonetheless, the fitted slope is hardly different (not shown) when only the first 5 visits are used, suggesting that the 6th visit did not exert undue influence on the fit.
Discussion
Summary of findings
Eleven T2D subjects were treated with the insulin-sensitizer rosiglitazone for 90 d, and were examined for a range of metabolic parameters and adipose cell size distributions. To our knowledge, this is the first study in which multiple sequential biopsies from abdominal subcutaneous fat tissue have been performed with human subjects in order to ascertain adipose cell-size parameters. The subjects became less insulin-resistant as assessed by the index QUICKI, showing reduced fasting plasma glucose, but no demonstrable decrease in fasting plasma insulin. The size of the large adipose cells increased and at the same time, the proportion of small adipose cells increased. The increase in the fraction of cells below the nadir was less clear cut because in some subjects it first increased, then decreased, and vice versa in other subjects. We interpret these results together as showing that the drug treatment had two effects: pre-existing adipose cells became larger and new small adipose cells were recruited. The order of increase and decrease in the proportion of small adipose cells could depend on whether recruitment or expansion occurred first in a given subject. The two effects would work together to increase fat storage capacity; the increase in adipose cell size would increase current capacity and the recruitment of small adipose cells would increase the ability to store future increases in fat.
We believe that the increase in the size of the large adipose cells was not due solely to the weight gained by the subjects, which was modest. The correlation between BMI and peak center weakened after treatment (P = 0.003, R2 = 0.61 on visit 1 vs. P = 0.08, R2 = 0.22 on visit 6). Thus, we suggest that the increase in insulin sensitivity and consequent reduction in lipolysis contributed as well to the increase in the size of the large adipose cells.
Comparison with previous studies
We first consider cross-sectional studies correlating insulin resistance with adipose cell-size parameters. McLaughlin et al.Citation13 found that insulin resistance correlated with an increased fraction of small adipose cells. The increase in size of the large adipose cells in that study did not reach significance, but an expanded study found an increase in insulin-resistant subjects.Citation29
Yang et al.Citation14 looked at non-diabetic subjects who were first-degree relatives of T2D patients with a wider range of BMI and found that the size of the large adipose cells correlated with BMI, but also modestly with insulin resistance measured by hyperinsulinemic–euglycemic clamp after correction for BMI.
Together, these two studies suggest that both a reduced fraction of large cells and increased size of large cells are correlated with insulin resistance.
The results in the current study are by and large compatible with longitudinal studies of the effects of TZD treatment on adipose cell-size parameters, but with some differences of detail. Koenen et al.Citation25 reported that the pioglitazone treatment significantly improved insulin sensitivity in T2D patients, and that this was accompanied by a significant enlargement of the subcutaneous adipose cell size and increases of mRNA expression levels of adiponectin and GLUT4 in adipose tissue.
McLaughlin et al.Citation22 gave pioglitazone to insulin-resistant but non-diabetic subjects and found an increase in the fraction of small adipose cells, but no increase in the size of the large adipose cells. However, the peak of the large adipose cells broadened, so it is possible that both medium-sized adipose cells and large adipose cells increased in size, obscuring the change in the peak in that study. The degree of improvement in insulin sensitivity, as assessed by the insulin suppression test, was correlated with the increase in the proportion of small adipose cells. Of note, in that study CT scans showed that the size of the visceral adipose tissue (VAT) depot decreased while the size of the subcutaneous adipose tissue (SAT) depot increased. This is consistent with a model in which VAT functions as an ectopic fat store because of limited storage capacity in SAT. TZD treatment would in this view enable a transfer of fat from VAT to SAT by increasing the storage capacity of SAT. Although we did not measure the sizes of the VAT and SAT compartments in the current study, the increased fat storage capacity of the SAT compartment would be permissive of a transfer similar to that seen in the non-diabetic subjects studied by McLaughlin et al.Citation22
In the study of Smith et al.Citation21 T2D subjects were treated for a longer period, six months, with pioglitazone, and adipose cell size distributions before and after were compared. The histograms were fitted differently than in our study, with four Gaussian curves rather than one Gaussian curve and two exponentials. The population of cells was divided into four groups: small, medium, large, and very large, rather than our division into small and large, which makes direct comparisons difficult. Nonetheless, those authors found that the fraction of small adipose cells increased, in agreement with our study. They also found that the proportion of very large adipose cells increased, but the fraction of large adipose cells went down. Thus, adipose cells shifted from the large subgroup to the very large subgroup, which is compatible with our study. The center of the peak of very large adipose cells moved left, but it is unclear what the net change would have been had the large and very large subpopulations been merged as in our study. Broadly speaking, however, the two studies are in agreement that TZD treatment induced similar changes in both large and small adipose cells.
The TZD studies together support the hypothesis that TZD treatment increases both the proportion of small adipose cells and the size of the large adipose cells. It may appear paradoxical that increased insulin sensitivity is associated with an increase in the size of the large adipose cells following TZD treatment when the cross-sectional studies show, if anything, the opposite. Note, however, that increased insulin sensitivity would be associated with decreased lipolysis and increased lipid uptake, which would tend to increase adipose cell size. On the other hand, if improved sensitivity results in lower ambient insulin concentrations, adipose cell size would tend to decrease. The net effect of improving insulin sensitivity thus would depend on quantitative differences in different study populations. In our study, the insulin concentrations did not decline much, if at all, so the hypertrophic effect of improved insulin action may have outweighed the reduction in insulin concentration.
A further paradox is that, whereas in our cross-sectional studies,Citation13,29 an increased proportion of small cells was associated with insulin resistance, in both a prior interventional studyCitation22 and the current study, an increased proportion of small cells was associated with improved insulin sensitivity. We suggest that not all small cells are the same: what matters is their ability to expand and take up fat, as small cells per se cannot contribute much to fat storage. In insulin resistant subjects, the excess of small cells may reflect an inability to expand whereas subjects with TZDs may have increased recruitment of expansion competent cells. Similarly, in the insulin resistant subjects studied cross-sectionally, the hypertrophy of the large the cells may reflect failure to recruit new small cells when needed, whereas in the interventions, hypertrophy may be a consequence of improved insulin sensitivity and hence reduced lipolysis.
We further suggest that the two processes, expansion of the large cells and the recruitment of small cells, may be linked. Longitudinal observation of fat-cell size in Zucker fa/fa rats revealed periodic waves of expansion and recruitment, and a mathematical model showed that this could be accounted for by the assumption that when the large cells become too large, they generate a signal to recruit new small cells.Citation30 A recent study implicated secretion by mature adipocytes of BMP4 to induce commitment of adipocyte precursor cells as a possible element in such a process.Citation31 Cellular level studies are needed to test these hypotheses. Such studies are challenging and are left for future work.
Contrast between TZD treatment and weight loss
TZD treatment increases the size of the large adipose cells, at least according to this study and that of Koenen et al.Citation25 Weight loss, which also improves insulin sensitivity, in contrast decreases the size of the large adipose cells.Citation32 Here, the fall in glucose was nearly a mirror image of the rise in the size of the large adipose cells (compare and Fig. S1), and we have suggested above that it was the enhanced insulin sensitivity that permitted the large adipose cells to expand. In weight loss, the direction of causation would be reversed – the decrease in weight would decrease the whole-body fat load, which both relieves the insulin resistance and allows the adipose cells to shrink. The mechanisms by which weight loss and insulin sensitizers improve insulin resistance may be different, but note that both would reduce ectopic fat, weight loss by reducing the amount of fat to be stored, TZD by increasing the ability of adipose cells to store fat.
Strengths and limitations of the study
A strength of our study is the use of multiple biopsies over time to limit the variability of the data, which were nonetheless quite variable. A limitation was the lack of untreated control subjects.
Conclusions
We conclude that enhancement of insulin sensitivity by rosiglitazone treatment allows for the enlargement of existing large adipose cells (hypertrophy) and recruitment of new small adipose cells in T2D patients (hyperplasia). In contrast, insulin sensitivity studied cross-sectionally in human subjects, weight matched or with statistical correction for variation in BMI, is associated negatively with hyperplasia and hypertrophy. We suggest that the apparent paradox can be resolved by the principle that impaired fat storage capacity leads to insulin resistance, whereas enhanced storage capacity results in improved insulin sensitivity. This principle can be extended to cover the case of weight loss, which would improve insulin sensitivity by reducing the fat load. This study draws attention to the possibility that adipocytes can enlarge for either harmful or beneficial reasons. In insulin-resistant subjects, large cell size may result from inadequate ability to recruit new small cells or expand existing small cells. TZD treatment, in contrast, may increase the size of the large cells by reducing lipolysis. We further propose that in metabolically healthy individuals, hypertrophy and hyperplasia are linked, with mature adipocytes generating a signal to recruit new small cells when they become too large. This link may be disrupted in individuals with hypertrophic obesity, contributing to insulin resistance, and repaired by TZD treatment.
Materials and Methods
Subjects and treatment
We recruited 12 T2D patients (including 11 men and one woman) in Gothenburg, Sweden via a newspaper advertisement. Patients on treatment with diet or oral hypoglycemic agents participated, and rosiglitazone 8 mg QD was added to the treatment regimen in accordance with the approved label. Before the study, three patients were on diet treatment, three on sulfonylurea, two on repaglinide, two on metformin, and one on sulfonylurea and metformin combined. The regional ethical review board in Gothenburg approved this exploratory open trial, which was performed in accordance with the principles of the Declaration of Helsinki. Informed consent was obtained from all patients.
Clinically significant diseases or symptoms, such as ischemic heart disease and thyroid disease as well as HbA1c > 10% were exclusion criteria. Seven patients were treated with antihypertensive agents and four with statins against hyperlipidemia. All patients were non-smokers but one subject used moist snuff. The patients were encouraged not to change their lifestyle habits during the study. One lean untreated patient (BMI 20) had previously been diagnosed with T2D on clinical grounds but was excluded due to low serum insulin and C-peptide levels as well as rapidly deteriorating glycemic control. Thus, the results are based on the 11 patients who concluded the 90-d treatment period. The clinical characteristics are presented in .
Clinical procedures
Blood samples and abdominal fat biopsies were collected pre-treatment and 90 d after initiation of rosiglitazone treatment from the subjects. Biopsies and selected blood samples were also collected at four intervening time points for a total of six longitudinal samples. All blood sampling and examinations were done in the morning after an overnight fast and before the participants had taken any of their daily medication. The biopsies (approximately 300 mg) were taken from the subcutaneous adipose tissue in the paraumbilical region after local infiltrative anesthesia with lidocaine (10 mL, 0.5%). Plasma glucose was analyzed using an automatic glucose analyzer (YSI 2700 SELECT, Yellow Spring Instruments). Insulin was analyzed with a standard radioimmunoassay (Pharmacia). HbA1c was determined using high-performance liquid chromatography (Mono-S method). In this study, all HbA1c values were converted to NGSP standard levels using the formula: HbA1c (NGSP) = (0.923 × HbA1c (Mono-S) + 1.345 (R2 = 0.998). High-sensitive C-reactive protein (HS-CRP) was analyzed with an immunoturbidimetric method. Total adiponectin was measured using the Human Adiponectin ELISA Kit (B-Bridge International, BioCat, GmbH). The proportion of body fat was determined using bioelectrical impedance (single frequency, 50 kHz; Animeter, HTS). Blood pressure was measured in the supine position as a mean (mmHg) of two readings (Korotkoff 1–5), using a cuff of appropriate size. QUICKI, an index of insulin sensitivity, was calculated by the equation 1 / [log(I0) + log(G0)]), where I0 is the fasting plasma insulin concentration and G0 is the fasting plasma glucose concentration as previously described.Citation27
Preparation and quantification of mRNA
Tissue RNA was extracted with RNEasy Minikit (Qiagen). Gene expression was analyzed by real-time PCR with the ABI PRISM 7900 HT sequence detection system (TaqMan, Applied Biosystems) and normalized by 18S rRNA. In the presentation of the results (Table S1), the reference is the baseline mRNA level of the subject PETP arbitrarily set at 1. The levels of aP2, GLUT4, APM1, PGC1, and UCP2 are presented as relative quantities (RQ). Gene-specific primers and probes were designed using Primer Express software or purchased on-demand (Applied Biosystems). The sequences of real-time PCR primers and probes are listed in Table S2.
Measurement of adipose cell size distribution
Adipose cell size distribution was measured as previously described.Citation33 Briefly, abdominal subcutaneous fat biopsies (20–30 mg) were fixed with osmium tetroxide in a water bath at 37°C for 48 h, and assayed for adipose cell size with a Beckman Coulter Multisizer III with a 400-μm aperture, which effectively counts particles with sizes of 20–400 μm. Adipose cell size was analyzed by fitting a formula with seven parameters to the cell size distribution:
where x = cell diameter, and x0 = the smallest diameter; h1 and w1 = height and width of the first exponential; h2 and w2 = height and width of the second exponential; and hp, cp, and wp = height, center, and width squared of the Gaussian curve.Citation13 The nadir and center of the peak of large cells were determined from the points of zero slope of the fitted curve. The proportion of small cells, a measure of hyperplasia, was assessed as the proportion below the nadir, and the size of the large cells, a measure of hypertrophy, as the location of the maximum of the right peak.
The shape of the cell-size distributions is in line with expectations from mathematical modeling of the dynamics of adipose cell growth in rodents, where the size distributions change rapidly in response to normal growth as well as changes in the energy and fat content of the diet. Those models invoke a growth law in which growth accelerates as cell size increases and eventually declines at very large size.Citation34,35 This will generally produce a pronounced left tail and a nadir to the left of the right peak. Note that, while not unimodal, the distribution is not a standard bimodal distribution (sum of two Gaussian curves). The tail of small cells declines monotonically from the minimum size to the nadir. In particular, the distribution has negative slope at the minimum size, as expected from Fick's Law, which says that the slope is the negative of the rate of influx of cells. Previous modeling and statistical studies have shown that the tail of small cells changes in a systematic and reproducible way with animal growth and changes in diet. We previously demonstrated that the adipose cell size distributions of fat biopsies as measured by the Multisizer 3 were similar to those of isolated adipose cells from the same biopsies;Citation13 the advantages of this method over the traditional microscopic techniques for measurement of adipose cell sizeCitation36,37 were also discussed previously.Citation13 Combining the experimental finding by other groups of cell-size distributions with the same character as reported hereCitation13,21,22,26,28 and the results of the dynamic mathematical model gives us confidence that the small cells are real and not artifactual.
Statistics
Data are presented as mean ± SD. Parameters measured only at the first and last biopsy were compared by the paired Student t test. Statistical analysis was performed the R software package (http://www.R-project.org). P < 0.05 was considered statistically significant. Those parameters measured over all six visits were also subjected to testing with a linear mixed effects model using the function lmer in R (lme4 package). The fixed effect is duration of drug therapy and the random effect is unobserved subject variability. Time courses were fit to a straight line with a random intercept and a linear coefficient that was common to all subjects. The linear model for each variable was compared by analysis of variance vs. a null model with intercept and random variation among subjects only. For all significant fits we also checked whether the fits remained significant when the 6th visit was dropped to ensure that the results were not due to excessive leverage from the last time point.
Disclosure of Potential Conflicts of Interest
No potential conflicts of interest were disclosed.
Supplemental data
Supplemental data for this article can be accessed on the publisher's website.
964541_Supplemental_files.pdf
Download PDF (207.2 KB)Acknowledgments
We thank Vipul Periwal (LBM, NIDDK) for insightful comments.
Funding
BE and US were supported by the Swedish Research Council, the Novo Nordisk Foundation, and the Swedish Diabetes Association. JY, SC, and AS were supported by the Intramural Research Program of NIDDK, NIH.
References
- Kahn BB, Flier JS. Obesity and insulin resistance. J Clin Invest 2000; 106:473-81; PMID:10953022; http://dx.doi.org/10.1172/JCI10842
- Danforth E Jr. Failure of adipocyte differentiation causes type II diabetes mellitus? Nat Genet 2000; 26:13; PMID:10973236; http://dx.doi.org/10.1038/79111
- Unger RH. Lipotoxic diseases. Annu Rev Med 2002; 53:319-36; PMID:11818477; http://dx.doi.org/10.1146/annurev.med.53.082901.104057
- Samuel VT, Petersen KF, Shulman GI. Lipid-induced insulin resistance: unravelling the mechanism. Lancet 2010; 375:2267-77; PMID:20609972; http://dx.doi.org/10.1016/S0140-6736(10)60408-4
- Salans LB, Knittle JL, Hirsch J. The role of adipose cell size and adipose tissue insulin sensitivity in the carbohydrate intolerance of human obesity. J Clin Invest 1968; 47:153-65; PMID:16695937; http://dx.doi.org/10.1172/JCI105705
- Krotkiewski M, Björntorp P, Sjöström L, Smith U. Impact of obesity on metabolism in men and women. Importance of regional adipose tissue distribution. J Clin Invest 1983; 72:1150-62; PMID:6350364; http://dx.doi.org/10.1172/JCI111040
- Weyer C, Foley JE, Bogardus C, Tataranni PA, Pratley RE. Enlarged subcutaneous abdominal adipocyte size, but not obesity itself, predicts type II diabetes independent of insulin resistance. Diabetologia 2000; 43:1498-506; PMID:11151758; http://dx.doi.org/10.1007/s001250051560
- Weyer C, Wolford JK, Hanson RL, Foley JE, Tataranni PA, Bogardus C, Pratley RE. Subcutaneous abdominal adipocyte size, a predictor of type 2 diabetes, is linked to chromosome 1q21–q23 and is associated with a common polymorphism in LMNA in Pima Indians. Mol Genet Metab 2001; 72:231-8; PMID:11243729; http://dx.doi.org/10.1006/mgme.2001.3147
- Lundgren M, Svensson M, Lindmark S, Renström F, Ruge T, Eriksson JW. Fat cell enlargement is an independent marker of insulin resistance and ‘hyperleptinaemia’. Diabetologia 2007; 50:625-33; PMID:17216279; http://dx.doi.org/10.1007/s00125-006-0572-1
- Lönn M, Mehlig K, Bengtsson C, Lissner L. Adipocyte size predicts incidence of type 2 diabetes in women. FASEB J 2010; 24:326-31; PMID:19741173; http://dx.doi.org/10.1096/fj.09-133058
- Arner P, Arner E, Hammarstedt A, Smith U. Genetic predisposition for Type 2 diabetes, but not for overweight/obesity, is associated with a restricted adipogenesis. PLoS One 2011; 6:e18284; PMID:21532749; http://dx.doi.org/10.1371/journal.pone.0018284
- Paolisso G, Tataranni PA, Foley JE, Bogardus C, Howard BV, Ravussin E. A high concentration of fasting plasma non-esterified fatty acids is a risk factor for the development of NIDDM. Diabetologia 1995; 38:1213-7; PMID:8690174; http://dx.doi.org/10.1007/BF00422371
- McLaughlin T, Sherman A, Tsao P, Gonzalez O, Yee G, Lamendola C, Reaven GM, Cushman SW. Enhanced proportion of small adipose cells in insulin-resistant vs insulin-sensitive obese individuals implicates impaired adipogenesis. Diabetologia 2007; 50:1707-15; PMID:17549449; http://dx.doi.org/10.1007/s00125-007-0708-y
- Yang J, Eliasson B, Smith U, Cushman SW, Sherman AS. The size of large adipose cells is a predictor of insulin resistance in first-degree relatives of type 2 diabetic patients. Obesity (Silver Spring) 2012; 20:932-8; PMID:22240722; http://dx.doi.org/10.1038/oby.2011.371
- Berger J, Moller DE. The mechanisms of action of PPARs. Annu Rev Med 2002; 53:409-35; PMID:11818483; http://dx.doi.org/10.1146/annurev.med.53.082901.104018
- Tontonoz P, Spiegelman BM. Fat and beyond: the diverse biology of PPARgamma. Annu Rev Biochem 2008; 77:289-312; PMID:18518822; http://dx.doi.org/10.1146/annurev.biochem.77.061307.091829
- de Souza CJ, Eckhardt M, Gagen K, Dong M, Chen W, Laurent D, Burkey BF. Effects of pioglitazone on adipose tissue remodeling within the setting of obesity and insulin resistance. Diabetes 2001; 50:1863-71; PMID:11473050; http://dx.doi.org/10.2337/diabetes.50.8.1863
- Johnson JA, Trasino SE, Ferrante AW Jr., Vasselli JR. Prolonged decrease of adipocyte size after rosiglitazone treatment in high- and low-fat-fed rats. Obesity (Silver Spring) 2007; 15:2653-63; PMID:18070756; http://dx.doi.org/10.1038/oby.2007.317
- Hallakou S, Doaré L, Foufelle F, Kergoat M, Guerre-Millo M, Berthault MF, Dugail I, Morin J, Auwerx J, Ferré P. Pioglitazone induces in vivo adipocyte differentiation in the obese Zucker fa/fa rat. Diabetes 1997; 46:1393-9; PMID:9287037; http://dx.doi.org/10.2337/diabetes.46.9.1393
- Okuno A, Tamemoto H, Tobe K, Ueki K, Mori Y, Iwamoto K, Umesono K, Akanuma Y, Fujiwara T, Horikoshi H, et al. Troglitazone increases the number of small adipocytes without the change of white adipose tissue mass in obese Zucker rats. J Clin Invest 1998; 101:1354-61; PMID:9502777; http://dx.doi.org/10.1172/JCI1235
- Smith SR, Xie H, Baghian S, et al. Pioglitazone changes the distribution of adipocyte size in type 2 diabetes. Adipocytes 2006; 2:11-22
- McLaughlin TM, Liu T, Yee G, Abbasi F, Lamendola C, Reaven GM, Tsao P, Cushman SW, Sherman A. Pioglitazone increases the proportion of small cells in human abdominal subcutaneous adipose tissue. Obesity (Silver Spring) 2010; 18:926-31; PMID:19910937; http://dx.doi.org/10.1038/oby.2009.380
- Boden G, Cheung P, Mozzoli M, Fried SK. Effect of thiazolidinediones on glucose and fatty acid metabolism in patients with type 2 diabetes. Metabolism 2003; 52:753-9; PMID:12800103; http://dx.doi.org/10.1016/S0026-0495(03)00055-6
- Shadid S, Jensen MD. Effects of pioglitazone versus diet and exercise on metabolic health and fat distribution in upper body obesity. Diabetes Care 2003; 26:3148-52; PMID:14578253; http://dx.doi.org/10.2337/diacare.26.11.3148
- Koenen TB, Tack CJ, Kroese JM, Hermus AR, Sweep FC, van der Laak J, Stalenhoef AF, de Graaf J, van Tits LJ, Stienstra R. Pioglitazone treatment enlarges subcutaneous adipocytes in insulin-resistant patients. J Clin Endocrinol Metab 2009; 94:4453-7; PMID:19820024; http://dx.doi.org/10.1210/jc.2009-0517
- Pasarica M, Xie H, Hymel D, Bray G, Greenway F, Ravussin E, Smith SR. Lower total adipocyte number but no evidence for small adipocyte depletion in patients with type 2 diabetes. Diabetes Care 2009; 32:900-2; PMID:19228873; http://dx.doi.org/10.2337/dc08-2240
- Katz A, Nambi SS, Mather K, Baron AD, Follmann DA, Sullivan G, Quon MJ. Quantitative insulin sensitivity check index: a simple, accurate method for assessing insulin sensitivity in humans. J Clin Endocrinol Metab 2000; 85:2402-10; PMID:10902785; http://dx.doi.org/10.1210/jcem.85.7.6661
- McLaughlin T, Deng A, Yee G, Lamendola C, Reaven G, Tsao PS, Cushman SW, Sherman A. Inflammation in subcutaneous adipose tissue: relationship to adipose cell size. Diabetologia 2010; 53:369-77; PMID:19816674; http://dx.doi.org/10.1007/s00125-009-1496-3
- McLaughlin T, Lamendola C, Coghlan N, Liu TC, Lerner K, Sherman A, Cushman SW. Subcutaneous adipose cell size and distribution: relationship to insulin resistance and body fat. Obesity (Silver Spring) 2014; 22:673-80; PMID:23666871; http://dx.doi.org/10.1002/oby.20209
- MacKellar J, Cushman SW, Periwal V. Waves of adipose tissue growth in the genetically obese Zucker fatty rat. PLoS One 2010; 5:e8197; PMID:20107501; http://dx.doi.org/10.1371/journal.pone.0008197
- Gustafson B, Smith U. The WNT inhibitor Dickkopf 1 and bone morphogenetic protein 4 rescue adipogenesis in hypertrophic obesity in humans. Diabetes 2012; 61:1217-24; PMID:22447857; http://dx.doi.org/10.2337/db11-1419
- Larson-Meyer DE, Heilbronn LK, Redman LM, Newcomer BR, Frisard MI, Anton S, Smith SR, Alfonso A, Ravussin E. Effect of calorie restriction with or without exercise on insulin sensitivity, beta-cell function, fat cell size, and ectopic lipid in overweight subjects. Diabetes Care 2006; 29:1337-44; PMID:16732018; http://dx.doi.org/10.2337/dc05-2565
- Hirsch J, Knittle JL. Cellularity of obese and nonobese human adipose tissue. Fed Proc 1970; 29:1516-21; PMID:5459900
- Jo J, Gavrilova O, Pack S, Jou W, Mullen S, Sumner AE, Cushman SW, Periwal V. Hypertrophy and/or Hyperplasia: Dynamics of Adipose Tissue Growth. PLoS Comput Biol 2009; 5:e1000324; PMID:19325873; http://dx.doi.org/10.1371/journal.pcbi.1000324
- Jo J, Guo J, Liu T, Mullen S, Hall KD, Cushman SW, Periwal V. Hypertrophy-driven adipocyte death overwhelms recruitment under prolonged weight gain. Biophys J 2010; 99:3535-44; PMID:21112277; http://dx.doi.org/10.1016/j.bpj.2010.10.009
- Franck N, Stenkula KG, Ost A, Lindström T, Strålfors P, Nystrom FH. Insulin-induced GLUT4 translocation to the plasma membrane is blunted in large compared with small primary fat cells isolated from the same individual. Diabetologia 2007; 50:1716-22; PMID:17572871; http://dx.doi.org/10.1007/s00125-007-0713-1
- Jernås M, Palming J, Sjöholm K, Jennische E, Svensson PA, Gabrielsson BG, Levin M, Sjögren A, Rudemo M, Lystig TC, et al. Separation of human adipocytes by size: hypertrophic fat cells display distinct gene expression. FASEB J 2006; 20:1540-2; PMID:16754744; http://dx.doi.org/10.1096/fj.05-5678fje