
Abstract
In phagocytic cells, including the retinal pigment epithelium (RPE), acidic compartments of the endolysosomal system are regulators of both phagocytosis and autophagy, thereby helping to maintain cellular homeostasis. The acidification of the endolysosomal system is modulated by a proton pump, the V-ATPase, but the mechanisms that direct the activity of the V-ATPase remain elusive. We found that in RPE cells, CRYBA1/βA3/A1-crystallin, a lens protein also expressed in RPE, is localized to lysosomes, where it regulates endolysosomal acidification by modulating the V-ATPase, thereby controlling both phagocytosis and autophagy. We demonstrated that CRYBA1 coimmunoprecipitates with the ATP6V0A1/V0-ATPase a1 subunit. Interestingly, in mice when Cryba1 (the gene encoding both the βA3- and βA1-crystallin forms) is knocked out specifically in RPE, V-ATPase activity is decreased and lysosomal pH is elevated, while cathepsin D (CTSD) activity is decreased. Fundus photographs of these Cryba1 conditional knockout (cKO) mice showed scattered lesions by 4 months of age that increased in older mice, with accumulation of lipid-droplets as determined by immunohistochemistry. Transmission electron microscopy (TEM) of cryba1 cKO mice revealed vacuole-like structures with partially degraded cellular organelles, undigested photoreceptor outer segments and accumulation of autophagosomes. Further, following autophagy induction both in vivo and in vitro, phospho-AKT and phospho-RPTOR/Raptor decrease, while pMTOR increases in RPE cells, inhibiting autophagy and AKT-MTORC1 signaling. Impaired lysosomal clearance in the RPE of the cryba1 cKO mice also resulted in abnormalities in retinal function that increased with age, as demonstrated by electroretinography. Our findings suggest that loss of CRYBA1 causes lysosomal dysregulation leading to the impairment of both autophagy and phagocytosis.
Introduction
The retinal pigment epithelium (RPE) is a single layer of pigmented cells situated between the neurosensory retina and the choroid, the vascular layer at the back of the eye.Citation1 The RPE serves many crucial physiological roles that are vital for the normal functioning of the retina.Citation2 One such function is critical to the well-being of the light-sensitive cells of the retina, the photoreceptors. Photoreceptors continually grow new outer segments (OS), where the photosensitive protein rhodopsin is deployed to absorb incident light. As the OS are renewed from the base, the oldest terminal membrane disks are released into the space between the photoreceptors and RPE. The RPE cells must engulf and digest this material by a process called phagocytosis, recycling the constituent molecules back to the retina so the photoreceptors can produce new OS.Citation3
In phagocytic cells, the endolysosomal system is a crucial regulator of both phagocytosis and autophagy, the process by which damaged proteins or organelles within the cell are collected, degraded, and removed.Citation4 Prime examples of this are RPE cells, which are not only among the most active phagocytic cells, continuously phagocytosing shed OS, but also are post-mitotic cells with high metabolic activity, where a high rate of autophagy could be expected.Citation3,Citation5 To ensure the functional integrity of the neural retina, both phagocytosis and autophagy need to be in balance.
In mammalian cells, the most acidic compartments are in the endocytic pathway. Moving from the endoplasmic reticulum, through early endosomes to late endosomes and lysosomes, acidity increases, reaching a pH of about 4.5 in lysosomes.Citation6 The acidity of these organelles affects a number of biological events, including autophagy and phagocytosis. The acidic lumenal environment of the endolysosomal system is primarily established by vacuolar-type H+-ATPase (V-ATPase), which pumps protons into the lumen.Citation7,Citation8 V-ATPases play an important role in normal physiological processes; when deficient they may cause various human diseases, including renal and bone disease and tumor metastasis.Citation9 V-ATPases are multisubunit complexes, composed of a peripheral V1 domain that hydrolyzes ATP and an integral V0 domain that translocates protons from the cytoplasm to the lumen.Citation10 Different V0 subunits (ATP6V0A1/a1, ATP6V0A2/a2, TCIRG1/a3, and ATP6VOA4/a4 in mammals) have been shown to target V-ATPase to distinct cellular destinations.Citation10,Citation11
We have recently shown in RPE cells that phagocytosis is impaired by loss of CRYBA1, perhaps as a result of a defective lysosomal digestion process.Citation12 We report here that CRYBA1 is also involved in autophagy in RPE cells, not affecting autophagosome biogenesis or fusion with lysosomes, but rather the terminal degradative stage of the process. Conditional knockout (cKO) of Cryba1 from RPE in mice reduces normal V-ATPase activity, increasing lysosomal pH and resulting in decreased CTSD activity. CRYBA1 coimmunoprecipitates with V0-ATPase ATP6V0A1 subunit and is the first binding partner for the V0 domain of V-ATPase to be reported in a mammalian system. Our data also suggest that CRYBA1 regulates endolysosomal acidification by modulating V-ATPase via the AKT-MTORC1 (mechanistic target of rapamycin, complex 1) signaling cascade. In an elegant study,Citation13 V-ATPase has been shown to be a component of the MTORC1 pathway in lysosomes and crosstalk between V-ATPase and MTORC1 is necessary for regulating autophagy.Citation14 The cellular structure of RPE in aging cKO mice is disorganized with numerous vacuole-like structures, undigested phagosomes, autophagosomes, cellular materials, and increased lipid deposition compared with the floxed controls. In this study, we have linked impaired lysosomal function to decreased phagocytosis and autophagy in the RPE of our genetic mouse model.
Results
Loss of Cryba1 causes age-dependent abnormalities in the cellular architecture of RPE cells
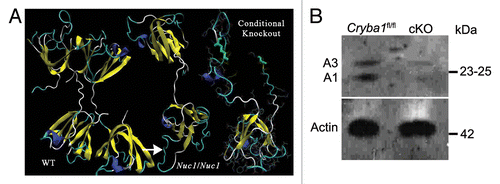
Mice homozygous for deletion of Cryba1 specifically in RPE, were generated and used to explore functions of CRYBA1 in RPE cells. The normal βA3 and βA1-crystallin polypeptides, like all β-crystallins, form homo- and heterodimers and higher oligomers with other β-crystallins.Citation15 Each polypeptide is comprised of 2 similar domains, which are extended such that the domains of 2 polypeptides interact with each other. Three-dimensional modeling indicates that the severely truncated CRYBA1 polypeptides produced by the cKO construct could not fold properly or be functional (). RPE cells isolated from Cryba1 floxed (Cryba1fl/fl) miceCitation18 were used as controls in this study and express both the A3 and A1 polypeptides coded for by Cryba1; however, expression of A3 and A1 is markedly decreased in cKO RPE cells as demonstrated by western blotting (). The decrease is consistent with the fact that only 80% to 85% of RPE cells express Cre recombinase.Citation17
Figure 1. Conditional knockout of CRYBA1 in RPE cells. (A) Three-dimensional modeling, depicting structures for CRYBA1 polypeptides. The normal βA3- and βA1-crystallin polypeptides, like all β-crystallins, form homo- and heterodimers and higher oligomers with other β-crystallins. Each polypeptide is comprised of 2 similar domains, which are extended such that each domain of 1 polypeptide interacts with 1 of the domains of another β-crystallin polypeptide. At left is shown the stable homodimer as would be found in the normal lens. Each polypeptide is an extended 2-domain structure with each domain interacting with one of the domains of the second polypeptide. The center model shows a single polypeptide with the Nuc1 mutation. Nuc1 is a spontaneous mutation in the Sprague-Dawley rat in which there is a 27 base-pair insertion in exon 6 of the Cryba1 gene (see ref. Citation16). The upper domain is normal (viewed from a different perspective), the lower domain is encoded in part by exon 6 containing the mutation with the inserted sequence constituting a loop (arrow) extending from the surface of the domain. It folds improperly, preventing stable dimer formation. To the right is modeled the portion of a CRYBA1 polypeptide produced by the conditional knockout construct. Only one severely altered domain is formed, eliminating any possibility of dimer formation or normal function. (B) Loss of CRYBA1 in the cryba1 cKO RPE cells is demonstrated by western blotting with CRYBA1-specific antibody. Cryba1fl/fl RPE clearly show expression of the A3 and A1 polypeptides of CRYBA1; expression of A3 and A1 is markedly decreased in cryba1 cKO RPE cells. This is consistent with the mosaic expression of Cre recombinase by the RPE cells with only 80% to 85% of the cells being positive for the enzyme (see ref. Citation17).
Loss of CRYBA1 causes age-dependent abnormalities in the cellular architecture of RPE cells. As seen in flat mounts (), the tightly connected monolayer of pigmented cells with cuboidal morphology (arrows in Cryba1fl/fl), well-defined cell junctions, apical microvilli, and basal infoldings, characteristics of normal RPE,Citation2 is disrupted in aging cKO mice. Like the Nuc1 rat (a spontaneous mutation in the Cryba1 gene), these mice also exhibit abnormal lipid accumulation in the RPE.Citation12 We immunostained Cryba1fl/fl and cKO retinal sections with anti-PLIN2/adipophilin/perilipin 2. PLIN2, which localizes to the surface of lipid droplets, is a marker for lipid accumulation in cells.Citation21,Citation22 RPE from 12-mo old Cryba1fl/fl mice exhibited some anti-PLIN2-positive lipid droplets as a consequence of normal aging; however, staining is increased in the 12-mo old cKO RPE (, arrowheads) as evaluated immediately after staining following a previously described grading system.Citation19,Citation20
Figure 2. Age-dependent abnormalities in the RPE cells of cryba1 cKO mice. (A) RPE flatmounts from 7-mo-old Cryba1fl/fl and cKO mice were stained with DAPI for nuclei (red) and FITC-phalloidin to label the actin cytoskeleton (green). In Cryba1fl/fl RPE, cells are cuboidal and regularly arranged with cell membranes clearly defined by phalloidin staining (arrows). Cellular architecture is disordered in the cKO sample with poorly defined cell margins and weaker phalloidin staining. Bar: 50 μm. (B) Immunostaining of 12 mo old Cryba1fl/fl and cKO retinal sections with the lipid droplet marker PLIN2. PLIN2-positive lipid droplets (arrows) are present in the RPE layer of the Cryba1fl/fl retina, owing to age-related accumulation of lipids, but are much more prominent in the cKO sample. Based on an established grading system (see refs. Citation19 and Citation20), the Cryba1fl/fl scored 3 and the cKO scored 5 on a scale where 7 was maximal staining intensity. Bar: 10 µm. (C) Fundus photographs showed dark hyperpigmentation of RPE cells and subretinal lesions at the posterior pole in cKO mice by 4 mo of age. With increasing age, the lesions increased in number and were scattered throughout the fundus in cKO mice. n = 7 WT, 10 cKO mice. (D) Transmission electron microscopy of 2-mo-old cKO RPE shows many vacuole-like structures with degenerated membrane-bound cellular organelles (red arrows, center), undigested photoreceptor outer segments (red arrow, right) and loss and truncation of basal infoldings (blue asterisks), as compared with Cryba1fl/fl (left). Bar: 500 nm. (E) At 9 mo, RPE from cKO mice shows large vacuoles (blue arrows, middle image) containing partially degraded cellular debris. Interestingly, type 1 lysosomes are present in Cryba1fl/fl (green asterisks, left image), but rarely seen in cKO RPE. Moreover, loss of Cryba1 impedes lysosomal function because more melanosomes (red arrowheads) are retained in cKO, as compared with Cryba1fl/fl. The right image shows, at higher magnification, a degradative autophagic vacuole (Avd, red arrow) and a very large vacuole containing partially degraded cellular material (blue arrow) in a cKO sample. Bar: 2 μm.
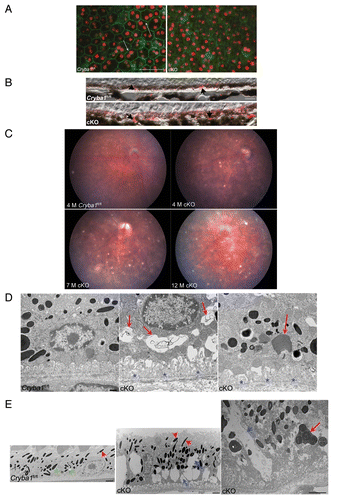
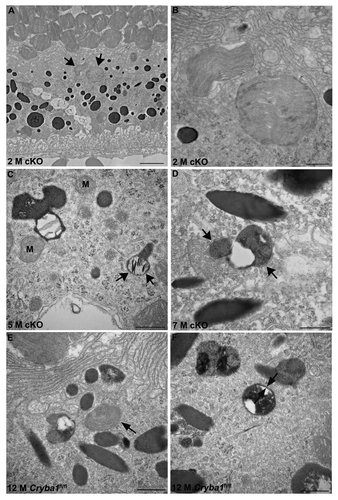
Fundus photographs of cKO mice show abnormalities in the RPE, with areas of hypo- and hyper-pigmentation and scattered lesions evident by 4 mo of age and increasing in older mice (). Morphological changes in the RPE of cKO mice were also evaluated by TEM. Mice were maintained on a 12 h light/dark cycle and euthanized 2 h after onset of light, when the shedding of OS is maximal.Citation23 TEM of 2-mo-old cKO RPE revealed many vacuole-like structures (, red arrows), some with undigested OS, as well as loss and truncation of basal infoldings (, blue asterisks). At 9 mo, larger vacuoles containing partially degraded cellular organelles (, blue arrows), as well as degradative autophagic vacuoles (red arrow) are evident. Interestingly, it has been previously shown that PLIN2-positive lipid droplets appear as vacuole-like structures by electron microscopy.Citation24 TEM also revealed a significant decrease in type 1 lysosomes (a unique type of autophagic melano-lysosome)Citation25 and an increased number of melanosomes in cKO RPE (, red arrowheads). In normal RPE, melanosomes are homogeneously dark with a circular or elliptical shape and they decrease in number with age, as type 1 lysosomes engulf and degrade them.Citation25 Our TEM data also reveals that phagosomes form in the cKO RPE and move from the apical surface of the RPE to its basal surface (, right panel, red arrow), however the contents of phagosomes are degraded less efficiently than would occur under normal physiological conditions, perhaps as a result of a defective lysosomal digestion process. (high magnification) show phagosomes enclosed in single membranes in the cKO RPE. It is also clear from our EM data that autophagosomes (exemplified by a double membrane) are present in cKO RPE, where they accumulate, due to inhibition of the proteolytic degradation by the lysosomes (, arrows). Both phagosomes and autophagosomes were evident in Cryba1fl/fl control mice as well, following starvation for 24 h (, arrows).
Figure 3. Phagosomes and autophagosomes in conditional knockout of CRYBA1 in RPE cells. (A) Transmission electron microscopy image from a 2-mo-old RPE of cryba1 cKO mouse showing phagosomes containing shed outer segment discs (arrows). Bar: 2 μm. (B) TEM showing the same phagosomes (as in A) at higher magnification to demonstrate that they are enclosed by a single membrane. Bar: 500 nm. (C) A 5-mo-old cryba1 cKO mouse RPE shows autophagosomes with double membranes (arrows). M designates mitochondria, which also have double membranes. Bar: 500 nm. (D) TEM images from RPE of a 7-mo-old cryba1 cKO mouse showing an autophagosome with double membrane (arrows). Bar: 500 nm. (E) A 12-mo-old starved Cryba1fl/fl mouse RPE shows a phagosome containing shed outer segment discs (arrow). Bar: 500 nm. (F) TEM showing an autophagosome with double membrane (arrows) in a 12-mo-old Cryba1fl/fl mouse following starvation. Bar: 500 nm.
Loss of Cryba1 affects lysosomal acidification by regulating V-ATPase
Based on evidence from our EM studies it appears that lysosomal-mediated clearance is inhibited in the RPE of cryba1 cKO mice. We have previously reported that CRYBA1 is localized to lysosomes in RPE.Citation12 In order to localize CRYBA1 to a subcompartment within the lysosome, we isolated the lysosomal fraction from cultured primary RPE cells on a discontinuous sucrose gradient and then separated the lysosomal lumen and membrane fractions. In order to test the purity of the fractions, we measured the HEXA (hexosaminidase A, α subunit) activity in the cellular homogenate, post-nuclear supernatant, crude organelle fraction, lysosomal lumen, and lysosomal membrane. Our results show maximal enzymatic activity for HEXA, an essential enzyme of the lysosomal lumen, in the lumenal fraction, demonstrating the purity of the extracts (). We also performed immunoblotting to determine the localization of CRYBA1 in the subcellular fractions. Our results show that CRYBA1 is concentrated in the lysosomal lumen (fraction 1) in the Cryba1fl/fl RPE cells, with only a trace in the membrane (fraction 2). Confirmation of this distribution was shown by localization of HEXA to the lumen (fraction 1) and LAMP1 (a lysosomal membrane protein) to fraction 2 ().
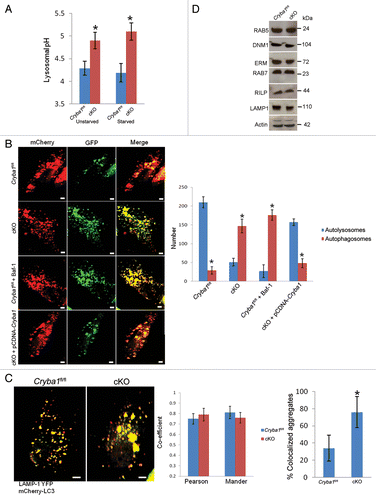
Figure 4. Loss of Cryba1 affects lysosomal acidification. (A) Subcellular fractionation as assessed by measuring the activity of HEXA, a lysosomal lumenal enzyme. The purification factor is calculated from the ratio of the specific activities by normalizing the specific activity of the post-nuclear supernatant (PNS) to 1. (B) Western blotting of lysosomal fractions showed CRYBA1 to be in the lysosomal lumen fraction (fraction 1), with minimal immunostaining in the lysosomal membrane fraction (fraction 2). LAMP1 and HEXA indicate the purity of the fractions. (C) Lysosomal pH in cultured primary RPE cells from Cryba1fl/fl mice was ~4.5, while in cKO cells it was ~5.2. The lysosomal pH was not significantly changed when cells were starved (St) to induce autophagy. (D) Overexpression of CRYBA1 in cKO cells reduced lysosomal pH to the normal value of 4.5, while empty vector had no effect. Graphs (C and D) show mean values and error bars represent s.d. from a triplicate experiment, representative of at least 3 independent experiments. Statistical analysis was performed by a 2-tailed Student t test: *P < 0.05.
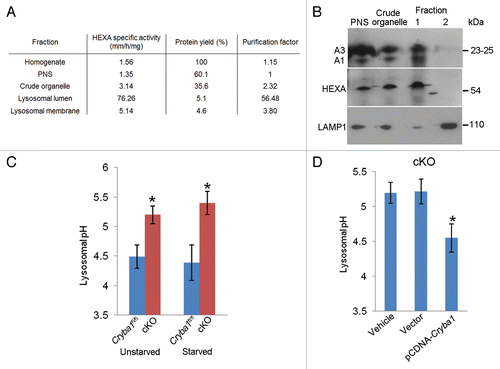
Lysosomes are essential components of various degradative pathways, including phagocytosis and autophagy.Citation26 While phagocytosis degrades components from the extracellular milieu (heterophagy);Citation5 autophagy degrades intracellular components.Citation4 In each case, the degradation is dependent upon the acidic environment of the lysosomal lumen.Citation26 We next asked whether CRYBA1 was required for proper acidification of the RPE endolysosomal system. In primary RPE cells cultured from Cryba1 cKO mice, endolysosomal pH was found to be ~0.7 pH units higher than in WT cells. This was true both for cells in normal medium and for starved cells (). Overexpression of CRYBA1 in the cKO cells restored pH to nearly normal levels ().
Because V-ATPase acidifies endolysosomal compartments,Citation8,Citation27 with pH decreasing along the pathway and culminating at ~pH 4.5 in the lysosome, where digestion takes place, we sought to determine whether V-ATPase activity is compromised in the RPE of cKO mice. demonstrates reduced V-ATPase activity in the RPE from cKO mice and shows that this activity was rescued by CRYBA1 overexpression, suggesting that loss of CRYBA1 impairs acidification of the endolysosomal compartments by decreasing V-ATPase activity.
Figure 5. V-ATPase is regulated by CRYBA1 in RPE cells. (A) Left panel: V-ATPase activity in isolated lysosomes from Cryba1fl/fl RPE cells is about twice that of cKO cells. Bafilomycin A1 (Baf-1) reduced activity markedly in both cell types. Right panel: Overexpression of CRYBA1 in cultured RPE cells from cKO mice restored lysosomal V-ATPase activity to near normal level. The point of addition of ATP (1.4 μM final concentration) to activate the enzyme is indicated. Each point represents the average of 3 determinations; error bars represent mean ± s.d. (B) Coimmunoprecipitation of lysosomal lumen and membrane extracts from Cryba1fl/fl cells with CRYBA1 antibody and immunoblotting with V0-ATPase ATP6V0A1 antibody, demonstrating pulldown of V0-ATPase ATP6V0A1 by the crystallin antibody. Nonspecific IgG was used as negative control. (C) Hypothetical complex of open conformer of CRYBA3 and the V-ATPase monomer obtained by Hex Protein Docking is shown. Molecular surface of CRYBA3 is shown in green. The V-ATPase monomer is shown as a ribbon model where α-helical and β-sheet structures are shown by red arrows and blue cylinders, respectively.
We next investigated possible mechanisms whereby CRYBA1 could modulate lysosomal V-ATPase in RPE cells. In a pulldown (coimmunoprecipitation) assay, polyclonal antibody to CRYBA1 precipitated V0-ATPase ATP6V0A1 from Cryba1fl/fl RPE cells (), but not from cKO RPE (Fig. S1), suggesting that CRYBA1 interacts directly with the V0-ATPase ATP6V0A1 subunit. By binding to V0-ATPase ATP6V0A1, CRYBA1 may modulate the ratio of V1/V0 in the lysosomes of RPE cells, a factor thought to regulate the level of acidification.Citation27,Citation28 Furthermore, computer modeling suggests that CRYBA1 and V-ATPase may interact, with formation of a hypothetical complex ().
Autophagy is decreased in RPE lacking Cryba1
In view of the obvious abnormalities in the morphology and V-ATPase-mediated lysosomal acidification of the cKO RPE, we investigated further the status of autophagy in the RPE of cKO mice. Previously, we have shown that CRYBA1 is required in the phagocytosis process in the RPE and may also be required during autophagy.Citation12 Phagocytosis and autophagy occur continuously in RPE cells, generating phagosomes and autophagosomes, respectively, each of which fuses with endolysosomes, producing a mixture of degradative products for final clearance. Lysosomal acidification is necessary for fusion of (auto) phagosomes to lysosomes. Further, lysosomal hydrolases require an acidic pH for optimal activity.Citation29 Our data show a difference in lysosomal pH in fresh RPE (tissue taken immediately after euthanization) isolated from Cryba1fl/fl and cKO mice, both before and after autophagy induction in vivo (). Since CRYBA1 appears to be involved in regulation of endolysosomal acidification,Citation18 we asked whether the higher pH of the lysosomes in the RPE of cKO mice affects fusion (between autophagosome and lysosome), degradation of autolysosome contents, or both. To address this question, we first transfected primary cultures of RPE cells isolated from Cryba1fl/fl or cKO mice with tandem mCherry-GFP-LC3, a pH-sensitive reporter construct.Citation30 LC3 is the marker generally used to assess autophagy.Citation31 In this assay, mCherry fluorescence is stable in the acidic endolysosome compartments, whereas GFP fluorescence is rapidly quenched. Live-cell imaging () showed mostly red puncta in the Cryba1fl/fl cells (autolysosomes), with some yellow puncta (autophagosomes). When Cryba1fl/fl cells were pretreated with bafilomycin A1 (an inhibitor of the V-ATPase) to inhibit lysosomal acidification, the number of yellow puncta increased, indicating failure of normal processing of autophagosomes. When cKO cells were imaged, we found predominantly yellow puncta, indicative of accumulation of autophagosomes; however, when CRYBA1 was overexpressed in these cells, the yellow puncta decreased and red puncta predominated, indicating recovery of normal processing of autophagosomes.
Figure 6. Loss of Cryba1 affects lysosome-mediated autophagic clearance in RPE. (A) Lysosomal pH was increased in RPE/choroid preparations from cKO relative to Cryba1fl/fl mice, with or without starvation-induced autophagy. (B) Single-frame images from live-cell imaging to visualize autophagosomes as yellow puncta (since both fluorophores fluoresce at cytoplasmic pH) and autolysosomes as red puncta (because GFP is quenched by the low pH of lysosomes) using the pH-sensitive reporter mcherry-GFP-LC3. In Cryba1fl/fl, most puncta were red indicating the fusion of autophagosome with lysosome, as expected. In cKO, most puncta were yellow suggesting that either fusion is inhibited or that fusion occurs but endolysosomal pH is too high to quench GFP fluorescence. The pattern seen in the cKO cells is similar to that seen in Cryba1fl/fl cells treated with bafilomycin A1 (Baf-1). Overexpression of CRYBA1 in the cKO cells (bottom panels) rescued the phenotype to that of Cryba1fl/fl. The numbers of autophagosomes and autolysosomes were quantified from at least 50 images per group per experiment. The histogram gives number of autophagosomes and autolysosomes for each of the 4 cells depicted. Bar: 20 μm. (C) Cryba1fl/fl and cKO cells transfected with both mCherry-LC3 to label autophagosomes and LAMP1-YFP to label lysosomes. Yellow fluorescence indicates fusion of the autophagosome and the lysosome. The extent of colocalization of LAMP1-YFP and mCherry-LC3 was determined by calculating the Pearson correlation coefficient and Mander overlap coefficient from 20 independent fields of cells in 3 different experiments. The colocalization coefficients (Pearson and Mander) were not significantly different in the Cryba1fl/fl and cKO cells. Percentage of LAMP1-YFP and mCherry-GFP colocalized aggregates was measured by using the ImageJ software. Colocalized aggregates were more numerous in cKO. Bar: 20 μm. (D) In autophagy-induced Cryba1fl/fl and cKO RPE cells, levels of the proteins involved in both the early maturation process (DNM1, RAB5 GTPase, and the EZR/Ezrin, RDX/Radixin and MSN/Moesin [ERM family of proteins]) and the later stages of maturation (RAB7 GTPase, RILP [Rab-interacting lysosomal protein], and LAMP1 [lysosomal-associated membrane protein 1]) are unaffected by loss of CRYBA1. In panels (A–C), graphs show mean values and error bars represent s.d. from a triplicate experiment, representative of at least 3 independent experiments. Statistical analysis was performed by a 2-tailed Student t test: *P < 0.05.
![Figure 6. Loss of Cryba1 affects lysosome-mediated autophagic clearance in RPE. (A) Lysosomal pH was increased in RPE/choroid preparations from cKO relative to Cryba1fl/fl mice, with or without starvation-induced autophagy. (B) Single-frame images from live-cell imaging to visualize autophagosomes as yellow puncta (since both fluorophores fluoresce at cytoplasmic pH) and autolysosomes as red puncta (because GFP is quenched by the low pH of lysosomes) using the pH-sensitive reporter mcherry-GFP-LC3. In Cryba1fl/fl, most puncta were red indicating the fusion of autophagosome with lysosome, as expected. In cKO, most puncta were yellow suggesting that either fusion is inhibited or that fusion occurs but endolysosomal pH is too high to quench GFP fluorescence. The pattern seen in the cKO cells is similar to that seen in Cryba1fl/fl cells treated with bafilomycin A1 (Baf-1). Overexpression of CRYBA1 in the cKO cells (bottom panels) rescued the phenotype to that of Cryba1fl/fl. The numbers of autophagosomes and autolysosomes were quantified from at least 50 images per group per experiment. The histogram gives number of autophagosomes and autolysosomes for each of the 4 cells depicted. Bar: 20 μm. (C) Cryba1fl/fl and cKO cells transfected with both mCherry-LC3 to label autophagosomes and LAMP1-YFP to label lysosomes. Yellow fluorescence indicates fusion of the autophagosome and the lysosome. The extent of colocalization of LAMP1-YFP and mCherry-LC3 was determined by calculating the Pearson correlation coefficient and Mander overlap coefficient from 20 independent fields of cells in 3 different experiments. The colocalization coefficients (Pearson and Mander) were not significantly different in the Cryba1fl/fl and cKO cells. Percentage of LAMP1-YFP and mCherry-GFP colocalized aggregates was measured by using the ImageJ software. Colocalized aggregates were more numerous in cKO. Bar: 20 μm. (D) In autophagy-induced Cryba1fl/fl and cKO RPE cells, levels of the proteins involved in both the early maturation process (DNM1, RAB5 GTPase, and the EZR/Ezrin, RDX/Radixin and MSN/Moesin [ERM family of proteins]) and the later stages of maturation (RAB7 GTPase, RILP [Rab-interacting lysosomal protein], and LAMP1 [lysosomal-associated membrane protein 1]) are unaffected by loss of CRYBA1. In panels (A–C), graphs show mean values and error bars represent s.d. from a triplicate experiment, representative of at least 3 independent experiments. Statistical analysis was performed by a 2-tailed Student t test: *P < 0.05.](/cms/asset/18bffab9-aec8-4dfb-8d6a-2c6e34509d66/kaup_a_10927292_f0006.gif)
To determine if loss of CRYBA1 specifically affects fusion between autophagosomes and lysosomes, we transfected cells with mCherry-LC3B to label autophagosomes (red), and LAMP1-YFP to label lysosomes (green), and performed live-cell imaging after inducing autophagy. Previously, it has been shown that V0-ATPase ATP6V0A1 subunit mediates the fusion between phagosomes and lysosomes in the brain during phagocytosis.Citation32 The fusion to form autolysosomes, as indicated by increase in yellow puncta (since both fluorophores fluoresce at cytoplasmic pH), was similar in both Cryba1fl/fl and cKO RPE (). Colocalization coefficients (Pearson correlation coefficient and Mander overlap coefficient) were not significantly different between the two groups, but there was an increase in the number of colocalized aggregates in the cKO cells. This suggests that accumulation and aggregation of autophagosomes and autolysosomes occurs in cKO RPE due to inefficient degradation of the cargo. Our TEM studies also show accumulation of autophagosomes in unstarved cKO RPE cells (). Consistent with this, the cellular levels of proteins involved in the fusion process were unaffected by loss of CRYBA1 ().
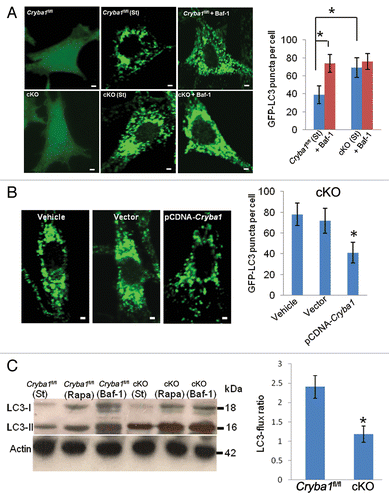
In view of the obvious abnormalities in V-ATPase-mediated lysosomal acidification of the cKO RPE, we investigated further the status of autophagy in the RPE of cKO mice using bafilomycin A1 to inhibit V-ATPase. At concentrations above 10 nM, bafilomycin A1 completely inhibits V-ATPase activity; between 0.3 and 10 nM it reduces V-ATPase activity to 10 to 40% of normal.Citation33,Citation34 Under normal physiological conditions, both Cryba1fl/fl and cKO RPE cells transfected with GFP-LC3 showed a uniform cytoplasmic distribution of GFP-LC3 (). However, upon starvation the cKO cells showed a significant increase in GFP-LC3 puncta formation; this was similar to Cryba1fl/fl RPE cells following treatment with bafilomycin A1 (). This increase in GFP-LC3-positive puncta in cKO RPE cells decreased to Cryba1fl/fl levels following overexpression of CRYBA1 (). To assess the effect of loss of CRYBA1 on autophagy as a dynamic process, autophagy flux was determined from LC3-II levels.Citation35 When autophagosomes are formed, the soluble form of LC3 (LC3-I) is conjugated with phosphatidylethanolamine and localizes to the autophagosome membrane. This form, called LC3-II, is the best indicator of autophagy activity.Citation35 In a recent study of RPE cells,Citation36 LC3 has also been shown to be associated with single-membrane phagosomes containing engulfed photoreceptor outer segments. As shown in , after 12 h of starvation, LC3-II increases in Cryba1fl/fl cells, and to a greater extent in cKO cells in culture, that were not undergoing phagocytosis. Exposure to rapamycin (12 h, 20 nM), which stimulates autophagy, markedly increased LC3-II levels, again to a greater extent in cKO cells. Twelve hours exposure to bafilomycin A1, which blocks autophagosome degradation, strongly increased levels of LC3-II in both cell types. As seen in the histogram, LC3-II flux in the cKO cells was just half the normal rate. Moreover, we observed increased accumulation of SQSTM1/p62 in cKO cells relative to Cryba1fl/fl cells after autophagy induction (Fig. S2). SQSTM1 is known to accumulate when autophagy is inhibited and is also used as a marker to study autophagic flux.Citation37,Citation38 Therefore, our data indicate that loss of CRYBA1 does not affect autophagosome biogenesis; however, the normal clearance of autophagosomes is compromised.
Figure 7. Decreased autophagy in RPE deficient in Cryba1. (A) Cryba1fl/fl and cKO cells were transfected with GFP-LC3. GFP-LC3 was uniformly distributed in both cell types (left panels). Following autophagy induction (St), GFP fluorescence appeared as punctate spots representing autophagosomes and autolysosomes, which were more dense in the cKO cells than in Cryba1fl/fl. Bafilomycin A1 (Baf-1, right panels) increased puncta density in Cryba1fl/fl, but had no obvious effect in the cKO cells. The histogram demonstrates a statistically significant increase in puncta in Cryba1fl/fl following treatment with bafilomycin A1, but no such increase in cKO cells. After autophagy induction, cKO cells had about twice as many puncta as Cryba1fl/fl cells. Bar: 30 μm. (B) GFP-LC3-positive puncta were significantly diminished in the cKO cells when CRYBA1 was overexpressed. Empty vector had no effect. Bar: 30 μm. (C) Level of LC3-II is increased to greater extent by 12 h of starvation (st) in cKO cells than in Cryba1fl/fl. Exposure to 20 nM rapamycin (Rapa) for 12 h also increased LC3-II levels, especially in the cKO cells. Bafilomycin A1 markedly increased LC3-II in both cell types. The histogram shows that the LC3-flux ratio (speed of autophagy) is decreased by ~50% in cKO cells. In all panels, graphs show mean values and error bars represent s.d. from a triplicate experiment, representative of at least 3 independent experiments. For the quantification of GFP-LC3 puncta, at least 100 cells per group were counted and the percentage of GFP-LC3 puncta as shown are the mean ± s.d. of 3 individual experiments (in A and B). Statistical analysis was performed by a 2-tailed Student t test: *P < 0.05.
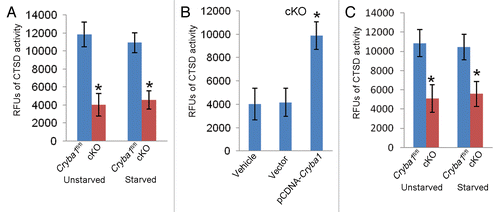
Thus, lysosome-mediated degradation is compromised in RPE cells from cKO mice, resulting in the accumulation of autophagosomes and autolysosomes. This is consistent with the observed decrease in CTSD activity in RPE of cKO mice (). CTSD is a lysosomal aspartic proteinase and the major enzyme involved in digestion of rhodopsin in shed OS.Citation39 CTSD is also involved in autophagic degradation.Citation40 Overexpression of CRYBA1 in RPE cells from cKO mice restored normal activity (). Further, a similar difference in CTSD activity was found in freshly isolated RPE tissue from Cryba1fl/fl and cKO mice ().
Figure 8. Decreased CTSD activity in RPE deficient of Cryba1. (A) CTSD activity in primary cultures of RPE cells from cKO mice was only about a third of normal. Starvation (St) to induce autophagy had no effect. (B) Overexpression of CRYBA1 in the cKO cells restored CTSD activity to the normal range. (C) CTSD activity was decreased by about 50% in freshly isolated RPE/choroid preparations from cKO mice as compared with Cryba1fl/fl samples. Activity was not significantly affected by induction of autophagy in vivo. Graphs show mean values and error bars represent s.d. from a triplicate experiment representative of at least 3 independent experiments. Statistical analysis was performed by a 2-tailed Student t test: *P < 0.05.
Cryba1 regulates MTORC1 signaling
These data, and recent work on astrocytes,Citation18 suggest that CRYBA1 directly affects lysosomal V-ATPase activity. In an elegant study, the V-ATPase has been shown to play a direct role in amino acid signaling to MTORC1 and to be a component of the MTOR pathway in lysosomes.Citation14 Previous studies have also shown the existence of bidirectional regulatory loops between MTORC1 and V-ATPase.Citation13 Lumenal pH is involved in MTORC1 regulation and has important implications for its ability to control autophagy.Citation41 We have previously shown that CRYBA1 can regulate cell survival through signaling by PI3K-AKT-MTOR and MAPK1/ERK2-MAPK3/ERK1 signaling.Citation42
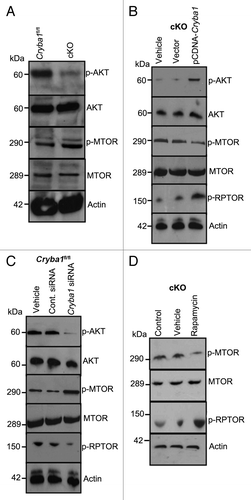
In RPE isolated from cKO mice following autophagy induction in vivo, phospho-AKT is decreased while phospho-MTOR is increased (relative to RPE from Cryba1fl/fl mice), consistent with inhibition of autophagy (). In primary cultures of RPE cells from cKO mice, the level of phospho-AKT was rescued by overexpressing CRYBA1; concomitantly, phospho-MTOR was decreased, stimulating autophagy (). Our data also shows that phosphorylation of RPTOR, a regulatory subunit of the MTORC1Citation14 is upregulated in cKO cells overexpressing CRYBA1, suggesting an inhibition of MTORC1. Additionally, downregulation of CRYBA1 in cultured Cryba1fl/fl RPE cells using a specific siRNA, following starvation-induced autophagy, also caused phospho-AKT, and phospho-RPTOR to decrease, while phospho-MTOR was increased (). Finally, treatment with rapamycin (an inhibitor of MTOR) activated autophagy in RPE from cKO mice, as indicated by a decrease in phospho-MTOR and an increase in phospho-RPTOR (). Therefore, crosstalk between the V-ATPase and MTORC1 is necessary for regulating autophagy, and CRYBA1 is required for proper functioning of this signaling axis.
Figure 9.Cryba1 regulates the MTORC1 signaling pathway. (A) Following induction of autophagy in vivo by starvation, RPE/choroid was isolated and levels of signaling intermediates determined. In the cKO samples p-AKT was decreased compared with Cryba1fl/fl, while p-MTOR was increased. Total AKT and total MTOR were not changed. (B) In starved RPE cells cultured from cKO mice, overexpression of CRYBA1 increased p-AKT and p-RPTOR expression, while p-MTOR decreased. (C) Conversely, downregulation of βA3/A1- crystallin expression in Cryba1fl/fl cells using siRNA, decreased p-AKT, and p-RPTOR while p-MTOR was upregulated. (D) Rapamycin, an inhibitor of MTOR, was effective at decreasing p-MTOR and increasing p-RPTOR levels in the cKO cells.
Dysregulation of lysosomal function in the RPE of cKO mice affects cellular homeostasis
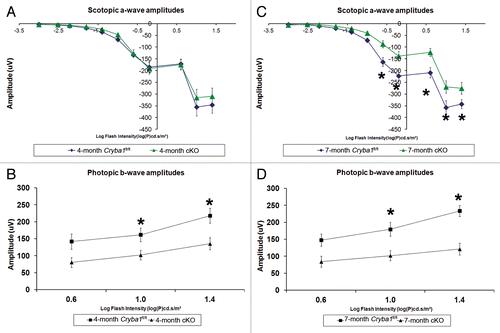
Finally, we asked if the defect in lysosomal-mediated clearance in the RPE of cryba1 cKO mice compromised retinal function. Electroretinography (ERG) revealed impaired retinal function that increased over time in cKO mice. At 4 mo, cKO mice and Cryba1fl/fl mice showed no significant difference in scotopic a-wave amplitudes at any stimulus intensity, suggesting that rod photoreceptor function was still intact (). But cKO mice showed a significant reduction in photopic b-wave amplitudes at the 2 highest stimulus intensities, indicating cone photoreceptor dysfunction (). At 7 mo of age, cKO mice showed significant reductions in both scotopic a-wave and photopic b-wave amplitudes indicating dysfunction in both rod and cone photoreceptors (). Since cones constitute only 2% of the photoreceptor population in mice, gradual loss of both rods and cones would result in a greater percentage loss of cones than rods at early time points and hence loss of cone function would be identifiable prior to rod dysfunction, as reported here.
Figure 10. Decreased lysosomal clearance leads to loss of cellular homeostasis in RPE of cryba1 cKO mice. (A) Scotopic ERGs from eyes of 4-mo-old cryba1 cKO mice showed similar a-wave amplitudes as those in Cryba1fl/fl mice (n = 10 for each group), indicating that rod photoreceptor function was not affected. (B) Photopic ERGs of cKO mice from the same age (4 mo) showed smaller b-wave amplitudes in comparison to Cryba1fl/fl mice (n = 10 for each group), indicating reduced cone photoreceptor function (*P ≤ 0.018 by ANOVA with Dunnett correction for multiple comparisons). (C) Scotopic ERGs from 7-mo-old cKO mice showed decreased a-wave amplitudes when compared with Cryba1fl/fl mice (n = 10 for each group), demonstrating that rod photoreceptor function was reduced significantly (*P ≤ 0.0002 by ANOVA with Dunnett correction for multiple comparisons). (D) Photopic ERGs from these 7-mo-old cKO mice also showed further decrease in b-wave amplitudes compared with Cryba1fl/fl mice (n = 10 for each group), indicating the cone function had been reduced (*P ≤ 0.0001 by ANOVA with Dunnett correction for multiple comparisons).
Discussion
Lysosomes are dynamic organelles that degrade endocytic, autophagic, and phagocytic cargo. CRYBA1 is a novel lysosomal component in the RPE that appears to be required for normal autophagy and phagocytosis, processes that require the lysosomal-mediated removal of waste products. The RPE has many physiological functions critical to retinal homeostasis. Phagocytosis and autophagy are 2 of its most important functions; however, both processes are poorly understood in the RPE. The RPE phagocytoses 10% of total photoreceptor volume every day.Citation3 In addition to this phagocytic activity, RPE cells are post-mitotic with high metabolic demands. This suggests that autophagy, the process whereby cells degrade and recycle intracellular components in normal cellular remodeling, is also likely to function at a high rate. Thus, autophagy and phagocytosis must both be in balance in RPE cells. Both autophagy and phagocytosis are dynamic, multistep processes that can be modulated at several points. For example, in the Atg5-deficient RPE cells,Citation36 the initial 2 stages of phagocytosis, namely engulfment and internalization, are not affected; however, the phagosomes fail to move from the apical surface of the RPE to its basal surface and, most importantly, phagosome maturation as well as phagosome-lysosome fusion is defective, ultimately preventing degradation. Their study shows that phagocytosis and the visual cycle are linked through a noncanonical autophagy process. In contrast, CRYBA1 has no apparent role in recognition, ingestion, maturation of the phagosomes, or fusion of phagosomes to lysosomes during RPE phagocytosis as we have now shown in 2 independent genetic models, previously in the Nuc1 rat modelCitation12 and here in the Cryba1 cKO mice. In addition, here we show that CRYBA1 is also involved in autophagy in RPE cells, not affecting autophagosome biogenesis or fusion with lysosomes, but rather the terminal degradative stage of the process.
The data reported in this study, and our recent work on astrocytes,Citation18 suggest that CRYBA1 affects V-ATPase activity and, thereby, acidification of endolysosomal compartments. That V-ATPase can regulate the activation of MTORC1 in response to lysosomal amino acids has been demonstrated both in D. melanogaster and mammalian cells.Citation14 All essential amino acids are found to be concentrated within lysosomes.Citation43 The translocation of MTORC1 to the lysosomes is regulated by the multiprotein complex, Ragulator, which is an amino acid-regulated docking site for MTORC1 on lysosomes.Citation26 In the lysosomes, MTORC1 phosphorylates downstream effectors leading to modulation of cell metabolism and inhibition of autophagy.Citation44 Therefore, by establishing proton gradients in the lysosomes of RPE cells, V-ATPase not only maintains normal acidic pH, but also allows amino acid signaling to MTORC1. In an elegant study, MTORC1 was shown to regulate V-ATPase expression, both in cells in culture and in mice, in vivo.Citation13 In vivo, V-ATPase activity is regulated by several mechanisms, including reversible dissociation of the V1 and V0 domains.Citation9 We therefore speculate that binding of CRYBA1 to V0-ATPase ATP6V0A1 regulates H+-pumping activity by assembly/disassembly of the holoenzyme. Interestingly, PSEN1 (presenilin 1), a protein that is often mutated in Alzheimer disease, is required for the ATP6V0A1 subunit of V-ATPase to be translocated to lysosomes.Citation45 MTORC1 is also known to indirectly regulate autophagy by controlling lysosomal biogenesis.Citation46 Collectively, our findings suggest that CRYBA1 is upstream of the MTORC1 signaling pathway that is modulated by V-ATPase, presumably at the lysosome.
Mutations in VMA21 (vacuolar H+-ATPase homolog [S. cerevisiae]) cause X-linked myopathy with excessive autophagy (XMEA), a childhood onset disease characterized by progressive vacuolation and atrophy of skeletal muscle resulting from an autophagy defect associated with decreased V-ATPase activity (10% to 30% of normal) and elevated lysosomal pH (from 4.7 to 5.2).Citation47 Previously, it has been shown that chloroquine and siramesine accumulate in lysosomes, raising lysosomal pH, blocking autophagy, and leading to MTORC1 inactivation-dependent macroautophagy and autophagic vacuolation, as seen in XMEA patients.Citation48,Citation49 These models are similar to our cKO mice, in inhibiting V-ATPase, raising lysosomal pH, and inhibiting autophagy, but have the opposite effect on MTORC1 activity. Therefore, our data suggest that CRYBA1 in the lysosomes of RPE may regulate MTORC1 through multiple pathways. MTORC1 is a kinase that regulates the cellular response to amino acids, growth factors, and changing energy levels within the cell.Citation46 We have previously shown that in astrocytes, CRYBA1 can regulate MTOR signaling by modulating IGF2 (insulin-like growth factor 2 [somatomedin A]).Citation42 A recent report indicates that insulin-dependent MTORC1 activation requires the presence of amino acids, and an intact lysosome-associated Ragulator complex.Citation44,Citation50 Our findings also suggest that CRYBA1 may participate in autophagic lysosome reformation, an MTORC1-dependent process whereby prolonged starvation (over 6 h) induces MTORC1 activation and formation of tubular structures on autolysosomal membranes that pinch off to yield protolysosomes.Citation51 Protolysosomes permit recycling of lysosomal membranes, but not autolysosomal contents.Citation51 An elegant study has demonstrated that lysosomal positioning within the cell also regulates MTORC1 signaling.Citation41 Taken together, the data indicate that CRYBA1 is a crucial regulator of RPE cell homeostasis and probably a link between lysosomes and MTORC1.
Lysosomal dysfunction may result from abnormal functioning of any of the myriad of proteins required for maintaining lysosomal homeostasis; in each case the disease phenotype and tissue(s) affected can be different. For example, deficiency in LAMP2, a lysosomal membrane protein, causes Danon disease,Citation52 while XMEA results from loss of V-ATPase activity.Citation47 Both diseases exhibit vacuolar myopathy, however the pathway leading to degradative autophagy is completely different.Citation53 Moreover, prolonged exposure to chloroquine, clinically affects only skeletal muscle and retina, despite the fact that lysosomes of all tissues accumulate the drug.Citation48,Citation54 Therefore, the mechanisms by which CRYBA1 affects lysosomal function in RPE may be unique.
In neurodegenerative diseases of the brain, such as Alzheimer and Parkinson diseases, a number of studies suggest that defective lysosomal clearance is involved in the disease pathogenesis.Citation55-Citation57 The autophagy-lysosomal degradation pathway has been shown to decline with age in the human brain;Citation58 this decline may play a role in the onset and progression of neurodegenerative diseases.Citation16,Citation59-Citation61 Since both phagocytosis and autophagy are dependent on proper lysosomal function, agents that disrupt lysosomal function may be causal and/or contributory to clinical onset and progression of retinal degenerative diseases. In cryba1 cKO mice, loss of CRYBA1 leads to lysosomal instability and phagocytosis/autophagy insufficiency, changes that probably occur at the early stage of disease and these cellular abnormalities are likely a risk factor for pathogenic events seen in several retinal degenerative diseases.
In summary, our data indicate that in the lysosomes of RPE cells, CRYBA1 interacts with V0-ATPase ATP6V0A1, a subunit of the proton pump (V-ATPase) that acidifies the lysosomal machinery. Based on our findings, we postulate that loss of CRYBA1 inhibits V-ATPase activity, leading to increased lysosomal pH, thereby hindering both autophagy and phagocytosis in the RPE of cKO mice. This study suggests a novel role for CRYBA1 in lysosomal-mediated clearance in RPE.
Materials and Methods
Molecular modeling
The homology model of the dimeric rat CRYBA3/βA3-crystallin was built using the crystal coordinates of the bovine βB2-crystallin (RCSB file: 1blb.pdb) as the structural template, as previously described.Citation62
The possible interaction between CRYBA3 and the V-ATPase monomer was tested using an interactive protein docking and molecular superposition program Hex Protein Docking, version 6.3 (http://hex.loria.fr/manual63/hex_manual.pdf).Citation63 The structure of V-ATPase (residues 19 to 363) was generated using a Swiss-model server (www.swissmodel.expasy.org) and the cytoplasmic N-terminal domain of subunit I, homolog of subunit a, of V-ATPase (PDB file: 3rrk_A) as the structural template. Structure of CRYBA3 as an open conformer was modeled as previously described.Citation64,Citation65
Conditional knockout mice
CRYBA1 floxed homozygous mice (Cryba1fl/fl) were generated as described previously.Citation18 Cryba1 floxed mice were mated with Best1-cre miceCitation17 that express Cre recombinase specifically in RPE. Offspring that were determined to be cKO/+ and Cre+ were subsequently mated together to produce the F2 generation. PCR analysis identified F2 progeny homozygous for the knockout allele. These cKO/cKO mice were subsequently analyzed for presence of Cre. Animals both cKO/cKO and Cre+ were mated to produce the F3 and subsequent generations. The floxed mice were originally bred into the C57BL/6N strain which carries the rd8 mutation, but this retinal degeneration mutation was bred out of the colony before this study was conducted. All animal studies were conducted in accordance with the Guide for the Care and Use of Animals (National Academy Press) and were approved by the Animal Care and Use Committee of Johns Hopkins University.
Isolation and culture of mouse primary RPE cells
Mouse RPE cells were isolated as previously described.Citation66 Eyes were removed from 4- wk-old mice, washed twice in 5 ml DMEM containing high glucose, then incubated with 5 ml 2% (wt/vol) Dispase (Roche, 10269638001), in DMEM for 45 min at 37 °C. They were then washed twice in growth medium consisting of DMEM (high glucose) plus 10% FCS, 1% penicillin/streptomycin, 2.5 mM L-glutamine, and 1× MEM nonessential amino acids (Gibco, Invitrogen, 11095). After an incision was made around the ora serrata of each eye, the anterior segment was removed. The resulting posterior eyecups were incubated in growth medium for 20 min at 37 °C to facilitate separation of the neural retina from the RPE. After removal of the neural retina, intact sheets of RPE cells were peeled off the underlying basement membrane (Bruch’s membrane) and transferred into a sterile 60-mm culture dish, containing 5 ml of fresh growth medium. The sheets of RPE were washed 3 times with growth medium and twice with Ca2+- and Mg2+-free Hanks’ balanced salt solution and then briefly triturated by using a fine point Pasteur pipette. RPE cells were sedimented by centrifugation at 200 g for 5 min and cultured in growth medium.
Plasmids and transfection
Primary RPE cells were transfected with X-tremeGENE transfection reagent (Roche, 06366244001) following the manufacturer’s instructions.
RPE flatmounts and immunofluorescence
The anterior chamber was carefully removed from freshly enucleated eyes and the posterior eye cup was then fixed in 4% paraformaldehyde (Polysciences, Inc., 00380) for 2 h at 4 °C. After the retina was removed, the sample was transferred to phosphate-buffered saline (Life Technologies, 10010, pH 7.4, Ca2+- and Mg2+-free) and cut radially into 4 to 6 pieces from the optic nerve head to the periphery. After carefully peeling away the sclera, the RPE-Bruch’s membrane-choroid complex was mounted on a microscope slide with RPE on top. Immunofluorescence was performed as described previously.Citation12
Electron microscopy
Samples were prepared and transmission electron microscopy was performed as described.Citation12
Fundus photography
Fundus photographs were obtained from anesthetized WT and cKO mice using the Micron III Laser Scanning Ophthalmoscope (Phoenix Research Lab, Inc) as previously described.Citation67
Antibodies and reagents
The following antibodies were used in this study: LC3 (1:1000) (PM036, MBL International), actin (1:2500) (A2066, Sigma Aldrich), LAMP1 (1:2000) (H4A3, Developmental studies hybridoma bank, developed by August, J.T./Hildreth, J.E.K. obtained under the auspices of the NICHD and maintained by The University of Iowa, Department of Biology, Iowa City, IA). The signaling pathway antibodies were purchased from Cell Signaling Technology unless otherwise stated: phospho-AKT (1:100) (9271), AKT (1:1000) (9272), phospho-MTOR (1:500) (2974), phospho-RPTOR (1:500) (2083), MTOR (1:1000) (2983), RAB5 (1:1000) (3547S), ERM (1:1000) (3142S), cleaved caspase-3 (1:100) (9664), SQSTM1 (1:500) (MABC32, EMD Millipore), DNM1/dynamin-1(1:1000) (SAB450066, Sigma Aldrich), RAB7 (1:1000) (ab50533, Abcam), RILP (1:500) (ab54559, Abcam), ATP6V0A1 (1:500) (ab105937, Abcam), PLIN2/adipophilin (1:500–1:1000) (GP40, Progen). The antibody to CRYBA1 has been described previously (1:1000).Citation12 FITC-phalloidin was obtained from Molecular Probes-Invitrogen (F432). Rapamycin (R8781) and bafilomycin A1 (B1793) were purchased from Sigma.
Autophagy induction
Autophagy was induced in Cryba1fl/fl and cKO mice by withholding food for 24 h, but with no restriction on water availability. At the end of the 24 h period, mice were euthanized using CO2 gas and eyes were immediately enucleated. RPE/choroid preparations were dissected and protein extracted as previously described.Citation12
To induce autophagy in vitro, primary cultures of RPE cells from Cryba1fl/fl and cKO mice were maintained in growth medium lacking serum and amino acids for 8 to 12 h. The cells were then harvested and extracts prepared as required.
Measurement of endolysosomal pH
The lumenal pH of endolysosomal vesicles was measured by a dual excitation ratiometric method using a fluid phase fluorescent marker, fluorescein isothiocyanate (FITC)-conjugated dextran (Invitrogen, D34682), as previously described.Citation18
Lysosomal V-ATPase activity
For the measurement of lysosomal V-ATPase activity, an acridine orange (Invitrogen, 930.01) uptake assay was performed with isolated lysosomes as previously outlined.Citation18 To confirm V-ATPase activity, stimulation of intralysosomal fluorescence and the quenching of the extralysosomal fluorescence was measured with or without 1 μM bafilomycin A1 (Sigma).
CTSD activity assay
CTSD activity was determined using a fluorometric CTSD activity assay kit (Sigma, CS0800). The assay was performed according to the manufacturer’s instructions. Twenty micrograms of the RPE lysate was used per well in a 96-well plate. The assay substrate and the sample were incubated for 30 min at 37 °C. The readings were taken every 2 min on a fluorescence plate reader with excitation at 328 nm and emission wavelength at 393 nm.
Fusion assay
Cryba1fl/fl and cKO cells were transiently transfected with a tandem fluorescently tagged LC3 (GFP-mCherry-LC3).Citation30 Autophagy was induced in cells by serum-starving them for 12 h. CRYBA1 was overexpressed in cKO cells by transfecting with pcDNA-Cryba1 vector prior to autophagy induction. Certain Cryba1fl/fl and cKO cultures were treated with bafilomycin A1 for 12 h prior to autophagy induction. At neutral pH, both fluorophores will fluoresce and the vesicles will show as “yellow” puncta (autophagosomes). When autophagosomes fuse with normal lysosomes, the acidification quenches the GFP signal and only mCherry is visible. Consequently, red puncta indicate autolysosomes or lysosomes. The number of autophagosomes (yellow) and the number of autolysosomes (red only) was calculated using Image J.
Autophagy flux
Autophagy flux is the difference in the levels of LC3-II in the presence and absence of saturating levels of lysosomal inhibitors that prevent the fusion of autophagosomes with lysosomes. The conversion from endogenous LC3-I to LC3-II was detected by immunoblotting with antibodies against LC3 (MBL International, PM036). Autophagy was induced in cells by serum starving them for 12 h. Autophagy flux was measured by treating the control and cKO cells with the lysosomotropic agent, bafilomycin A1, which inhibits acidification inside the lysosome.Citation35 Rapamycin was used as an inducer of autophagy. LC3-flux ratio for the control and cKO cells was determined by measuring the ratio of LC3-II levels in the presence and absence of bafilomycin A1.
Quantification of LC3 and LAMP1 colocalization
Colocalization of LC3 and LAMP1 was imaged using an LSM510 META confocal microscope (Carl Zeiss, Oberkochen, Germany) (63 × NA 1.4 Plan-Apochromat oil-immersion lens) along with the LSM510 version 3.2 software. A minimum of 20 images with a mean of 4 cells per image were taken per condition, per experiment. Each experiment was run at least 3 times. Exposure settings were unchanged throughout acquisition. Images were analyzed using ImageJ software. Pearson correlation and Mander overlap (original, nonthreshold) coefficients were used for assessing colocalization.Citation68 Student t tests were performed to determine statistical significance for correlation and colocalization coefficients. Images shown are single plane projections of representative images using ImageJ and Photoshop software.
Quantification of GFP-LC3-positive puncta
Quantification of GFP-LC3 puncta was performed as previously described.Citation35 About 100 GFP-LC3-positive cells were counted per group after selection of cells with ~10 or more LC3-labeled vesicles. The experiments were performed in triplicate and repeated at least 3 times.
Electroretinography
ERGs were recorded with an Espion ERG Diagnosys machine (Diagnosys, Littleton, MA) as previously described.Citation69 Mice were dark-adapted overnight for 12 h and scotopic ERGs were performed under dim red illumination. Mice were anesthetized with intraperitoneal injection of Avertin (Aldrich, T48402) and topical administration of 0.5% proparacaine hydrochloride (Bausch and Lomb, NDC 24208-730-06). Pupils were dilated with 1% tropicamide (Bausch and Lomb, NDC 24208-585-59) and 2.5% phenylephrine (Alcon Labs, NDC 17478-200-20). Mice were placed on a pad heated to 37 °C, and platinum loop electrodes were placed on each cornea after application of Gonioscopic prism solution (Alcon Labs, NDC 17478-064-12). A reference electrode was placed subcutaneously in the anterior scalp between the eyes, and a ground electrode was inserted into the tail. The head of the mouse was held in a standardized position in a ganzfeld bowl illuminator that ensured equal illumination of the eyes. Recordings for both eyes were made simultaneously with electrical impedance balanced. Six scotopic recordings were made at each of 11 intensity levels of white light ranging from −3.00 to 1.40 log cd-s/m2. For photopic measurements, mice were adapted for 10 min to a background of white light at an intensity of 30 cd/m2, and then under a background of 10 cd/m2, 60 recordings were made at 3 intensity levels of white light, ranging from 0.6 to 1.4log cd-s/m2. The Espion ERG apparatus measures the ERG response multiple times at each flash intensity and records average values. The software does the measurement for the a- and b-waves automatically. The a-wave is measured from the baseline to the negative peak and the b-wave is measured from peak to peak.
Subcellular fractionation of lysosomes
Lysosomes were isolated from Cryba1fl/fl and cKO RPE cells as described.Citation18,Citation70 Lysosomes were pelleted by centrifugation at 77,000 g for 2 h in a discontinuous sucrose gradient. The pelleted lysosomes were suspended in 0.2–0.3 ml of soluble fractionation buffer (50 mM TRIS-HCl, pH 8.0, 0.2 M NaCl and 1 mM EDTA with protease inhibitors [Sigma, P8340]) and centrifuged for 30 min at 355,000 g. The resulting supernatant fraction contains soluble lysosomal proteins and the pellet fraction is resuspended in 0.1 M Na2CO3 and centrifuged at 355,000 g for 30 min to yield a supernatant fraction containing membrane-associated lysosomal proteins.
Statistical analysis
Statistical analysis was performed using Microsoft Excel and GraphPad 5.0 software. The P values were determined by 2-tailed Student t test in a triplicate experiment representative of at least 3 independent experiments. Multiple comparisons were made using Kruskal-Wallis test. Significance was defined as *P ≤ 0.05. Results are presented as mean ± SD. Each biological replicate has at least 3 technical replicates.
| Abbreviations: | ||
| AKT | = | protein kinase B |
| ATP6V0A1 | = | a1 subunit of V0-ATPase |
| cKO | = | conditional knockout |
| CRYBA1 | = | crystallin, beta A1 |
| Cryba1 fl/fl | = | mice homozygous for a “floxed” allele of the Cryba1 gene |
| CTSD | = | cathepsin D |
| ERG | = | electroretinography |
| GFP | = | green fluorescent protein |
| HEXA | = | hexosaminidase A (alpha polypeptide) |
| LAMP1 | = | lysosomal-associated membrane protein-1 |
| LC3 | = | microtubule-associated protein 1 light chain 3 |
| MTORC1 | = | mechanistic target of rapamycin, complex 1 |
| OS | = | outer segments |
| PI3K | = | phosphoinositide 3-kinase |
| PLIN2 | = | perilipin 2 |
| RPE | = | retinal pigment epithelium |
| RPTOR | = | raptor |
| SQSTM1 | = | sequestosome 1 |
| TEM | = | transmission electron microscopy |
| V-ATPase | = | vacuolar-type H+-ATPase |
| XMEA | = | x-linked myopathy with excessive autophagy |
| YFP | = | yellow fluorescent protein |
Additional material
Download Zip (3.3 MB)Disclosure of Potential Conflicts of Interest
No potential conflicts of interest were disclosed.
Acknowledgments
We thank Drs Ana Maria Cuervo and Hiroshi Koga for their advice and for providing GFP-LC3-mCherry plasmid. The mCherry-hLC3B plasmid was a kind gift from Dr. David Rubinsztein and LAMP1-YFP from Dr Jennifer Lippincott-Schwartz. Best1-Cre transgenic mouse was kindly provided by Dr Joshua Dunaief. We thank Dr Morton F Goldberg for critical reading and discussion of the manuscript. SS is in the Centennial High School Science Research Program. DS is a recipient of the Sybil B. Harrington Special Scholar award for Macular Degeneration from Research to Prevent Blindness. Supported by National Institutes of Health: EY019037-S (DS), EY14005 (JTH), EY01765 (Wilmer Imaging Core) and Research to Prevent Blindness (an unrestricted grant to The Wilmer Eye Institute).
References
- Strauss O. The retinal pigment epithelium in visual function. Physiol Rev 2005; 85:845 - 81; http://dx.doi.org/10.1152/physrev.00021.2004; PMID: 15987797
- Sparrow JR, Hicks D, Hamel CP. The retinal pigment epithelium in health and disease. Curr Mol Med 2010; 10:802 - 23; http://dx.doi.org/10.2174/156652410793937813; PMID: 21091424
- Kevany BM, Palczewski K. Phagocytosis of retinal rod and cone photoreceptors. Physiology (Bethesda) 2010; 25:8 - 15; http://dx.doi.org/10.1152/physiol.00038.2009; PMID: 20134024
- Oczypok EA, Oury TD, Chu CT. It’s a cell-eat-cell world: autophagy and phagocytosis. Am J Pathol 2013; 182:612 - 22; http://dx.doi.org/10.1016/j.ajpath.2012.12.017; PMID: 23369575
- Kaarniranta K, Sinha D, Blasiak J, Kauppinen A, Veréb Z, Salminen A, Boulton ME, Petrovski G. Autophagy and heterophagy dysregulation leads to retinal pigment epithelium dysfunction and development of age-related macular degeneration. Autophagy 2013; 9:973 - 84; http://dx.doi.org/10.4161/auto.24546; PMID: 23590900
- Huotari J, Helenius A. Endosome maturation. EMBO J 2011; 30:3481 - 500; http://dx.doi.org/10.1038/emboj.2011.286; PMID: 21878991
- Sun-Wada GH, Wada Y, Futai M. Lysosome and lysosome-related organelles responsible for specialized functions in higher organisms, with special emphasis on vacuolar-type proton ATPase. Cell Struct Funct 2003; 28:455 - 63; http://dx.doi.org/10.1247/csf.28.455; PMID: 14745137
- Mindell JA. Lysosomal acidification mechanisms. Annu Rev Physiol 2012; 74:69 - 86; http://dx.doi.org/10.1146/annurev-physiol-012110-142317; PMID: 22335796
- Forgac M. Vacuolar ATPases: rotary proton pumps in physiology and pathophysiology. Nat Rev Mol Cell Biol 2007; 8:917 - 29; http://dx.doi.org/10.1038/nrm2272; PMID: 17912264
- Toei M, Saum R, Forgac M. Regulation and isoform function of the V-ATPases. Biochemistry 2010; 49:4715 - 23; http://dx.doi.org/10.1021/bi100397s; PMID: 20450191
- Supek F, Supekova L, Mandiyan S, Pan YC, Nelson H, Nelson N. A novel accessory subunit for vacuolar H(+)-ATPase from chromaffin granules. J Biol Chem 1994; 269:24102 - 6; PMID: 7929063
- Zigler JS Jr., Zhang C, Grebe R, Sehrawat G, Hackler L Jr., Adhya S, Hose S, McLeod DS, Bhutto I, Barbour W, et al. Mutation in the βA3/A1-crystallin gene impairs phagosome degradation in the retinal pigmented epithelium of the rat. J Cell Sci 2011; 124:523 - 31; http://dx.doi.org/10.1242/jcs.078790; PMID: 21266465
- Peña-Llopis S, Vega-Rubin-de-Celis S, Schwartz JC, Wolff NC, Tran TA, Zou L, Xie XJ, Corey DR, Brugarolas J. Regulation of TFEB and V-ATPases by mTORC1. EMBO J 2011; 30:3242 - 58; http://dx.doi.org/10.1038/emboj.2011.257; PMID: 21804531
- Zoncu R, Bar-Peled L, Efeyan A, Wang S, Sancak Y, Sabatini DM. mTORC1 senses lysosomal amino acids through an inside-out mechanism that requires the vacuolar H(+)-ATPase. Science 2011; 334:678 - 83; http://dx.doi.org/10.1126/science.1207056; PMID: 22053050
- Piatigorsky J. Gene sharing and evolution: the diversity of protein function. Cambridge, MA, Harvard University Press, 2007.
- Martinez-Vicente M, Sovak G, Cuervo AM. Protein degradation and aging. Exp Gerontol 2005; 40:622 - 33; http://dx.doi.org/10.1016/j.exger.2005.07.005; PMID: 16125351
- Iacovelli J, Zhao C, Wolkow N, Veldman P, Gollomp K, Ojha P, Lukinova N, King A, Feiner L, Esumi N, et al. Generation of Cre transgenic mice with postnatal RPE-specific ocular expression. Invest Ophthalmol Vis Sci 2011; 52:1378 - 83; http://dx.doi.org/10.1167/iovs.10-6347; PMID: 21212186
- Valapala M, Hose S, Gongora C, Dong L, Wawrousek EF, Samuel Zigler J Jr., Sinha D. Impaired endolysosomal function disrupts Notch signalling in optic nerve astrocytes. Nat Commun 2013; 4:1629; http://dx.doi.org/10.1038/ncomms2624; PMID: 23535650
- Page C, Rose M, Yacoub M, Pigott R. Antigenic heterogeneity of vascular endothelium. Am J Pathol 1992; 141:673 - 83; PMID: 1519671
- McLeod DS, Lefer DJ, Merges C, Lutty GA. Enhanced expression of intracellular adhesion molecule-1 and P-selectin in the diabetic human retina and choroid. Am J Pathol 1995; 147:642 - 53; PMID: 7545873
- Heid HW, Moll R, Schwetlick I, Rackwitz HR, Keenan TW. Adipophilin is a specific marker of lipid accumulation in diverse cell types and diseases. Cell Tissue Res 1998; 294:309 - 21; http://dx.doi.org/10.1007/s004410051181; PMID: 9799447
- Heid H, Rickelt S, Zimbelmann R, Winter S, Schumacher H, Dörflinger Y. Lipid droplets, perilipins and cytokeratins--unravelled liaisons in epithelium-derived cells. PLoS One 2013; 8:e63061; http://dx.doi.org/10.1371/journal.pone.0063061; PMID: 23704888
- Ruggiero L, Connor MP, Chen J, Langen R, Finnemann SC. Diurnal, localized exposure of phosphatidylserine by rod outer segment tips in wild-type but not Itgb5-/- or Mfge8-/- mouse retina. Proc Natl Acad Sci U S A 2012; 109:8145 - 8; http://dx.doi.org/10.1073/pnas.1121101109; PMID: 22566632
- Imanishi Y, Sun W, Maeda T, Maeda A, Palczewski K. Retinyl ester homeostasis in the adipose differentiation-related protein-deficient retina. J Biol Chem 2008; 283:25091 - 102; http://dx.doi.org/10.1074/jbc.M802981200; PMID: 18606814
- Gouras P, Brown K, Ivert L, Neuringer M. A novel melano-lysosome in the retinal epithelium of rhesus monkeys. Exp Eye Res 2011; 93:937 - 46; http://dx.doi.org/10.1016/j.exer.2011.10.011; PMID: 22056912
- Boya P. Lysosomal function and dysfunction: mechanism and disease. Antioxid Redox Signal 2012; 17:766 - 74; http://dx.doi.org/10.1089/ars.2011.4405; PMID: 22098160
- Lafourcade C, Sobo K, Kieffer-Jaquinod S, Garin J, van der Goot FG. Regulation of the V-ATPase along the endocytic pathway occurs through reversible subunit association and membrane localization. PLoS One 2008; 3:e2758; http://dx.doi.org/10.1371/journal.pone.0002758; PMID: 18648502
- Trombetta ES, Ebersold M, Garrett W, Pypaert M, Mellman I. Activation of lysosomal function during dendritic cell maturation. Science 2003; 299:1400 - 3; http://dx.doi.org/10.1126/science.1080106; PMID: 12610307
- Uchiyama Y. Autophagic cell death and its execution by lysosomal cathepsins. Arch Histol Cytol 2001; 64:233 - 46; http://dx.doi.org/10.1679/aohc.64.233; PMID: 11575420
- Koga H, Kaushik S, Cuervo AM. Altered lipid content inhibits autophagic vesicular fusion. FASEB J 2010; 24:3052 - 65; http://dx.doi.org/10.1096/fj.09-144519; PMID: 20375270
- Mizushima N, Yoshimori T, Levine B. Methods in mammalian autophagy research. Cell 2010; 140:313 - 26; http://dx.doi.org/10.1016/j.cell.2010.01.028; PMID: 20144757
- Peri F, Nüsslein-Volhard C. Live imaging of neuronal degradation by microglia reveals a role for v0-ATPase a1 in phagosomal fusion in vivo. Cell 2008; 133:916 - 27; http://dx.doi.org/10.1016/j.cell.2008.04.037; PMID: 18510934
- Gagliardi S, Rees M, Farina C. Chemistry and structure activity relationships of bafilomycin A1, a potent and selective inhibitor of the vacuolar H+-ATPase. Curr Med Chem 1999; 6:1197 - 212; PMID: 10519916
- Dröse S, Altendorf K. Bafilomycins and concanamycins as inhibitors of V-ATPases and P-ATPases. J Exp Biol 1997; 200:1 - 8; PMID: 9023991
- Klionsky DJ, Abdalla FC, Abeliovich H, Abraham RT, Acevedo-Arozena A, Adeli K, Agholme L, Agnello M, Agostinis P, Aguirre-Ghiso JA, et al. Guidelines for the use and interpretation of assays for monitoring autophagy. Autophagy 2012; 8:445 - 544; http://dx.doi.org/10.4161/auto.19496; PMID: 22966490
- Kim J-Y, Zhao H, Martinez J, Doggett TA, Kolesnikov AV, Tang PH, Ablonczy Z, Chan CC, Zhou Z, Green DR, et al. Noncanonical autophagy promotes the visual cycle. Cell 2013; 154:365 - 76; http://dx.doi.org/10.1016/j.cell.2013.06.012; PMID: 23870125
- Bjørkøy G, Lamark T, Pankiv S, Øvervatn A, Brech A, Johansen T. Monitoring autophagic degradation of p62/SQSTM1. Methods Enzymol 2009; 452:181 - 97; PMID: 19200883
- Viiri J, Amadio M, Marchesi N, Hyttinen JMT, Kivinen N, Sironen R, Rilla K, Akhtar S, Provenzani A, D’Agostino VG, et al. Autophagy activation clears ELAVL1/HuR-mediated accumulation of SQSTM1/p62 during proteasomal inhibition in human retinal pigment epithelial cells. PLoS One 2013; 8:e69563; http://dx.doi.org/10.1371/journal.pone.0069563; PMID: 23922739
- Rakoczy PE, Lai CM, Baines M, Di Grandi S, Fitton JH, Constable IJ. Modulation of cathepsin D activity in retinal pigment epithelial cells. Biochem J 1997; 324:935 - 40; PMID: 9210419
- Tatti M, Motta M, Di Bartolomeo S, Scarpa S, Cianfanelli V, Cecconi F, Salvioli R. Reduced cathepsins B and D cause impaired autophagic degradation that can be almost completely restored by overexpression of these two proteases in Sap C-deficient fibroblasts. Hum Mol Genet 2012; 21:5159 - 73; http://dx.doi.org/10.1093/hmg/dds367; PMID: 22949512
- Korolchuk VI, Saiki S, Lichtenberg M, Siddiqi FH, Roberts EA, Imarisio S, Jahreiss L, Sarkar S, Futter M, Menzies FM, et al. Lysosomal positioning coordinates cellular nutrient responses. Nat Cell Biol 2011; 13:453 - 60; http://dx.doi.org/10.1038/ncb2204; PMID: 21394080
- Ma B, Sen T, Asnaghi L, Valapala M, Yang F, Hose S, McLeod DS, Lu Y, Eberhart C, Zigler JS Jr., et al. βA3/A1-Crystallin controls anoikis-mediated cell death in astrocytes by modulating PI3K/AKT/mTOR and ERK survival pathways through the PKD/Bit1-signaling axis. Cell Death Dis 2011; 2:e217; http://dx.doi.org/10.1038/cddis.2011.100; PMID: 21993393
- Harms E, Gochman N, Schneider JA. Lysosomal pool of free-amino acids. Biochem Biophys Res Commun 1981; 99:830 - 6; http://dx.doi.org/10.1016/0006-291X(81)91239-0; PMID: 7247944
- Sancak Y, Bar-Peled L, Zoncu R, Markhard AL, Nada S, Sabatini DM. Ragulator-Rag complex targets mTORC1 to the lysosomal surface and is necessary for its activation by amino acids. Cell 2010; 141:290 - 303; http://dx.doi.org/10.1016/j.cell.2010.02.024; PMID: 20381137
- Lee JH, Yu WH, Kumar A, Lee S, Mohan PS, Peterhoff CM, Wolfe DM, Martinez-Vicente M, Massey AC, Sovak G, et al. Lysosomal proteolysis and autophagy require presenilin 1 and are disrupted by Alzheimer-related PS1 mutations. Cell 2010; 141:1146 - 58; http://dx.doi.org/10.1016/j.cell.2010.05.008; PMID: 20541250
- Efeyan A, Zoncu R, Sabatini DM. Amino acids and mTORC1: from lysosomes to disease. Trends Mol Med 2012; 18:524 - 33; http://dx.doi.org/10.1016/j.molmed.2012.05.007; PMID: 22749019
- Ramachandran N, Munteanu I, Wang P, Ruggieri A, Rilstone JJ, Israelian N, Naranian T, Paroutis P, Guo R, Ren ZP, et al. VMA21 deficiency prevents vacuolar ATPase assembly and causes autophagic vacuolar myopathy. Acta Neuropathol 2013; 125:439 - 57; http://dx.doi.org/10.1007/s00401-012-1073-6; PMID: 23315026
- Stauber WT, Hedge AM, Trout JJ, Schottelius BA. Inhibition of lysosomal function in red and white skeletal muscles by chloroquine. Exp Neurol 1981; 71:295 - 306; http://dx.doi.org/10.1016/0014-4886(81)90090-X; PMID: 7004885
- Ostenfeld MS, Høyer-Hansen M, Bastholm L, Fehrenbacher N, Olsen OD, Groth-Pedersen L, Puustinen P, Kirkegaard-Sørensen T, Nylandsted J, Farkas T, et al. Anti-cancer agent siramesine is a lysosomotropic detergent that induces cytoprotective autophagosome accumulation. Autophagy 2008; 4:487 - 99; PMID: 18305408
- Sancak Y, Peterson TR, Shaul YD, Lindquist RA, Thoreen CC, Bar-Peled L, Sabatini DM. The Rag GTPases bind raptor and mediate amino acid signaling to mTORC1. Science 2008; 320:1496 - 501; http://dx.doi.org/10.1126/science.1157535; PMID: 18497260
- Yu L, McPhee CK, Zheng L, Mardones GA, Rong Y, Peng J, Mi N, Zhao Y, Liu Z, Wan F, et al. Termination of autophagy and reformation of lysosomes regulated by mTOR. Nature 2010; 465:942 - 6; http://dx.doi.org/10.1038/nature09076; PMID: 20526321
- Nishino I, Fu J, Tanji K, Yamada T, Shimojo S, Koori T, Mora M, Riggs JE, Oh SJ, Koga Y, et al. Primary LAMP-2 deficiency causes X-linked vacuolar cardiomyopathy and myopathy (Danon disease). Nature 2000; 406:906 - 10; http://dx.doi.org/10.1038/35022604; PMID: 10972294
- Malicdan MC, Noguchi S, Nonaka I, Saftig P, Nishino I. Lysosomal myopathies: an excessive build-up in autophagosomes is too much to handle. Neuromuscul Disord 2008; 18:521 - 9; http://dx.doi.org/10.1016/j.nmd.2008.04.010; PMID: 18502640
- Kalimo H, Savontaus ML, Lang H, Paljärvi L, Sonninen V, Dean PB, Katevuo K, Salminen A. X-linked myopathy with excessive autophagy: a new hereditary muscle disease. Ann Neurol 1988; 23:258 - 65; http://dx.doi.org/10.1002/ana.410230308; PMID: 2897824
- Bergamini E, Cavallini G, Donati A, Gori Z. The role of macroautophagy in the ageing process, anti-ageing intervention and age-associated diseases. Int J Biochem Cell Biol 2004; 36:2392 - 404; http://dx.doi.org/10.1016/j.biocel.2004.05.007; PMID: 15325580
- Keller JN, Dimayuga E, Chen Q, Thorpe J, Gee J, Ding Q. Autophagy, proteasomes, lipofuscin, and oxidative stress in the aging brain. Int J Biochem Cell Biol 2004; 36:2376 - 91; http://dx.doi.org/10.1016/j.biocel.2004.05.003; PMID: 15325579
- Shintani T, Klionsky DJ. Autophagy in health and disease: a double-edged sword. Science 2004; 306:990 - 5; http://dx.doi.org/10.1126/science.1099993; PMID: 15528435
- Cuervo AM, Dice JF. When lysosomes get old. Exp Gerontol 2000; 35:119 - 31; http://dx.doi.org/10.1016/S0531-5565(00)00075-9; PMID: 10767573
- Mariño G, López-Otín C. Autophagy: molecular mechanisms, physiological functions and relevance in human pathology. Cell Mol Life Sci 2004; 61:1439 - 54; http://dx.doi.org/10.1007/s00018-004-4012-4; PMID: 15197469
- Shacka JJ, Roth KA, Zhang J. The autophagy-lysosomal degradation pathway: role in neurodegenerative disease and therapy. Front Biosci 2008; 13:718 - 36; http://dx.doi.org/10.2741/2714; PMID: 17981582
- Butler D, Nixon RA, Bahr BA. Potential compensatory responses through autophagic/lysosomal pathways in neurodegenerative diseases. Autophagy 2006; 2:234 - 7; PMID: 16874061
- Sinha D, Klise A, Sergeev Y, Hose S, Bhutto IA, Hackler L Jr., Malpic-Llanos T, Samtani S, Grebe R, Goldberg MF, et al. betaA3/A1-crystallin in astroglial cells regulates retinal vascular remodeling during development. Mol Cell Neurosci 2008; 37:85 - 95; http://dx.doi.org/10.1016/j.mcn.2007.08.016; PMID: 17931883
- Ritchie DW, Venkatraman V. Ultra-fast FFT protein docking on graphics processors. Bioinformatics 2010; 26:2398 - 405; http://dx.doi.org/10.1093/bioinformatics/btq444; PMID: 20685958
- Sergeev YV, Wingfield PT, Hejtmancik JF. Monomer-dimer equilibrium of normal and modified beta A3-crystallins: experimental determination and molecular modeling. Biochemistry 2000; 39:15799 - 806; http://dx.doi.org/10.1021/bi001882h; PMID: 11123905
- Hejtmancik JF, Wingfield PT, Sergeev YV. Beta-crystallin association. Exp Eye Res 2004; 79:377 - 83; http://dx.doi.org/10.1016/j.exer.2004.06.011; PMID: 15669142
- Gibbs D, Kitamoto J, Williams DS. Abnormal phagocytosis by retinal pigmented epithelium that lacks myosin VIIa, the Usher syndrome 1B protein. Proc Natl Acad Sci U S A 2003; 100:6481 - 6; http://dx.doi.org/10.1073/pnas.1130432100; PMID: 12743369
- Sinha D, Valapala M, Bhutto I, Patek B, Zhang C, Hose S, Yang F, Cano M, Stark WJ, Lutty GA, et al. βA3/A1-crystallin is required for proper astrocyte template formation and vascular remodeling in the retina. Transgenic Res 2012; 21:1033 - 42; http://dx.doi.org/10.1007/s11248-012-9608-0; PMID: 22427112
- Valapala M, Thamake SI, Vishwanatha JK. A competitive hexapeptide inhibitor of annexin A2 prevents hypoxia-induced angiogenic events. J Cell Sci 2011; 124:1453 - 64; http://dx.doi.org/10.1242/jcs.079236; PMID: 21486955
- Komeima K, Rogers BS, Lu L, Campochiaro PA. Antioxidants reduce cone cell death in a model of retinitis pigmentosa. Proc Natl Acad Sci U S A 2006; 103:11300 - 5; http://dx.doi.org/10.1073/pnas.0604056103; PMID: 16849425
- Zhang H, Fan X, Bagshaw R, Mahuran DJ, Callahan JW. Purification and proteomic analysis of lysosomal integral membrane proteins. Methods Mol Biol 2008; 432:229 - 41; http://dx.doi.org/10.1007/978-1-59745-028-7_16; PMID: 18370022