
Abstract
Mesenchymal stem cell (MSC)-based therapy is a promising approach to treat various inflammatory disorders including multiple sclerosis. However, the fate of MSCs in the inflammatory microenvironment is largely unknown. Experimental autoimmune encephalomyelitis (EAE) is a well-studied animal model of multiple sclerosis. We demonstrated that autophagy occurred in MSCs during their application for EAE treatment. Inflammatory cytokines, e.g., interferon gamma and tumor necrosis factor, induced autophagy in MSCs synergistically by inducing expression of BECN1/Beclin 1. Inhibition of autophagy by knockdown of Becn1 significantly improved the therapeutic effects of MSCs on EAE, which was mainly attributable to enhanced suppression upon activation and expansion of CD4+ T cells. Mechanistically, inhibition of autophagy increased reactive oxygen species generation and mitogen-activated protein kinase 1/3 activation in MSCs, which were essential for PTGS2 (prostaglandin-endoperoxide synthase 2 [prostaglandin G/H synthase and cyclooxygenase]) and downstream prostaglandin E2 expression to exert immunoregulatory function. Furthermore, pharmacological treatment of MSCs to inhibit autophagy increased their immunosuppressive effects on T cell-mediated EAE. Our findings indicate that inflammatory microenvironment-induced autophagy downregulates the immunosuppressive function of MSCs. Therefore, modulation of autophagy in MSCs would provide a novel strategy to improve MSC-based immunotherapy.
Introduction
Multiple sclerosis (MS) is an autoimmune disease that is characterized by central nervous system (CNS) inflammation, demyelination, axonal loss, and degeneration.Citation1 Experimental autoimmune encephalomyelitis is a commonly studied autoimmune and inflammatory disease model of human MS.Citation2,Citation3 Demyelination in EAE is mediated by peripheral preactivated, auto-reactive, myelin-specific T cells that migrate and infiltrate into the CNS, where they produce inflammatory cytokines, such as interleukins, IL1B, IL6, IL17A, as well as TNF (tumor necrosis factor) and IFNG (interferon gamma), leading to the damage of the myelin and axons.Citation4-Citation7 By extension, a similar mechanism has been hypothesized in MS, though this remains conjecture.Citation2,Citation3 Existing medications may effectively alleviate MS,Citation2,Citation3,Citation8 but cannot cure the disease. Additional therapies are needed to improve the long-term effectiveness on treating MS.
Multiple studies have demonstrated the beneficial effects of MSCs for reducing various inflammatory disorders, including MS,Citation9-Citation11 graft-vs.-host disease,Citation12 rheumatoid arthritis,Citation13 sepsis, and bone injury.Citation14,Citation15 Some studies suggest that transfer of MSCs leads to amelioration of EAE via a mechanism of inducing T cell anergy and reducing T helper (Th) 17 cell function.Citation16,Citation17 The inflammatory microenvironment in vivo is an important prerequisite for MSCs to mediate their immunomodulatory functions.Citation18 For example, upon stimulation by inflammatory cytokines such as IFNG, TNF, IL1A, and IL1B, MSCs increase the production of PTGS2, NOS2 (nitric oxide synthase 2, inducible), IL10 and TGFB1 (transforming growth factor, β 1), leading to enhanced immunosuppressive functions.Citation18-Citation22 Data from other studies further support the idea that the interaction between MSCs and the inflammatory microenvironment plays important roles in regulating the proliferation, differentiation, and immunomodulatory properties of MSCs.Citation14,Citation15 However, there is little insight into the mechanism by which the inflammatory microenvironment controls the immune-regulatory function of MSCs.
Autophagy is a basic cellular homeostatic process that enables cells to eliminate portions of their own cytoplasmic contents, and it involves degradation of cellular components to ensure a cell’s survival during stress conditions.Citation23-Citation25 The autophagy pathway is positively regulated by starvation, growth factor deprivation, and a multitude of immune-related signaling molecules. The autophagy-related (Atg) genes such as Atg5, Atg7, and Becn1, are essential for autophagosome formation in various cells, such as fibroblasts, macrophages, lymphocytes, and MSCs.Citation26-Citation28 Autophagy plays important roles in regulation of antigen presentation, lymphocyte homeostasis and survival, and cytokine production.Citation24 Recently, autophagy has been reported to promote differentiation of MSCs into neuron-like cells and provide protection against neurological disorders.Citation27 However, whether autophagy plays a role in regulating MSC-mediated immunomodulation remains elusive.
In this study, we demonstrated that autophagy occurred in MSCs during their application for EAE treatment. Inhibition of autophagy using genetic and pharmacological approaches enhanced the therapeutic effect of MSCs on EAE. Inhibition of autophagy improved the immunosuppression of MSCs on T cell proliferation through inducing the expression of PTGS2 and the downstream immunosuppressive factor, PGE2. Our findings identify autophagy to be a critical regulator of the immunomodulatory property of MSCs during their treatment for inflammatory diseases.
Results
MSCs undergo autophagy in the inflammatory microenvironment of EAE
To determine whether MSCs undergo autophagy during treatment of EAE, enhanced green fluorescent protein (EGFP)-MAP1LC3 (microtubule-associated protein 1 light chain 3)-transfected MSCs were administered intravenously (i.v.) into naive mice or EAE mice on d 15 postimmunization. This resulted in a remarkable increase in EGFP-MAP1LC3 dot formation in the cytoplasm of MSCs located in the lung of EAE mice, but not of naive mice at 24 h and 48 h after cell administration (). However, MSCs were not detected in the spinal cord of EAE mice or naive mice at these time points (data not shown). Intriguingly, MSCs appeared in the spinal cord of EAE mice after 72 h, and cells were still detectable 120 h later, which were accompanied with marked EGFP-MAP1LC3 dot formation in the cytoplasm of MSCs (). In contrast, no MSCs were observed in the spinal cord of naive mice. The data indicate that MSCs undergo autophagy in the microenvironment of EAE. These results are also consistent with a recent finding that a large population of i.v.-infused MSCs accumulated in the lung and then gradually homed to sites of injury.Citation29
Figure 1. MSCs undergo autophagy in the inflammatory microenvironment. (A and B) MAP1LC3-EGFP-MSCs were injected into naive and EAE (on day 15) mice via tail vein. Mice were euthanized at 24, 48, 72, and 120 h later, the lungs and spinal cords were separated and cut into frozen sections. Sections were stained with DAPI and examined by confocal microscopy. (C) Immunoblot analysis of MSCs starved for 0 (control) to 12 h, or treated with TNF (20 ng/ml) or IFNG (50 ng/ml) for the indicated times. Densities of MAP1LC3-II were normalized to control treatment and relative fold changes of MAP1LC3-II were normalized to GAPDH. Representative data from 3 separate experiments are shown. (D) MSCs were starved or not starved (control), or treated with TNF (20 ng/ml) or IFNG (50 ng/ml) for 4 h. Cells were stained with anti-MAP1LC3 antibody and analyzed by confocal microscopy. MAP1LC3 puncta-positive cells were counted from 5 images in each group. Representative images from 3 independent experiments are shown. (E) Transmission electron microscopy was utilized to observe autophagosomes in MSCs starved or not starved (control), or treated with TNF (20 ng/ml) or IFNG (50 ng/ml) for 4 h. AV, autophagic vacuoles; N, nucleus. Representative images from 3 independent experiments are shown. (F) Immunoblot analysis of MSCs treated with the indicated concentrations (ng/ml) of TNF plus IFNG. (G and H) MSCs were treated with TNF (20 ng/ml) or/and IFNG (50 ng/ml) for 4 h. Expression levels of Becn1, Atg5, and Atg7 were measured by quantitative real-time PCR (G) and immunoblot analysis (H). (I and J) MSCs were infected with control lentivirus (shNC-MSCs) or lentivirus-expressing shRNA targeting Becn1 (shBecn1-MSCs), and treated with or without TNF plus IFNG. Expression of BECN1 was measured by quantitative real-time PCR (I) and immunoblot analysis (J). **P < 0.01.
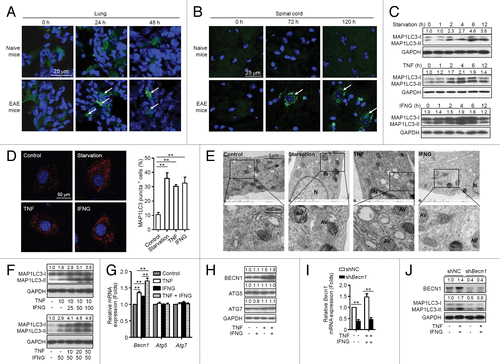
Proinflammatory cytokines such as TNF and IFNG in EAE mice are necessary for activating the immunosuppressive function of MSCs.Citation20 To assess whether TNF and IFNG induce autophagy in MSCs, MSCs were cultured in the absence or presence of TNF or IFNG and cells were collected at various time points for analyses of activation of autophagy. Cells cultured under starvation conditions served as a positive control. Either TNF or IFNG treatment induced significant elevation of MAP1LC3-II in MSCs (), and autophagosome formation was observed by confocal microscopy and transmission electron microscopy (). To determine whether TNF and IFNG act synergistically to induce autophagy in MSCs, different doses of IFNG (ranging from 0 to 100 ng/ml) were added to MSCs that were treated with 10 ng/ml of TNF (, upper panel). Treatment with IFNG significantly promoted TNF-induced MAP1LC3-II upregulation in MSCs in a dose-dependent manner. To further confirm the synergistic effects of TNF and IFNG on the induction of MSC autophagy, TNF was added at various concentrations (0 to 50 ng/ml) to MSCs that were treated with 50 ng/ml of IFNG (, bottom panel). The IFNG-induced upregulation of MAP1LC3-II correlated with increase of TNF concentration. These data suggest that proinflammatory cytokines such as TNF and IFNG, produced during EAE, induce autophagy in MSCs.
Proinflammatory cytokines induce autophagy of MSCs by upregulating BECN1 expression
To determine whether TNF and IFNG induce autophagy in MSCs by increasing expression of BECN1, ATG5, or ATG7, which are 3 key factors for activation of autophagy, their expression was examined. MSCs were cultured in the absence or presence of TNF and/or IFNG. TNF treatment significantly upregulated expression of BECN1 at both mRNA and protein levels (). IFNG alone moderately upregulated expression of Becn1 at mRNA level. Intriguingly, IFNG treatment further increased TNF-induced BECN1 expression at mRNA and protein levels (). It was notable that neither TNF nor IFNG treatment alone or in combination affected expression of ATG5 or ATG7.
To evaluate the role of BECN1 in autophagy induced by TNF plus IFNG treatment, BECN1 expression was reduced in MSCs using a lentivirus-expressing shRNA specific to Becn1 (named shBecn1-MSCs), and cells were cultured in the absence or presence of TNF plus IFNG. MSCs infected with a lentivirus-expressing scrambled shRNA (henceforth shNC-MSCs) were used as controls. Becn1 knockdown decreased expression levels of MAP1LC3-II in MSCs treated with or without TNF plus IFNG as compared with control shRNA (). These results indicate that TNF plus IFNG treatment induces autophagy in MSCs by upregulating BECN1 expression.
Inhibition of autophagy improves the therapeutic effects of MSCs on EAE
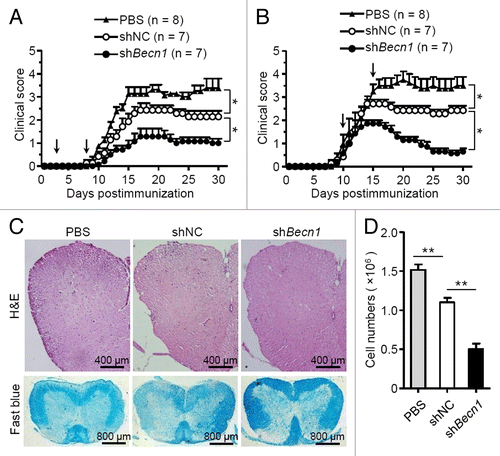
We next examined whether autophagy affected the therapeutic effects of MSCs on EAE. shBecn1-MSCs and shNC-MSCs were generated as described in . MSCs were administered on d 3 and d 8 to prevent EAE (referred to as the preventive protocol), or on d 10 and d 15 to treat EAE (referred to as the therapeutic protocol). Interestingly, administration of shBecn1-MSCs with either a preventive or a therapeutic protocol significantly improved the therapeutic effect on EAE compared with shNC-MSCs (). Histological examination showed there was less infiltration of mononuclear cells and decreased demyelination in the spinal cords of shBecn1-MSC-treated mice as compared with those treated with shNC-MSCs (). Thus, inhibition of autophagy enhances the treatment effect of MSCs on EAE.
Figure 2. Knockdown of Becn1 improves the therapeutic effects of MSCs on EAE. (A and B) Clinical scores of EAE mice intravenously treated with PBS (n = 8 mice per group), shNC-MSCs (n = 7 mice per group), or shBecn1-MSCs (n = 7 mice per group) for the preventive protocol (A) and therapeutic protocol (B) after immunization on the d as indicated by the arrow; 5 × 10⁵ cells per mouse each time. Data are shown as mean ± SEM from one out of 3 independent experiments. (C) EAE mice were treated with PBS, shNC-MSCs or shBecn1-MSCs for therapeutic the protocol and euthanized on d 15. Representative spinal cord sections from these mice were stained with H&E or luxol fast blue. (D) Central nervous system-infiltrated mononuclear cells were isolated and counted from PBS (n = 6 mice per group), shNC-MSC (n = 6 mice per group), or shBecn1-MSC (n = 6 mice per group) treated EAE mice on d 15. Data are shown as mean ± SEM from 3 independent experiments. *P < 0.05, **P < 0.01.
Inhibition of autophagy in MSCs enhances their immune regulatory effects on autoreactive T cell responses
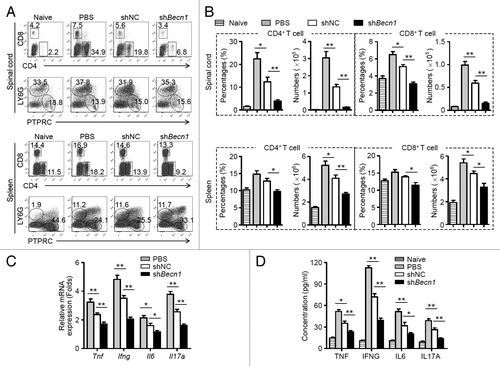
To determine the mechanisms by which shBecn1-MSCs reduce EAE, changes within immune cell populations in the CNS and peripheral immune organs were examined. Compared with shNC-MSC treatment, administration of shBecn1-MSCs significantly reduced the frequenci and absolute numbers of CD4+ and CD8+ T cells in the spinal cords and spleens of EAE mice on d 15 postimmunization (). By contrast, B cells and neutrophils remained largely unchanged between these 2 groups (). Remarkably, the mRNA and protein levels of key proinflammatory cytokines, such as TNF, IFNG, IL6, and IL17A, were reduced significantly in the spinal cords and sera from shBecn1-MSC-treated EAE mice as compared with those of controls (). These observations suggest that shBecn1-MSCs possess greater capability than control MSCs to reduce inflammatory CD4+ and CD8+ T cell responses during EAE.
Figure 3. shBecn1-MSCs display more efficient suppressive effects on autoreactive T cell responses. On d 15 after immunization, mononuclear cells were isolated from spinal cords and spleens of naive mice and PBS-, shNC-MSC-, or shBecn1-MSC-treated EAE mice. (A) The percentages of CD4+ T cells, CD8+ T cells, B cells, and neutrophils were measured by flow cytometry. (B) The percentages and absolute numbers of CD4+ T cells and CD8+ T cells were determined. Data are shown as mean ± SEM (n = 6 mice per group). (C) Expression levels of Tnf, Ifng, Il6, and Il17a mRNAs in the spinal cord were determined by quantitative real-time PCR. Data are normalized to the gene expression level in naive mice and shown as mean ± SEM (n = 6 mice per group). (D) Levels of cytokines in sera of naive mice (n = 8 mice per group) and PBS (n = 10 mice per group)-, shNC-MSC (n = 10 mice per group)-, or shBecn1-MSC (n = 12 mice per group)-treated EAE mice were determined by ELISA. Data are shown as mean ± SEM *P < 0.05, **P < 0.01.
shBecn1-MSCs reduce the activation and expansion of CD4+ T cells in EAE mice
Since CD4+ T cell-mediated immune responses play a central role in the pathogenesis of EAE,Citation30,Citation31 investigations were focused on the bioactivities of CD4+ T cells in mice upon MSC-treatment. To this end, EAE mice subjected to MSC treatment with a preventive protocol were euthanized at d 15 postimmunization, and mononuclear cells derived from spinal cords and spleens were isolated for further analyses. shBecn1-MSCs markedly decreased the expression of activation markers such as IL2RA and CD69 on CD4+ T cells compared with shNC-MSCs (). Moreover, there were considerably lower numbers of BrdU-positive CD4+ T cells and MKI67-positive CD4+ T cells in the spinal cords and spleens of shBecn1-MSC-treated EAE mice compared with those of controls (). [3H]-thymidine incorporation was then performed to determine antigen-specific T cell proliferation in response to the MOG35 to 55 peptide. As shown in , splenocytes derived from shBecn1-MSC-treated EAE mice showed significantly reduced proliferation in response to stimulation with MOG35 to 55 in contrast to those derived from shNC-MSC-treated EAE mice. These data indicate that shBecn1-MSC treatment suppresses CD4+ T cell activation and expansion more substantially than shNC-MSCs treatment does.
Figure 4. Activation and expansion of CD4+ T cells is substantially inhibited in shBecn1-MSC-treated mice. On d 15 after immunization, mononuclear cells were isolated from spinal cords and spleens of naive mice and PBS-, shNC-MSC-, or shBecn1-MSC-treated EAE mice. (A and B) IL2RA and CD69 on CD4+ T cells were measured by flow cytometry (A) and their expression levels were plotted (B). Data are shown as mean ± SEM (n = 6 mice per group). (C) On d 13 after immunization, BrdU was injected i.p. into naive mice and PBS-, shNC-MSC- or shBecn1-MSC-treated EAE mice. Mononuclear cells were isolated from spinal cords and spleens 48 h later, and stained for CD4 and BrdU. Data are representative of 3 independent experiments. (D) Naive mice or EAE mice were treated with PBS, shNC-MSCs, or shBecn1-MSCs for the therapeutic protocol and euthanized on d 15. Representative spinal cord and spleen sections from these mice were stained with anti-CD4 antibody, anti-MKI67 antibody, DAPI, and the sections were examined by confocal microscopy. Representative images are shown. (E) Splenocytes derived from PBS, shNC-MSC-, or shBecn1-MSC-treated mice were restimulated with MOG35 to 55 (20 μg/ml) for 72 h and proliferation was examined by [3H]-thymidine incorporation. Data are shown as mean ± SEM of 3 independent experiments. *P < 0.05, **P < 0.01.
![Figure 4. Activation and expansion of CD4+ T cells is substantially inhibited in shBecn1-MSC-treated mice. On d 15 after immunization, mononuclear cells were isolated from spinal cords and spleens of naive mice and PBS-, shNC-MSC-, or shBecn1-MSC-treated EAE mice. (A and B) IL2RA and CD69 on CD4+ T cells were measured by flow cytometry (A) and their expression levels were plotted (B). Data are shown as mean ± SEM (n = 6 mice per group). (C) On d 13 after immunization, BrdU was injected i.p. into naive mice and PBS-, shNC-MSC- or shBecn1-MSC-treated EAE mice. Mononuclear cells were isolated from spinal cords and spleens 48 h later, and stained for CD4 and BrdU. Data are representative of 3 independent experiments. (D) Naive mice or EAE mice were treated with PBS, shNC-MSCs, or shBecn1-MSCs for the therapeutic protocol and euthanized on d 15. Representative spinal cord and spleen sections from these mice were stained with anti-CD4 antibody, anti-MKI67 antibody, DAPI, and the sections were examined by confocal microscopy. Representative images are shown. (E) Splenocytes derived from PBS, shNC-MSC-, or shBecn1-MSC-treated mice were restimulated with MOG35 to 55 (20 μg/ml) for 72 h and proliferation was examined by [3H]-thymidine incorporation. Data are shown as mean ± SEM of 3 independent experiments. *P < 0.05, **P < 0.01.](/cms/asset/fd6cba5e-94e4-4eca-88ca-ee8c66be1ae4/kaup_a_10928771_f0004.gif)
The effect of MSC treatment on differentiation of CD4+ helper T cell subsets was then evaluated. The frequencies of Th1 cells, Th17 cells, and regulatory T cells (Treg) in the spinal cord and spleen remained unaltered in shBecn1-MSC-treated mice as compared with those of controls (Fig. S1), suggesting that autophagy of MSCs does not affect their ability to influence T cell differentiation. Consistent with this, expression of CXCR3 and CCR6, 2 critical chemokine receptors expressed primarily on pathogenic Th1 and Th17 cells,Citation32 also remained unchanged on CD4+ T cells derived from spinal cords and spleens of EAE mice (Fig. S2). Altogether, these data suggest that the improved treatment efficacy of shBecn1-MSCs in EAE may be attributable to substantially reduced activation and expansion of myelin-specific CD4+ T cells.
shBecn1-MSCs generate more PTGS2 to suppress T cell proliferation
In vitro coculture systems were used to examine the mechanisms by which shBecn1-MSCs reduced proliferation of MOG-specific CD4+ T cells. shBecn1-MSCs suppressed T cell division more efficiently than shNC-MSCs did in a dose-dependent manner (). To determine the underlying mechanisms, MSCs were cultured with or without TNF plus IFNG and a variety of immunosuppressive genes were measured. TNF plus IFNG stimulation upregulated levels of Ptgs2, Nos2, Il10, and Tgfb1 mRNAs in both shBecn1-MSCs and shNC-MSCs (). Notably, shBecn1-MSCs expressed higher levels of Ptgs2 mRNA and protein than shNC-MSCs (). Consistent with this, PGE2, a downstream product of PTGS2 and an effector of immunosuppression, increased significantly in the supernatant fraction of shBecn1-MSCs in contrast to that of shNC-MSCs (). The elevation of PGE2 was also observed in the sera of shBecn1-MSCs-treated EAE mice compared with that of controls (). A functional study showed that NS398, a specific inhibitor of PTGS2, markedly reduced the suppressive effect of shBecn1-MSCs on T cell proliferation to a level similar to that of shNC-MSCs (). These observations indicate that inhibition of BECN1 enhances the immunosuppression effect of MSCs on T cell proliferation mainly through upregulating PTGS2 expression.
Figure 5. shBecn1-MSCs generate more PTGS2 to suppress T cell proliferation. (A) Irradiated shNC-MSCs or shBecn1-MSCs were cocultured with CFSE-labeled CD4+ T cells (2 × 10⁵ cells/well) for 5 d in the presence of anti-CD3 and anti-CD28 antibodies at the indicated ratio. Cells were collected for analysis by flow cytometry at the end of coculture. (B) Irradiated shNC-MSCs or shBecn1-MSCs were cocultured with CD4+ T cells for 72 h at the indicated ratios. Proliferation of CD4+ T cells was examined by [3H]-thymidine incorporation. Data are shown as mean ± SEM of 5 independent experiments. (C) shNC-MSCs and shBecn1-MSCs were treated with or without TNF (20 ng/ml) plus IFNG (50 ng/ml) for 4 h. Expression levels of Ptgs2, Nos2, Il10, and Tgfb1 mRNAs were measured by quantitative real-time PCR. Data are shown as mean ± SEM of 4 independent experiments. (D) Immunoblot analysis of PTGS2 levels in shNC-MSCs and shBecn1-MSCs treated with or without TNF (20 ng/ml) plus IFNG (50 ng/ml) for 6 h. (E) shNC-MSCs and shBecn1-MSCs were treated with or without TNF (20 ng/ml) plus IFNG (50 ng/ml) for 24 h, and production of PGE2 in the supernatant fractions was measured by ELISA. Data are shown as mean ± SEM of 4 independent experiments. (F) Levels of PGE2 in sera of naive mice and PBS-, shNC-MSC- or shBecn1-MSC-treated EAE mice were determined by ELISA. Data are shown as mean ± SEM (n = 6 mice per group). (G) Irradiated shNC-MSCs or shBecn1-MSCs were cocultured with CD4+ T cells at the ratio of 1:20 for 3 d in the presence of anti-CD3 and anti-CD28 antibodies. NS398 (5 μM) was added to block PTGS2 activity. Proliferation of CD4+ T cells was examined by [3H]-thymidine incorporation. Data are shown as mean ± SEM of 5 independent experiments. Representative data from 3 separate experiments are shown (A and D). *P < 0.05, **P < 0.01.
![Figure 5. shBecn1-MSCs generate more PTGS2 to suppress T cell proliferation. (A) Irradiated shNC-MSCs or shBecn1-MSCs were cocultured with CFSE-labeled CD4+ T cells (2 × 10⁵ cells/well) for 5 d in the presence of anti-CD3 and anti-CD28 antibodies at the indicated ratio. Cells were collected for analysis by flow cytometry at the end of coculture. (B) Irradiated shNC-MSCs or shBecn1-MSCs were cocultured with CD4+ T cells for 72 h at the indicated ratios. Proliferation of CD4+ T cells was examined by [3H]-thymidine incorporation. Data are shown as mean ± SEM of 5 independent experiments. (C) shNC-MSCs and shBecn1-MSCs were treated with or without TNF (20 ng/ml) plus IFNG (50 ng/ml) for 4 h. Expression levels of Ptgs2, Nos2, Il10, and Tgfb1 mRNAs were measured by quantitative real-time PCR. Data are shown as mean ± SEM of 4 independent experiments. (D) Immunoblot analysis of PTGS2 levels in shNC-MSCs and shBecn1-MSCs treated with or without TNF (20 ng/ml) plus IFNG (50 ng/ml) for 6 h. (E) shNC-MSCs and shBecn1-MSCs were treated with or without TNF (20 ng/ml) plus IFNG (50 ng/ml) for 24 h, and production of PGE2 in the supernatant fractions was measured by ELISA. Data are shown as mean ± SEM of 4 independent experiments. (F) Levels of PGE2 in sera of naive mice and PBS-, shNC-MSC- or shBecn1-MSC-treated EAE mice were determined by ELISA. Data are shown as mean ± SEM (n = 6 mice per group). (G) Irradiated shNC-MSCs or shBecn1-MSCs were cocultured with CD4+ T cells at the ratio of 1:20 for 3 d in the presence of anti-CD3 and anti-CD28 antibodies. NS398 (5 μM) was added to block PTGS2 activity. Proliferation of CD4+ T cells was examined by [3H]-thymidine incorporation. Data are shown as mean ± SEM of 5 independent experiments. Representative data from 3 separate experiments are shown (A and D). *P < 0.05, **P < 0.01.](/cms/asset/3d71cac8-9551-413e-b634-bef0300f7dec/kaup_a_10928771_f0005.gif)
Inhibition of autophagy increases PTGS2 expression through activation of the ROS-MAPK1/3 pathway
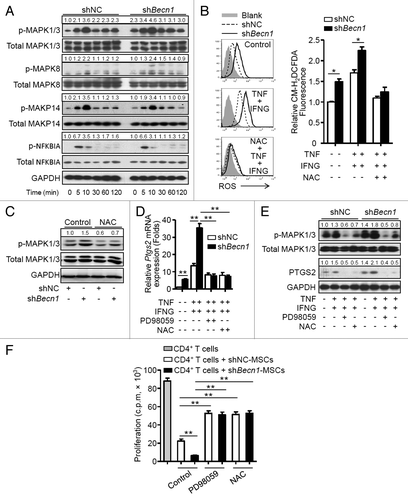
The pathways that regulate expression of PTGS2 were examined. A higher basal phosphorylation level of mitogen-activated protein kinases, MAPK1/3, was observed in shBecn1-MSCs in contrast to that in shNC-MSCs. Stimulation with TNF plus IFNG further increased phosphorylated MAPK1/3 in shBecn1-MSCs but did not affect phosphorylation of MAPK14, MAKP8, or NFKBIA (). It is reported that reactive oxygen species (ROS) can regulate MAPK and NFKB signaling pathways,Citation33 thus generation of ROS in MSCs was examined. As shown in , shBecn1-MSCs produced more ROS than shNC-MSCs at a basal level; TNF plus IFNG stimulation further upregulated ROS generation in shBecn1-MSCs, which was blocked by a specific ROS scavenger, N-acetyl cysteine (NAC). Interestingly, increased phosphorylation of MAPK1/3 was reversed by NAC (). Moreover, both NAC and PD98059, a specific inhibitor of MAPK1/3, reduced levels of Ptgs2 mRNA and protein in MSCs treated with TNF plus IFNG (). The roles of ROS and MAPK1/3 activation in regulating the immunosuppressive property of MSCs were then examined. As shown in , PD98059 or NAC pretreatment significantly reversed the suppressive effects of shBecn1-MSCs on CD4+ T cell proliferation to levels similar to those of shNC-MSCs. These data suggest that inhibition of autophagy can increase PTGS2 expression through activation of the ROS-MAPK1/3 pathway in MSCs.
Figure 6. Inhibition of autophagy increases PTGS2 expression through activation of the ROS-MAPK1/3 pathway. (A) shNC-MSCs and shBecn1-MSCs were treated with or without TNF (20 ng/ml) plus IFNG (50 ng/ml). Cells were harvested and analyzed by immunoblot at the indicated time points. (B) shNC-MSCs and shBecn1-MSCs were treated with or without TNF (20 ng/ml) plus IFNG (50 ng/ml) for 6 h, then incubated with CM-H2DCFDA (2.5 μM) for 30 min, and analyzed by flow cytometry. Relative CM-H2DCFDA fluorescence was normalized to control. The graph (mean ± SEM) shows relative CM-H2DCFDA fluorescence from 3 independent experiments. (C) Immunoblot analysis of MAPK1/3 phosphorylation in shNC-MSCs and shBecn1-MSCs treated with or without NAC for 4 h. (D and E) shNC-MSCs and shBecn1-MSCs were treated with MAPK1/3 inhibitor PD98059 (20 μM) or ROS inhibitor NAC (10 mM) for 30 min prior to TNF plus IFNG treatment. (D) After TNF (20 ng/ml) plus IFNG (50 ng/ml) treatment for 4 h, Ptgs2 expression was measured by quantitative real-time PCR. Data are shown as mean ± SEM of 3 independent experiments. (E) After TNF (20 ng/ml) plus IFNG (50 ng/ml) treatment for 6 h, cells were analyzed by immunoblots. (F) shNC-MSCs and shBecn1-MSCs were pretreated with MAPK1/3 inhibitor PD98059 (20 μM) or ROS inhibitor NAC (10 mM) for 4 h prior to coculture with CD4+ T cells at the ratio of 1:20. Data are shown as mean ± SEM of 5 independent experiments. Data are representative of 3 independent experiments (A, C, and E). *P < 0.05, **P < 0.01.
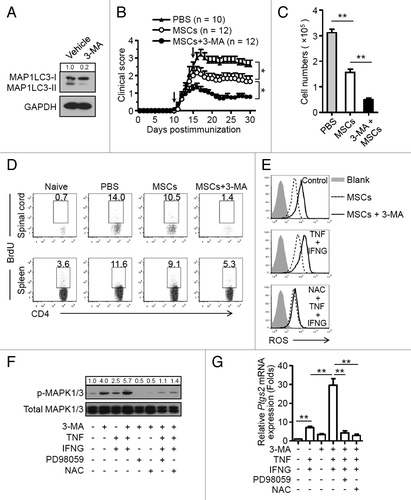
3-MA-pretreatment improves the therapeutic effect of MSCs on EAE
Finally, we examined whether inhibition of autophagy with a pharmacological approach improves the therapeutic potential of MSCs in EAE. MSCs were pretreated for 12 h with 3-methyladenine (3-MA), which is a nonspecific inhibitor of autophagy ().Citation34 Cells were then administered on d 10 and d 15 postimmunization. As shown in , 3-MA-pretreated MSCs possessed greater ability than untreated MSCs to reduce EAE in these mice. Mice given MSCs pretreated with 3-MA showed a significant reduction in CD4+ T cell infiltration in the CNS (); this was accompanied by a decreased frequency of BrdU-positive CD4+ T cells in the spinal cord and spleen (). 3-MA-pretreated MSCs produced more ROS, had higher phosphorylation of MAPK1/3, and generated more PTGS2 both in the absence and presence of TNF plus IFNG stimulation (). Addition of NAC or PD98059 abrogated the effect of 3-MA on MSCs (). Taken together, these data suggest that pharmacological treatment of MSCs promote their immunosuppressive effects on T cell-mediated EAE through a mechanism of inhibiting autophagy.
Figure 7. 3-MA pretreatment of MSCs improves their therapeutic efficacy in EAE. (A) MSCs were treated with or without 3-MA (10 mM) for 12 h and analyzed by immunoblots. (B) Clinical scores were obtained for EAE mice treated with PBS (n = 10 mice per group), MSCs (n = 12 mice per group), and 3-MA-pretreated MSCs (n = 12 mice per group). Data are shown as mean ± SEM from one out of 3 independent experiments. (C and D) Central nervous system-infiltrated mononuclear cells were isolated from PBS- (n = 6 mice per group), MSC- (n = 6 mice per group), and 3-MA-pretreated MSC-treated (n = 6 mice per group) EAE mice on day 15, and total cell numbers were counted. (C) Cells were stained with anti-CD4 antibody and CD4+ T cell numbers were determined. Data are shown as mean ± SEM (n = 6 mice per group). (D) Cells were stained with anti-CD4 and anti-BrdU antibodies, and analyzed by flow cytometry. (E) MSCs were pretreated with 3-MA for 12 h, cells were then treated with or without TNF (20 ng/ml) plus IFNG (50 ng/ml) for 6 h. NAC was added to inhibit ROS generation. Cells were then incubated with CM-H2DCFDA (2.5 μM) for 30 min and analyzed by flow cytometry. (F) MSCs were pretreated with 3-MA for 12 h, cells were then treated with MAPK1/3 inhibitor PD98059 (20 μM) or ROS inhibitor NAC (10 mM) for 30 min prior to TNF plus IFNG treatment, and cells were analyzed by immunoblots. (G) MSCs were pretreated with 3-MA for 12 h, then treated with MAPK1/3 inhibitor PD98059 (20 μM) or ROS inhibitor NAC (10 mM) for 30 min prior to TNF (20 ng/ml) plus IFNG (50 ng/ml) treatment for 4 h. The expression of Ptgs2 was measured by quantitative real-time PCR. Data are shown as mean ± SEM of 4 independent experiments. *P < 0.05, **P < 0.01.
Discussion
Recently, MSCs have been reported to enhance autophagy of neuronal cells and exert a neuroprotective effect through modulation of Aβ clearance.Citation35 Here we demonstrate for the first time that MSCs themselves undergo autophagy in response to the inflammatory environment of EAE. Inflammatory cytokines (e.g., TNF and IFNG)-induced autophagy regulates the immunosuppressive function of MSCs. Inhibition of autophagy by knockdown of Becn1 significantly improved the therapeutic effects of MSCs on EAE. This effect was associated with enhanced suppression of activation and expansion of CD4+ T cells. We found that inhibition of autophagy in MSCs increased their ROS generation and MAPK1/3 activation, which are essential for upregulating PTGS2; PTGS2, in turn, has potent immunoregulatory function. Furthermore, pharmacological inhibition of autophagy by 3-MA markedly improved the therapeutic effect of MSCs on EAE. Our findings suggest that modulation of autophagy in MSCs may present a novel strategy to improve their therapeutic efficacy in EAE and other inflammatory disorders in a broad context.
Recent studies have demonstrated that the interaction between MSCs and the inflammatory microenvironment determines the outcome of MSC-mediated therapy.Citation15,Citation20 For example, Liu et al. have shown that inflammatory T cells induce apoptosis of MSCs and govern MSC-based regeneration of bone tissue via secretion of TNF and IFNG.Citation15 Krampera et al. demonstrate that activated T cells and NK cells secrete IFNG to stimulate production of IDO1 (indoleamine 2, 3-dioxygenase 1) by human MSCs, which in turn inhibits the proliferation of activated T or NK cells.Citation36 These results suggested that coinfusing MSCs with a graft has a beneficial effect on inflammatory diseases. By infusing EGFP-MAP1LC3 MSCs intravenously, we detected considerably enhanced EGFP-MAP1LC3 dot formation in the cytoplasm of MSCs located in the lung, and more importantly, spinal cord of EAE mice at various time points after MSC infusion. Since the spinal cord is the target organ of inflammatory responses in MS and EAE, these results demonstrate for the first time that MSCs undergo autophagy in the inflammatory microenvironment.
TNF and IFNG are 2 proinflammatory cytokines that play critical roles in the pathogenesis of EAE.Citation5,Citation37 On the other hand, they are known to be required for MSCs to exert their immunosuppressive functions.Citation21,Citation38 For example, IFNG significantly increases the expression of HMOX1 (heme oxygenase [decycling] 1) and PTGS2 in human MSCs to promote their suppressive function.Citation21 The combination of IFNG and TNF elicits the immunosuppressive function of MSCs by inducing expression of high levels of several chemokines and effectors in MSCs.Citation20 In separate experiments, we observed that IFNG and TNF were important for MSCs to suppress T cell proliferation elicited by T cell receptor signaling. Addition of neutralizing antibodies specific to IFNG and TNF reversed the suppressive effect of MSCs on T cell proliferation upon T cell receptor activation (data not shown). Notably, a recent study has indicated that, after disease stabilization, the therapeutic efficacy of MSCs in mouse EAE model was not as apparent as that in the acute phase.Citation16 One plausible explanation is that low levels of inflammatory cytokines in recipients with stabilized disease may be insufficient to elicit the immunomodulatory effect of MSCs. Intriguingly, we found that both IFNG and TNF were able to induce autophagy in exogenously infused MSCs. Moreover, these 2 cytokines acted synergistically to induce the upregulation of MAP1LC3-II in MSCs by increasing BECN1 expression, which corroborates previous findings that IFNG and TNF are able to induce BECN1 expression in various cell types to activate autophagy.Citation39,Citation40 It would be interesting to determine whether these cytokines also affect host MSCs through a mechanism of autophagy in physiological conditions.
Autophagy is extensively involved in several biological activities including cell survival, lymphocyte homeostasis, and regulation of cytokine production.Citation24 We demonstrate that inhibition of autophagy in MSCs by knockdown of Becn1 enhances the immunosuppressive effects of MSCs on T cell activation and proliferation, resulting in improved therapeutic efficacy in EAE. These findings indicate the importance of autophagy in regulating the immunomodulatory function of MSCs in the inflammatory microenvironment. All these data indicate that the inflammatory microenvironment may have a dual function in the context of affecting the immunomodulatory property of MSCs. Although inflammatory cytokines such as IFNG and TNF may enhance the immunosuppressive function of MSCs, they possess the ability to induce autophagy of MSCs, which acts as a negative feedback mechanism to reduce the immunomodulatory activity of MSCs. Thus, the immunoregulatory function of MSCs is not fixed, but reflects the result of their crosstalk with the microenvironment. Unraveling the signaling pathways associated with the autophagy induction and the licensing of immunosuppressive property of MSCs by inflammatory cytokines will provide insight into the influence of inflammatory microenvironment on the biological activities of MSCs.
A variety of immunosuppressive molecules such as PTGS2, NOS2, IL10, and TGFB1 can be induced in MSCs by IFNG and TNF. These molecules are reported to act synergistically to mediate the suppressive effects of MSCs in the inflammatory microenvironment.Citation38 Interestingly, in the current study, inhibition of autophagy by knockdown of Becn1 or 3-MA-pretreatment only significantly upregulated PTGS2 expression but not other proteins in MSCs. PTGS2 catalyzes conversion of arachidonic acid to PGE2, and it plays a pivotal role in the immunosuppressive function of MSCs by suppressing T cell proliferation.Citation12,Citation14,Citation41-Citation43 We found that inhibition of autophagy further increased PGE2 production that is induced by inflammatory cytokines, and inhibition of PTGS2 by NS398 markedly prevented the enhanced immunosuppressive function of shBecn1-MSCs. Thus, PTGS2 plays an important role in autophagy-mediated modulation of MSC immunosuppression.
ROS serves as a critical signaling molecule in a variety of cellular processes, including cell proliferation, survival, differentiation, and programmed cell death.Citation33,Citation44 Autophagy can reduce ROS levels via SQSTM1/p62-mediated delivery of oxidized protein aggregates to autophagosomes.Citation45,Citation46 We find that shBecn1-MSCs produce more ROS than control MSCs in the inflammatory microenvironment. Moreover, ROS production elicits MAPK1/3 activation, and activation of the ROS-MAPK1/3 pathway is required for upregulation of PTGS2 in MSCs. Interestingly, a previous study also demonstrates activation of the ROS-MAPK1/3-PTGS2 pathway in esophageal adenocarcinoma cells by commensal bacteria and the resultant products.Citation47,Citation48 Collectively, our data suggest that autophagy influences the ROS-MAPK1/3-PTGS2 pathway in MSCs, and consequently affects the immunomodulatory property of MSCs.
Previous studies have shown that there are similarities but also differences between human and murine MSCs.Citation49,Citation50 For example, both human and murine MSCs can generate effector molecules such as PGE2, IL6, and IL10.Citation14,Citation51,Citation52 However, in response to stimulation of proinflammatory cytokines such as IFNG and TNF, murine MSCs produce high levels of NOS2 and low levels of IDO1. In contrast, human MSCs express abundant IDO1 but very little NOS2.Citation22 In the present study, we found that murine MSCs underwent autophagy in the inflammatory microenvironment, which resulted in downregulation of their immunomodulatory capability in a ROS-MAPK1/3-PTGS2-PGE2-dependent manner. Interestingly, data from recent studies suggest that autophagy also occurs in human MSCs under certain conditions.Citation53,Citation54 Our findings justify investigation of the influence of inflammatory microenvironment on the immunomodulatory activity of human MSCs.
Several studies have reported that MSCs can ameliorate development of EAE through suppression of T cell-mediated responses.Citation16,Citation17 In the present study, we administered shBecn1-MSCs as a treatment of EAE and we found that these MSCs ameliorate the severity of EAE more efficiently than control MSCs. Moreover, we demonstrated that 3-MA, a pharmacological inhibitor of autophagy that targets PtdIns3K, improved the therapeutic efficacy of MSCs.Citation34 Our results suggest that pharmacological inhibition of autophagy may lead to new approaches that improve the immunotherapeutic effects of MSCs in inflammatory diseases. However, autophagy occurs at a basal level in most tissues and maintains cell survival and homeostasis. Impaired autophagy may link to the risk of tumor formation.Citation55-Citation58 Becn1+/− mice develop tumors under certain circumstances.Citation56,Citation57 In humans, allelic loss of the Becn1 gene is prevalent in breast, ovarian, and prostate cancers.Citation58 These observations suggest that in vivo administration of autophagy inhibitors might have a potential drawback of increased risk of tumor formation. Building on our findings, we propose that pretreatment of MSCs with a pharmacological autophagy inhibitor in vitro followed by thoroughly washing to remove the compound may be an alternative solution to improve the immunomodulatory activity of MSCs.
In summary, our findings indicate that inflammatory microenvironment-induced autophagy downregulates the immunosuppressive function of MSCs. Therefore, modulation of autophagy in MSCs may provide a novel strategy to improve MSC-based immunotherapy. Given its potent effects on reducing T cell responses, it will be valuable to investigate whether inhibition of autophagy in MSCs may augment their immunoregulatory effects on other T cell-mediated inflammatory disorders such as rheumatoid arthritis and inflammatory bowel disease.
Materials and Methods
MSC culture
Female C57BL/6 mice were purchased from the Shanghai Laboratory Animal Center of the Chinese Academy of Sciences and housed under specific pathogen-free conditions in the animal center of Shanghai Jiao Tong University School of Medicine (Shanghai, China). Bone marrow cells were flushed from the bone cavity of femurs and tibias of mice with DMEM-low glucose (Hyclone, SH30021.01B) containing 10% FBS (Gibco, 12664025). A single-cell suspension of all nucleated cells was obtained by passing all bone marrow cells through a 70-μm cell strainer (BD Biosciences, 352340). All the single cells were seeded at 1 × 10⁶/100-mm culture dish (Corning, 430167) and initially incubated for 48 h at 37 °C and 5% CO2. To eliminate the nonadherent cells, the cultures were washed with PBS (Invitrogen, 21600044) twice on the second day. The attached cells were cultured with DMEM-low glucose supplemented with 15% FBS, 2 mM L-glutamine (Invitrogen, 35050-061), 100 U/ml penicillin, and 100 μg/ml streptomycin (Invitrogen, 15140-122). Cell surface marker analysis confirmed that MSCs were positive for CD44 (12-0441-81) and LY6A (17-5981-81), negative for ITGAM (12-0112-81), PECAM1 (12-0311), CD34 (11-0341-81), PTPRC (17-0451-82), MHC class I (12-5999) and MHC class II (12-5321). All of these antibodies were purchased from eBioscience. Cells were used at the 5th to 15th passages.
Lentiviral vector construction
Oligonucleotides with the following nucleotide sequences were used for the cloning of shRNA-encoding sequences into a lentiviral vector pLVX-shRNA2 (Gift from Dr Xiaoren Zhang): Becn1 (shBecn1): 5′-gatccGGAGA AAGGCAAGAT TGAAGATTCA AGAGATCTTC AATCTTGCCT TTCTCCTTTT TTg-3′; Scrambled control (shNC): 5′-gatccACTAC CGTTGTTATA GGTGTTCAAG AGACACCTAT AACAACGGTA GTTTTTTTg-3′ (Synthesized by GenePharma).
High-titer lentiviral stocks were produced and used at a multiplicity of infection of 50 to infect MSCs, and the efficiency of infection exceeded 95%. MSCs were infected with scrambled control lentivirus (shNC-MSCs) or lentivirus-expressing shRNA inhibiting the essential autophagy gene Becn1 (shBecn1-MSCs).
EAE model induction and treatment
EAE was induced as follows: mice (age 6 to 8 wk) were immunized subcutaneously (s.c.) with a mixture of myelin oligodendrocyte glycoprotein (MOG35 to 55, MEVGWYRSPFSRVVHLYRNGK, 300 μg/mouse, synthesized by GL Biochem) and complete Freund’s adjuvant (Sigma-Aldrich, F5506) containing 5 mg/ml Mycobacterium tuberculosis H37Ra (BD Difco, 231141). Pertussis toxin (200 ng/mouse, List Biological Laboratories, 181) in PBS was administered i.v. on day 0 and day 2. PBS, shNC-MSCs or shBecn1-MSCs (5 × 10⁵ cells/mouse) were administered i.v. on d 3 and d 8 for the preventive protocol and on d 10 and d 15 for the therapeutic protocol. In some experiments, naive MSCs were treated with 3-MA (10 mM, Sigma-Aldrich, M9281) for 12 h, and then were injected i.v. on d 10 and d 15. Mice were examined daily and scored for disease severity by the standard scale: 0, no clinical signs; 1) limp tail; 2) paraparesis with incomplete paralysis of 1 or 2 hind limbs; 3) paraplegia with complete paralysis of 2 hind limbs; 4) paraplegia with fore limb weakness or paralysis; 5) moribund or death. All animal procedures were approved by the Animal Welfare & Ethics Committee of Shanghai Jiao Tong University School of Medicine.
In vivo autophagy assay
MSCs were infected with lentivirus-expressing EGFP-MAP1LC3 and administered into naive and EAE mice via tain vein for the indicated times. Mice were then euthanized, the lungs and the spinal cords separated, embedded into OCT (SAKURA, 4583), and stored at -80 °C. Frozen sections were cut, stained with 4’, 6-diamidino-2-phenylindole (DAPI, Sigma-Aldrich, D9542), and analyzed by confocal microscopy.
Flow cytometry analysis
Spinal cords and spleens were separated from naive mice and PBS-, shNC-MSC-, or shBecn1-MSC-treated EAE mice after euthanasia. Mononuclear cells were isolated from spinal cords with Percoll (GE healthcare 17-0891-09) or from spleens with Ficoll (LymphoprepTM, 1114547). Cells were stained with anti-CD4 (eBioscience, 17-0041-83; BD Biosciences, 553729), anti-CD8 (BD Biosciences, 553035), anti-PTPRC (45-0452-82), anti-LY6G (11-5931-82), anti-ITGAM (BD Biosciences, 553312), anti-IL2RA (12-0251-83), anti-CD69 (11-0691-82), anti-CXCR3 (12-1831-80), and anti-CCR6 antibodies (Biolegend, 129814). For Th1 cell, Th17 cell and Treg cell analysis, cells were stained with surface marker, permeabilized with the Intracellular Fixation and Permeabilization Buffer Set (eBioscience, 88-8824-00), and then stained with anti-IFNG (11-7311-82), anti-IL17A (12-7177-81), and anti-FOXP3 (12-5773-80) antibodies. All these antibodies were purchased from eBioscience, unless marked otherwise. The samples were analyzed by flow cytometry (FACSAria II, BD Biosciences, San Jose, CA USA)
Ex vivo and in vivo T cell proliferation assays
For ex vivo T cell proliferation assay, splenocytes from PBS-, shNC-MSC- or shBecn1-MSC-treated EAE mice were isolated and stimulated with MOG35 to 55 (20 μg/ml) for 72 h and [3H]-thymidine was added 18 h before the end of the coculture. For in vivo T cell proliferation assay, bromodeoxyuridine (BrdU, 2 mg/mouse, Sigma-Aldrich, B5002) was injected into naive mice and PBS-, shNC-MSC- or shBecn1-MSC-treated EAE mice via the intraperitoneal route on the indicated d. 48 h later, mice were euthanized and mononuclear cells were isolated from spinal cords and spleens. Immunofluorescent staining of incorporated BrdU was performed according to the BrdU Flow Kit instruction manual (BD Biosciences, 559619). The cells were analyzed by flow cytometry.
In vitro T cell proliferation assays
shNC-MSCs and shBecn1-MSCs were irradiated with 30 Gy from a 137 Cs source and seeded into 96-well plates. Freshly isolated CD4+ T cells (2 × 10⁵ cells/well, Miltenyi Biotec, 130-049-201) were labeled with 2.5 μM CFSE (Invitrogen, C34554) and cocultured with MSCs for 5 d in the presence of anti-CD3 (2 μg/ml, eBioscience, 16-0031-85) and anti-CD28 (2 μg/ml, eBioscience, 16-0281-85) antibodies, then collected for flow cytometric analysis. In some experiments, irradiated shNC-MSCs or shBecn1-MSCs were cocultured with CD4+ T cells for 72 h and [3H]-thymidine was added 18 h before the end of coculture. In some other experiments, PTGS2 inhibitor (NS398, Sigma-Aldrich, N194), pMAPK1/3 inhibitor (PD98059, Merck, 513000), or ROS scavenger (N-Acetyl-l-cysteine, NAC, Sigma-Aldrich, A9165) was added to the coculture system.
Quantitative real-time PCR
Total RNA was extracted from MSCs at the indicated times and was subsequently reverse-transcribed using a Reverse Transcription System (Takara, DRR036A). Quantitative PCR was performed using SYBR Green PCR mix (Roche, 4913914001) on an ABI Prism® 7900HT Sequence Detection System (Applied Biosystems, Foster City, CA, USA). Actb was used as an internal control to normalize for differences in the amount of total RNA in each sample. The primer sequences are listed in Table S1.
Immunoblot
Cells were lysed with ice-cold RIPA buffer (Pierce, 89900) containing protease and phosphatase inhibitors (Roche, 04693159001). The lysates were fractionated by SDS-PAGE and analyzed by immunoblot with specific antibodies to MAP1LC3-I/-II (4108), GAPDH (2118), BECN1 (3738), ATG5 (8540), total MAPK1/3 (9102), total NFKBIA (4812), total MAPK8 (9258), total MAPK14 (9212), p-NFKBIA (9246), p-MAPK1/3 (4370), p-MAPK14 (9215) and p-MAPK8 (4671), ATG7 (8558), PTGS2 (BD Biosciences, 610204). All these antibodies were purchased from Cell Signaling Technology, unless marked otherwise. Immunoblot bands were quantified by densitometry using ImageJ. Densities were normalized to control treatment and relative folds were normalized to GAPDH.
Confocal microscopy
MSCs were seeded into 12-well plates with lysine-coated slides and stimulated with TNF (20 ng/ml, R&D Systems, 410-MT), IFNG (50 ng/ml, R&D Systems, 485-MI), or starved with minimum essential medium with Earle’s balanced salts (MEM/EBSS, Hyclone, SH30024.02) for 4 h. The cells were fixed with 4% paraformaldehyde, permeabilized with 0.1% (vol/vol) Triton X-100 (Sigma-Aldrich, T9284), blocked with 2% BSA (Santa Cruz, sc-2323), and incubated with anti-MAP1LC3 antibody (Cell Signaling Technology, 4108) overnight. Cells were washed with PBST and incubated with Cy3-labeled secondary antibody (Jackson, 111-165-003) and DAPI. For the MKI67 assay, mice were euthanized. Spinal cord and spleen were separated from naive mice and PBS-, shNC-MSC-, or shBecn1-MSC-treated EAE mice, and embedded in OCT. Frozen sections were cut and permeabilized with 0.1% (vol/vol) Triton X-100, blocked with 2% BSA, and stained with anti-MKI67 antibody (Abcam, ab15580) and anti-CD4 antibody (BD Biosciences, 550280). Cells were washed with PBST, and incubated with either Alexa 488- or Cy3-labeled secondary antibody (Invitrogen, CA11070), together with DAPI. Confocal microscopy (TCS SP5, Leica Microsystems, Wetzlar, Germany) was used for examining the slides and images were obtained.
Electron microscopy
After treatment with TNF, IFNG, and MEM/EBSS, MSCs was washed in ice-cold PBS, fixed with 2% glutaraldehyde (Sigma-Aldrich, G5882), and washed twice with PBS. MSCs were post-fixed with 1% osmium tetroxide (Sigma-Aldrich, 75632), dehydrated, and treated with propylene oxide (Sigma-Aldrich, 82320) before being embedded in epoxy resin (Sigma-Aldrich, A3183). MSCs were cut into thin sections, stained with lead citrate (Sigma-Aldrich, 15326), and analyzed with transmission electron microscopy (CM-120, Philips, Eindhoven, Netherlands).
PGE2 detection
ShNC-MSCs and shBecn1-MSCs were stimulated with TNF (20 ng/ml) plus IFNG (50 ng/ml) for 24 h. PGE2 in MSC culture supernatant fractions and the sera of EAE mice injected with PBS, ShNC-MSCs or shBecn1-MSCs was quantified with a PGE2 enzyme-linked immunosorbent assay (ELISA) kit according to the manufacturer’s guidelines (R&D Systems, KGE004B).
ROS assay
MSCs were plated in 6-well plates and treated with TNF (20 ng/ml) plus IFNG (50 ng/ml) for 24 h. Culture medium was removed and cells were washed with PBS and incubated with CM-H2DCFDA (Invitrogen, C400) at 2.5 μM final concentration in serum-free medium for 30 min at 37 °C. Cells were washed with warmed PBS, removed from plates, immediately resuspended in cold PBS containing 1% FBS, and subjected to flow cytometric analysis. Unstained controls were treated similarly, except that treatments and dyes were omitted.
Histopathology
Mice injected with PBS, shNC-MSCs, or shBecn1-MSCs were euthanized. Spinal cords were isolated, dehydrated with alcohol, and embedded in paraffin. Then sections of spinal cords were stained with hematoxylin and eosin (H&E; Beyotime, C0105) or luxol fast blue (Sigma-Aldrich, S3382)
Statistics
Statistical analysis was performed with GraphPad Prism 5 and SPSS 17.0. To compare 2 means, the unpaired Student t test or Mann-Whitney U test was used. To compare EAE curves, the nonparametric Kruskal-Wallis test was used. P < 0.05 was considered statistically significant.
| Abbreviations: | ||
| 3-MA | = | 3-methyladenine |
| Atg | = | autophagy-related (gene) |
| BECN1 | = | Beclin 1, autophagy-related |
| CNS | = | central nervous system |
| EAE | = | experimental autoimmune encephalomyelitis |
| EGFP | = | enhanced green fluorescent protein |
| H&E | = | haematoxylin and eosin |
| IDO1 | = | indoleamine 2, 3-dioxygenase 1 |
| IFNG | = | interferon, gamma |
| IL | = | interleukin |
| i.v. | = | intravenously |
| MAP1LC3 | = | microtubule-associated protein 1 light chain 3 |
| MAPK | = | mitogen-activated protein kinase |
| MEM/EBSS | = | minimum essential medium with Earle’s balanced salts |
| MSCs | = | mesenchymal stem cells |
| MS | = | multiple sclerosis |
| NAC | = | N-acetyl cysteine |
| NOS2 | = | nitric oxide synthase 2, inducible |
| PGE2 | = | prostaglandin E2 |
| PTGS2 | = | prostaglandin-endoperoxide synthase 2 (prostaglandin G/H synthase and cyclooxygenase) |
| ROS | = | reactive oxygen species |
| TNF | = | tumor necrosis factor |
| Treg | = | regulatory T cells |
| Th | = | T helper |
| TGFB1 | = | transforming growth factor, beta 1 |
Additional material
Download Zip (1.1 MB)Disclosure of Potential Conflicts of Interest
No potential conflicts of interest were disclosed.
Acknowledgments
The authors thank Dr Gary Brewer (University of Medicine and Dentistry of New Jersey) and Dr Xiaoren Zhang for kindly providing the plasmid construct pLVX-shRNA2. This work was supported by the Ministry of Science and Technology of China (2011CB966200, 2010CB945600), Strategic Priority Research Program of the Chinese Academy of Sciences (XDA01040000), National Natural Science Foundation of China (81130057, 81071748, 81202113, 81190133), the Program of Science and Technology Commission of Shanghai Municipality (11JC1411400, 11431920900, 13ZR1423200), and Scientific Innovative Project of Shanghai Municipal Education Commission (14YZ033).
References
- Mc Guire C, Beyaert R, van Loo G. Death receptor signalling in central nervous system inflammation and demyelination. Trends Neurosci 2011; 34:619 - 28; http://dx.doi.org/10.1016/j.tins.2011.09.002; PMID: 21999927
- Gold R, Linington C, Lassmann H. Understanding pathogenesis and therapy of multiple sclerosis via animal models: 70 years of merits and culprits in experimental autoimmune encephalomyelitis research. Brain 2006; 129:1953 - 71; http://dx.doi.org/10.1093/brain/awl075; PMID: 16632554
- Constantinescu CS, Farooqi N, O’Brien K, Gran B. Experimental autoimmune encephalomyelitis (EAE) as a model for multiple sclerosis (MS). Br J Pharmacol 2011; 164:1079 - 106; http://dx.doi.org/10.1111/j.1476-5381.2011.01302.x; PMID: 21371012
- Probert L, Eugster HP, Akassoglou K, Bauer J, Frei K, Lassmann H, Fontana A. TNFR1 signalling is critical for the development of demyelination and the limitation of T-cell responses during immune-mediated CNS disease. Brain 2000; 123:2005 - 19; http://dx.doi.org/10.1093/brain/123.10.2005; PMID: 11004118
- Stoll G, Jander S, Schroeter M. Cytokines in CNS disorders: neurotoxicity versus neuroprotection. J Neural Transm Suppl 2000; 59:81 - 9; PMID: 10961421
- Jadidi-Niaragh F, Mirshafiey A. Th17 cell, the new player of neuroinflammatory process in multiple sclerosis. Scand J Immunol 2011; 74:1 - 13; http://dx.doi.org/10.1111/j.1365-3083.2011.02536.x; PMID: 21338381
- Jiang HR, Milovanović M, Allan D, Niedbala W, Besnard AG, Fukada SY, Alves-Filho JC, Togbe D, Goodyear CS, Linington C, et al. IL-33 attenuates EAE by suppressing IL-17 and IFN-γ production and inducing alternatively activated macrophages. Eur J Immunol 2012; 42:1804 - 14; http://dx.doi.org/10.1002/eji.201141947; PMID: 22585447
- Trapp BD, Nave KA. Multiple sclerosis: an immune or neurodegenerative disorder?. Annu Rev Neurosci 2008; 31:247 - 69; http://dx.doi.org/10.1146/annurev.neuro.30.051606.094313; PMID: 18558855
- Uccelli A, Pistoia V, Moretta L. Mesenchymal stem cells: a new strategy for immunosuppression?. Trends Immunol 2007; 28:219 - 26; http://dx.doi.org/10.1016/j.it.2007.03.001; PMID: 17400510
- Bai L, Lennon DP, Eaton V, Maier K, Caplan AI, Miller SD, Miller RH. Human bone marrow-derived mesenchymal stem cells induce Th2-polarized immune response and promote endogenous repair in animal models of multiple sclerosis. Glia 2009; 57:1192 - 203; http://dx.doi.org/10.1002/glia.20841; PMID: 19191336
- Rafei M, Birman E, Forner K, Galipeau J. Allogeneic mesenchymal stem cells for treatment of experimental autoimmune encephalomyelitis. Mol Ther 2009; 17:1799 - 803; http://dx.doi.org/10.1038/mt.2009.157; PMID: 19602999
- Aggarwal S, Pittenger MF. Human mesenchymal stem cells modulate allogeneic immune cell responses. Blood 2005; 105:1815 - 22; http://dx.doi.org/10.1182/blood-2004-04-1559; PMID: 15494428
- Augello A, Tasso R, Negrini SM, Cancedda R, Pennesi G. Cell therapy using allogeneic bone marrow mesenchymal stem cells prevents tissue damage in collagen-induced arthritis. Arthritis Rheum 2007; 56:1175 - 86; http://dx.doi.org/10.1002/art.22511; PMID: 17393437
- Németh K, Leelahavanichkul A, Yuen PST, Mayer B, Parmelee A, Doi K, Robey PG, Leelahavanichkul K, Koller BH, Brown JM, et al. Bone marrow stromal cells attenuate sepsis via prostaglandin E(2)-dependent reprogramming of host macrophages to increase their interleukin-10 production. Nat Med 2009; 15:42 - 9; http://dx.doi.org/10.1038/nm.1905; PMID: 19098906
- Liu Y, Wang L, Kikuiri T, Akiyama K, Chen C, Xu X, Yang R, Chen W, Wang S, Shi S. Mesenchymal stem cell-based tissue regeneration is governed by recipient T lymphocytes via IFN-γ and TNF-α. Nat Med 2011; 17:1594 - 601; http://dx.doi.org/10.1038/nm.2542; PMID: 22101767
- Zappia E, Casazza S, Pedemonte E, Benvenuto F, Bonanni I, Gerdoni E, Giunti D, Ceravolo A, Cazzanti F, Frassoni F, et al. Mesenchymal stem cells ameliorate experimental autoimmune encephalomyelitis inducing T-cell anergy. Blood 2005; 106:1755 - 61; http://dx.doi.org/10.1182/blood-2005-04-1496; PMID: 15905186
- Rafei M, Campeau PM, Aguilar-Mahecha A, Buchanan M, Williams P, Birman E, Yuan S, Young YK, Boivin MN, Forner K, et al. Mesenchymal stromal cells ameliorate experimental autoimmune encephalomyelitis by inhibiting CD4 Th17 T cells in a CC chemokine ligand 2-dependent manner. J Immunol 2009; 182:5994 - 6002; http://dx.doi.org/10.4049/jimmunol.0803962; PMID: 19414750
- Shi Y, Hu G, Su J, Li W, Chen Q, Shou P, Xu C, Chen X, Huang Y, Zhu Z, et al. Mesenchymal stem cells: a new strategy for immunosuppression and tissue repair. Cell Res 2010; 20:510 - 8; http://dx.doi.org/10.1038/cr.2010.44; PMID: 20368733
- Le Blanc K, Mougiakakos D. Multipotent mesenchymal stromal cells and the innate immune system. Nat Rev Immunol 2012; 12:383 - 96; http://dx.doi.org/10.1038/nri3209; PMID: 22531326
- Ren G, Zhang L, Zhao X, Xu G, Zhang Y, Roberts AI, Zhao RC, Shi Y. Mesenchymal stem cell-mediated immunosuppression occurs via concerted action of chemokines and nitric oxide. Cell Stem Cell 2008; 2:141 - 50; http://dx.doi.org/10.1016/j.stem.2007.11.014; PMID: 18371435
- Mougiakakos D, Jitschin R, Johansson CC, Okita R, Kiessling R, Le Blanc K. The impact of inflammatory licensing on heme oxygenase-1-mediated induction of regulatory T cells by human mesenchymal stem cells. Blood 2011; 117:4826 - 35; http://dx.doi.org/10.1182/blood-2010-12-324038; PMID: 21389316
- Ren G, Su J, Zhang L, Zhao X, Ling W, L’huillie A, Zhang J, Lu Y, Roberts AI, Ji W, et al. Species variation in the mechanisms of mesenchymal stem cell-mediated immunosuppression. Stem Cells 2009; 27:1954 - 62; http://dx.doi.org/10.1002/stem.118; PMID: 19544427
- Levine B, Deretic V. Unveiling the roles of autophagy in innate and adaptive immunity. Nat Rev Immunol 2007; 7:767 - 77; http://dx.doi.org/10.1038/nri2161; PMID: 17767194
- Kuballa P, Nolte WM, Castoreno AB, Xavier RJ. Autophagy and the immune system. Annu Rev Immunol 2012; 30:611 - 46; http://dx.doi.org/10.1146/annurev-immunol-020711-074948; PMID: 22449030
- Levine B, Mizushima N, Virgin HW. Autophagy in immunity and inflammation. Nature 2011; 469:323 - 35; http://dx.doi.org/10.1038/nature09782; PMID: 21248839
- Singh R, Xiang Y, Wang Y, Baikati K, Cuervo AM, Luu YK, Tang Y, Pessin JE, Schwartz GJ, Czaja MJ. Autophagy regulates adipose mass and differentiation in mice. J Clin Invest 2009; 119:3329 - 39; PMID: 19855132
- Ugland H, Naderi S, Brech A, Collas P, Blomhoff HK. cAMP induces autophagy via a novel pathway involving ERK, cyclin E and Beclin 1. Autophagy 2011; 7:1199 - 211; http://dx.doi.org/10.4161/auto.7.10.16649; PMID: 21750416
- Pyo JO, Nah J, Kim HJ, Lee HJ, Heo J, Lee H, Jung YK. Compensatory activation of ERK1/2 in Atg5-deficient mouse embryo fibroblasts suppresses oxidative stress-induced cell death. Autophagy 2008; 4:315 - 21; PMID: 18196969
- Lee RH, Pulin AA, Seo MJ, Kota DJ, Ylostalo J, Larson BL, Semprun-Prieto L, Delafontaine P, Prockop DJ. Intravenous hMSCs improve myocardial infarction in mice because cells embolized in lung are activated to secrete the anti-inflammatory protein TSG-6. Cell Stem Cell 2009; 5:54 - 63; http://dx.doi.org/10.1016/j.stem.2009.05.003; PMID: 19570514
- Reboldi A, Coisne C, Baumjohann D, Benvenuto F, Bottinelli D, Lira S, Uccelli A, Lanzavecchia A, Engelhardt B, Sallusto F. C-C chemokine receptor 6-regulated entry of TH-17 cells into the CNS through the choroid plexus is required for the initiation of EAE. Nat Immunol 2009; 10:514 - 23; http://dx.doi.org/10.1038/ni.1716; PMID: 19305396
- Goverman J. Autoimmune T cell responses in the central nervous system. Nat Rev Immunol 2009; 9:393 - 407; http://dx.doi.org/10.1038/nri2550; PMID: 19444307
- Xu J, Zhang Y, Xiao Y, Ma S, Liu Q, Dang S, Jin M, Shi Y, Wan B, Zhang Y. Inhibition of 12/15-lipoxygenase by baicalein induces microglia PPARβ/δ: a potential therapeutic role for CNS autoimmune disease. Cell Death Dis 2013; 4:e569; http://dx.doi.org/10.1038/cddis.2013.86; PMID: 23559003
- Ray PD, Huang BW, Tsuji Y. Reactive oxygen species (ROS) homeostasis and redox regulation in cellular signaling. Cell Signal 2012; 24:981 - 90; http://dx.doi.org/10.1016/j.cellsig.2012.01.008; PMID: 22286106
- Wu YT, Tan HL, Shui G, Bauvy C, Huang Q, Wenk MR, Ong CN, Codogno P, Shen HM. Dual role of 3-methyladenine in modulation of autophagy via different temporal patterns of inhibition on class I and III phosphoinositide 3-kinase. J Biol Chem 2010; 285:10850 - 61; http://dx.doi.org/10.1074/jbc.M109.080796; PMID: 20123989
- Shin JYPH, Park HJ, Kim HN, Oh SH, Bae JS, Ha HJ, Lee PH. Mesenchymal stem cells enhance autophagy and increase β-amyloid clearance in Alzheimer disease models. Autophagy 2014; 10:32 - 44; http://dx.doi.org/10.4161/auto.26508; PMID: 24149893
- Krampera M, Cosmi L, Angeli R, Pasini A, Liotta F, Andreini A, Santarlasci V, Mazzinghi B, Pizzolo G, Vinante F, et al. Role for interferon-gamma in the immunomodulatory activity of human bone marrow mesenchymal stem cells. Stem Cells 2006; 24:386 - 98; http://dx.doi.org/10.1634/stemcells.2005-0008; PMID: 16123384
- Miller E. Multiple sclerosis. Adv Exp Med Biol 2012; 724:222 - 38; http://dx.doi.org/10.1007/978-1-4614-0653-2_17; PMID: 22411246
- Shi Y, Su J, Roberts AI, Shou P, Rabson AB, Ren G. How mesenchymal stem cells interact with tissue immune responses. Trends Immunol 2012; 33:136 - 43; http://dx.doi.org/10.1016/j.it.2011.11.004; PMID: 22227317
- Tu SP, Quante M, Bhagat G, Takaishi S, Cui G, Yang XD, Muthuplani S, Shibata W, Fox JG, Pritchard DM, et al. IFN-γ inhibits gastric carcinogenesis by inducing epithelial cell autophagy and T-cell apoptosis. Cancer Res 2011; 71:4247 - 59; http://dx.doi.org/10.1158/0008-5472.CAN-10-4009; PMID: 21512143
- Djavaheri-Mergny M, Amelotti M, Mathieu J, Besançon F, Bauvy C, Souquère S, Pierron G, Codogno P. NF-kappaB activation represses tumor necrosis factor-alpha-induced autophagy. J Biol Chem 2006; 281:30373 - 82; http://dx.doi.org/10.1074/jbc.M602097200; PMID: 16857678
- Spaggiari GM, Capobianco A, Abdelrazik H, Becchetti F, Mingari MC, Moretta L. Mesenchymal stem cells inhibit natural killer-cell proliferation, cytotoxicity, and cytokine production: role of indoleamine 2,3-dioxygenase and prostaglandin E2. Blood 2008; 111:1327 - 33; http://dx.doi.org/10.1182/blood-2007-02-074997; PMID: 17951526
- Prasanna SJ, Gopalakrishnan D, Shankar SR, Vasandan AB. Pro-inflammatory cytokines, IFNgamma and TNFalpha, influence immune properties of human bone marrow and Wharton jelly mesenchymal stem cells differentially. PLoS One 2010; 5:e9016; http://dx.doi.org/10.1371/journal.pone.0009016; PMID: 20126406
- Crop MJ, Baan CC, Korevaar SS, Ijzermans JN, Pescatori M, Stubbs AP, van Ijcken WF, Dahlke MH, Eggenhofer E, Weimar W, et al. Inflammatory conditions affect gene expression and function of human adipose tissue-derived mesenchymal stem cells. Clin Exp Immunol 2010; 162:474 - 86; http://dx.doi.org/10.1111/j.1365-2249.2010.04256.x; PMID: 20846162
- Scherz-Shouval R, Shvets E, Fass E, Shorer H, Gil L, Elazar Z. Reactive oxygen species are essential for autophagy and specifically regulate the activity of Atg4. EMBO J 2007; 26:1749 - 60; http://dx.doi.org/10.1038/sj.emboj.7601623; PMID: 17347651
- Scherz-Shouval R, Elazar Z. Regulation of autophagy by ROS: physiology and pathology. Trends Biochem Sci 2011; 36:30 - 8; http://dx.doi.org/10.1016/j.tibs.2010.07.007; PMID: 20728362
- Jain A, Lamark T, Sjøttem E, Larsen KB, Awuh JA, Øvervatn A, McMahon M, Hayes JD, Johansen T. p62/SQSTM1 is a target gene for transcription factor NRF2 and creates a positive feedback loop by inducing antioxidant response element-driven gene transcription. J Biol Chem 2010; 285:22576 - 91; http://dx.doi.org/10.1074/jbc.M110.118976; PMID: 20452972
- Song S, Guha S, Liu K, Buttar NS, Bresalier RS. COX-2 induction by unconjugated bile acids involves reactive oxygen species-mediated signalling pathways in Barrett’s oesophagus and oesophageal adenocarcinoma. Gut 2007; 56:1512 - 21; http://dx.doi.org/10.1136/gut.2007.121244; PMID: 17604323
- Cai C, Teng L, Vu D, He JQ, Guo Y, Li Q, Tang XL, Rokosh G, Bhatnagar A, Bolli R. The heme oxygenase 1 inducer (CoPP) protects human cardiac stem cells against apoptosis through activation of the extracellular signal-regulated kinase (ERK)/NRF2 signaling pathway and cytokine release. J Biol Chem 2012; 287:33720 - 32; http://dx.doi.org/10.1074/jbc.M112.385542; PMID: 22879597
- Su J, Chen X, Huang Y, Li W, Li J, Cao K, Cao G, Zhang L, Li F, Roberts AI, et al. Phylogenetic distinction of iNOS and IDO function in mesenchymal stem cell-mediated immunosuppression in mammalian species. Cell Death Differ 2014; 21:388 - 96; http://dx.doi.org/10.1038/cdd.2013.149; PMID: 24162664
- Bernardo ME, Fibbe WE. Mesenchymal stromal cells: sensors and switchers of inflammation. Cell Stem Cell 2013; 13:392 - 402; http://dx.doi.org/10.1016/j.stem.2013.09.006; PMID: 24094322
- Najar M, Raicevic G, Boufker HI, Fayyad Kazan H, De Bruyn C, Meuleman N, Bron D, Toungouz M, Lagneaux L. Mesenchymal stromal cells use PGE2 to modulate activation and proliferation of lymphocyte subsets: Combined comparison of adipose tissue, Wharton’s Jelly and bone marrow sources. Cell Immunol 2010; 264:171 - 9; http://dx.doi.org/10.1016/j.cellimm.2010.06.006; PMID: 20619400
- Ghannam S, Pène J, Moquet-Torcy G, Jorgensen C, Yssel H. Mesenchymal stem cells inhibit human Th17 cell differentiation and function and induce a T regulatory cell phenotype. J Immunol 2010; 185:302 - 12; http://dx.doi.org/10.4049/jimmunol.0902007; PMID: 20511548
- Lee Y, Jung J, Cho KJ, Lee SK, Park JW, Oh IH, Kim GJ. Increased SCF/c-kit by hypoxia promotes autophagy of human placental chorionic plate-derived mesenchymal stem cells via regulating the phosphorylation of mTOR. J Cell Biochem 2013; 114:79 - 88; http://dx.doi.org/10.1002/jcb.24303; PMID: 22833529
- Herberg S, Shi X, Johnson MH, Hamrick MW, Isales CM, Hill WD. Stromal cell-derived factor-1β mediates cell survival through enhancing autophagy in bone marrow-derived mesenchymal stem cells. PLoS One 2013; 8:e58207; http://dx.doi.org/10.1371/journal.pone.0058207; PMID: 23472159
- Sridhar S, Botbol Y, Macian F, Cuervo AM. Autophagy and disease: always two sides to a problem. J Pathol 2012; 226:255 - 73; http://dx.doi.org/10.1002/path.3025; PMID: 21990109
- Qu X, Yu J, Bhagat G, Furuya N, Hibshoosh H, Troxel A, Rosen J, Eskelinen EL, Mizushima N, Ohsumi Y, et al. Promotion of tumorigenesis by heterozygous disruption of the beclin 1 autophagy gene. J Clin Invest 2003; 112:1809 - 20; http://dx.doi.org/10.1172/JCI20039; PMID: 14638851
- Yue Z, Jin S, Yang C, Levine AJ, Heintz N. Beclin 1, an autophagy gene essential for early embryonic development, is a haploinsufficient tumor suppressor. Proc Natl Acad Sci U S A 2003; 100:15077 - 82; http://dx.doi.org/10.1073/pnas.2436255100; PMID: 14657337
- Aita VM, Liang XH, Murty VV, Pincus DL, Yu W, Cayanis E, Kalachikov S, Gilliam TC, Levine B. Cloning and genomic organization of beclin 1, a candidate tumor suppressor gene on chromosome 17q21. Genomics 1999; 59:59 - 65; http://dx.doi.org/10.1006/geno.1999.5851; PMID: 10395800