
Abstract
We previously reported that inhibition of autophagy significantly augmented the anticancer activity of the histone deacetylase (HDAC) inhibitor vorinostat (VOR) through a cathepsin D-mediated mechanism. We thus conducted a first-in-human study to investigate the safety, preliminary efficacy, pharmacokinetics (PK), and pharmacodynamics (PD) of the combination of the autophagy inhibitor hydroxychloroquine (HCQ) and VOR in patients with advanced solid tumors. Of 27 patients treated in the study, 24 were considered fully evaluable for study assessments and toxicity. Patients were treated orally with escalating doses of HCQ daily (QD) (d 2 to 21 of a 21-d cycle) in combination with 400 mg VOR QD (d one to 21). Treatment-related adverse events (AE) included grade 1 to 2 nausea, diarrhea, fatigue, weight loss, anemia, and elevated creatinine. Grade 3 fatigue and/or myelosuppression were observed in a minority of patients. Fatigue and gastrointestinal AE were dose-limiting toxicities. Six-hundred milligrams HCQ and 400 mg VOR was established as the maximum tolerated dose and recommended phase II regimen. One patient with renal cell carcinoma had a confirmed durable partial response and 2 patients with colorectal cancer had prolonged stable disease. The addition of HCQ did not significantly impact the PK profile of VOR. Treatment-related increases in the expression of CDKN1A and CTSD were more pronounced in tumor biopsies than peripheral blood mononuclear cells. Based on the safety and preliminary efficacy of this combination, additional clinical studies are currently being planned to further investigate autophagy inhibition as a new approach to increase the efficacy of HDAC inhibitors.
Introduction
Autophagy is an evolutionarily conserved degradation process utilized for the turnover of organelles and a subset of proteins with long half-lives. It also serves as an essential mechanism of nutrient recycling that generates basic biochemical building blocks and alternative sources of metabolic fuel that maintain cell survival during periods of cellular stress.Citation1,Citation2 Over the past decade, intensive investigation has helped to define better the role that autophagy plays in cancer.Citation3 Key studies have demonstrated that the specific effects of autophagic degradation in malignant pathogenesis are clearly context-dependent. In the premalignant state, autophagy can prevent defective cells from proliferating and thus, potentially acquiring additional mutations/defects that promote oncogenesis. In contrast, in the context of advanced cancer, autophagy appears to function primarily as a mechanism that promotes cell survival under the stressful conditions that are hallmarks of the tumor microenvironment including hypoxia and nutrient deprivation.Citation3 In addition to endogenous stresses, treatment with radiation and a broad range of anticancer therapeutic agents with diverse mechanisms of action also induce autophagy.Citation4 A large body of evidence suggests that this phenomenon blunts therapeutic efficacy by increasing the survival capacity of malignant cells.Citation5-Citation7 These collective findings provide a strong rationale to further investigate autophagy inhibition as a novel strategy to augment the efficacy of cancer therapies.
Histone deacetylases (HDACs) are a family of 18 related proteins that play an important role in the epigenetic regulation of gene expression. HDACs facilitate the removal of acetyl groups, which leads to transcriptional repression.Citation8 Overexpression and/or hyperactivation of multiple HDACs are mechanisms that promote epigenetic dysregulation in cancer cells and consequently, promotes malignant progression and anticancer drug resistance. Thus, targeting HDAC activity is an appealing therapeutic strategy for many cancers. A number of different HDAC inhibitors have been preclinically and clinically investigated to date for their utility as anticancer agents. Pharmacodynamic studies have shown that disruption of HDAC activity induces pleiotropic effects in tumor cells including cell-cycle arrest, differentiation, decreased angiogenesis, autophagy, and apoptosis.Citation9,Citation10 Vorinostat (VOR) was the first HDAC inhibitor to receive FDA approval for cancer therapy. It is currently indicated for the treatment of cutaneous T-cell lymphoma and has also demonstrated modest activity in patients with advanced solid tumors.Citation11
Numerous recent investigations have focused on identifying key mechanisms of resistance to HDAC inhibitors with the primary goals of better identifying patients likely to benefit from therapy with this class of agents and developing new strategies to circumvent resistance.Citation12-Citation14 We previously showed that HDAC inhibitor-induced autophagy significantly blunts its anticancer activity. Accordingly, genetic or pharmacological disruption of autophagy synergistically modulated the pro-apoptotic and cytostatic effects of VOR in models of imatinib-resistant chronic myeloid leukemia and colon cancer. Therapy-induced increase in the levels of lysosomal protease CTSD was identified as a key downstream pharmacodynamic mediator of the proapoptotic effects of the combination of vorinostat and the autophagy inhibitor chloroquine (CQ).Citation15,Citation16
CQ and hydroxychloroquine (HCQ) are FDA-approved drugs that have been used for the treatment of malaria, rheumatoid arthritis, and lupus for decades. Both CQ and HCQ inhibit autophagic degradation through their disruption of lysosomal function.Citation5,Citation6 Based on the clinical availability of drugs that inhibit autophagy and our preclinical data demonstrating that disrupting autophagy synergistically augmented the activity of VOR, we designed a first-in-human phase I clinical trial of HCQ in combination with an oral, once daily regimen of VOR in adult patients with advanced refractory solid malignancies. Our major objectives were to determine the safety of this combination, establish the maximum tolerated dose (MTD) and recommended phase II dose, and evaluate its preliminary efficacy. We also investigated the potential impact of HCQ on the pharmacokinetics of VOR and assessed the pharmacodynamics of HCQ plus VOR in peripheral blood mononuclear cells (PBMC) and tumor biopsy specimens.
Results
Patients, MTD, and safety
A standard “3 + 3” phase I clinical trial design was utilized to assess the safety and preliminary efficacy of the combination of HCQ and VOR in patients with advanced and refractory solid tumors. We enrolled 31 patients on this study, 4 of whom failed screening eligibility criteria. Of the 27 patients that were treated, 24 were evaluable for study assessments due to 3 patients having rapid clinical deterioration related to underlying disease in cycle 1. The baseline characteristics of the patients enrolled in each individual cohort are described in . The median age of patients included in this study was 63 y (range 57 to 80). The majority of patients had an Eastern Cooperative Oncology Group performance status of 1 (n = 23) and had received 3 or more prior lines of therapy (n = 19). The tumor types of treated patients were as follows: colorectal cancer (CRC, n = 12), non-small cell lung cancer (NSCLC, n = 2), ovarian cancer (n = 3), soft tissue sarcoma (STS, n = 3), renal cell carcinoma (RCC, n = 1), breast cancer (n = 1), melanoma (n = 2), carcinoid (n = 1), bladder cancer (n = 1), and prostate cancer (n = 1). Patients began treatment with VOR at a dose of 300 mg orally on cycle 1 d 1 and continued through d 21. VOR was administered with food. HCQ dosing began on cycle 1 d 2. Both drugs were administered in continuous 21-d cycles per protocol unless otherwise indicated based on tolerability or disease status. The starting dose for HCQ was 400 mg orally once daily. HCQ dose escalation proceeded as detailed in the table included in . The highest administered dose of HCQ was 800 mg (cohort 4).
Table 1. Demographic summary and disease characteristics at baseline
Figure 1. The combination of HCQ and vorinostat (VOR) induced a dramatic response in a patient with renal cell carcinoma (RCC). (A) Study dosing scheme. The dose of HCQ and VOR for each cohort are defined. Each cohort that was evaluated is indicated in red font. Patients were not enrolled in cohorts 1, 2 as dose de-escalation was not required. Enrollment in cohort 5 was not initiated based on dose-limiting toxicities (DLTs) that were observed in cohort 4. The dosing utilized for cohort 3 (600 mg HCQ + 400 mg VOR daily) was defined as the maximum tolerated dose (MTD). (B) Treatment with HCQ and VOR yielded a prolonged partial response in a patient with refractory RCC that has been durable for more than 50 cycles of therapy. MRI scans obtained at baseline and post cycles 10 and 50 (C10 and C50, respectively) are shown.
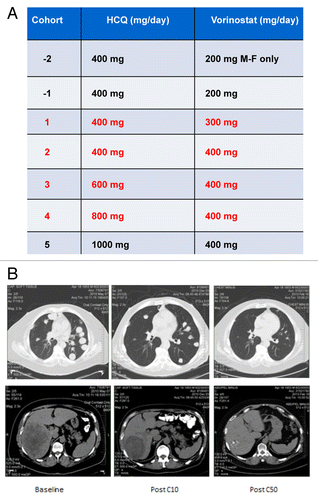
No dose-limiting toxicity (DLT) was observed in any of the patients enrolled in cohorts 1 (300 mg VOR and 400 mg HCQ, both drugs orally daily (po qd) or 2 (400 mg VOR and 400 mg HCQ), both drugs po qd. In cohort 3 (400 mg VOR po qd and 600 mg HCQ po qd), 1 of the 6 patients treated at this dose level experienced a DLT of grade 3 anemia and fatigue. Further dose escalation to cohort 4 (400 mg VOR po qd and 800 mg HCQ po qd) resulted in DLTs in 4 of the 8 treated patients. Grade 3 fatigue was observed in 3 of these patients and an additional patient without brain metastasis, experienced a clinically significant grade 2 seizure on cycle 1 d 8. The fatigue experienced by these patients was more severe than what would be expected with single agent VOR treatment and was therefore likely related to the addition of HCQ. Following a dose reduction to 400 mg VOR po qd and 600 mg HCQ po qd (dosing utilized for cohort 3), no additional DLTs were observed. 400 mg VOR and 600 mg HCQ was therefore defined as the MTD of this combination. Enrollment was subsequently expanded to include a total of 10 patients in the MTD cohort to allow for further evaluation of safety as well as preliminary efficacy. All observed AE are detailed in . Overall, treatment-related toxicities were generally mild to moderate: Grade 1 to 2 toxicities that were observed included: nausea (n = 11), diarrhea (n = 8), fatigue (n = 6), anorexia (n = 4), weight loss (n = 4), anemia (n = 4), and elevated creatinine (n = 4). Grade 3 toxicities included fatigue (n = 3), anemia (n = 1), thrombocytopenia (n = 1) and neutropenia (n = 1). These findings indicate that administration of VOR plus HCQ at the established MTD is safe and generally well tolerated.
Table 2. Most common adverse events suspected to be related to vorinostat and/or hydroxycholoroquine treatment
Tumor response
Although the primary objective of this phase I study was to evaluate safety, the preliminary antitumor activity of the combination of VOR and HCQ was also determined according to Response Evaluation Criteria for Solid Tumors (RECIST) 1.0 criteria.Citation17 All potential sites of tumor lesions were evaluated by CT and/or magnetic resonance imaging at baseline and were re-evaluated every 6 wk (2 cycles) for as long as patients remained active on this study. Two patients with NSCLC and STS achieved stable disease in cohort 1. Notably, one patient in cohort 2 with advanced (RCC) who had failed 7 lines of prior therapy achieved a durable confirmed partial response (PR) that has been maintained for more than 50 cycles of therapy. Representative tumor scan images illustrating this response are shown in . Additionally, one patient each with STS and ovarian cancer, with a further 2 patients with KRAS-mutated CRC treated in cohort 3 experienced prolonged stable disease of ≥ 4 cycles or 12 wk in duration . No responses were observed in cohort 4 and the patients enrolled in this cohort experienced DLTs and were withdrawn from the study. The preliminary efficacy observed in this study provides a rationale for further investigation of the combination in a larger number of patients, particularly those with RCC, CRC, or STS.
Table 3. Patients with partial response (PR) or stable disease (SD) for ≥ 2 cycles
Pharmacokinetics (PK)
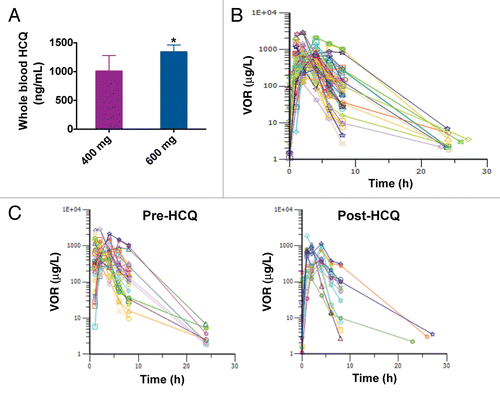
The primary objective of our PK analyses was to determine if the addition of HCQ significantly affected the PK profile of VOR. Peripheral blood was collected on cycle 2 d 20 to quantify the whole blood concentrations of HCQ. As expected, whole blood concentrations of HCQ were dose-dependent . Peripheral blood specimens were also collected to analyze the serum concentrations of VOR prior to dosing on cycle 1 d 1 and at 1, 2, 4, 6, 8, 24, and 48 h following the dose of VOR and also obtained on cycle 2 d 20 prior to treatment and then at 1, 2, 4, 6, 8, 24, and 48 h after dosing. Intensive sampling PK analysis and noncompartmental analyses were conducted to quantify the potential impact of HCQ on the PK profile of VOR by comparing pre- and post-HCQ specimens collected during this study with each other as well as comparing data obtained during the current study with published data detailing the PK properties of VOR.Citation18 The concentrations of VOR over time for all analyzed patients are presented in . The overall PK trends of VOR (median peak concentrations,Cmax = 768 µg/L pre-HCQ, 786 µg/L post-HCQ; median Vd/f = 309 L pre-HCQ, 304 L post-HCQ; median AUC = 3387 µg*hr/L pre-HCQ, 2410 µg*hr/L post-HCQ; median t1/2 = 2.06 h pre-HCQ, 1.3 h post-HCQ) , were not significantly different between pre- and post-HCQ specimens. Thus, HCQ does not appear to interfere with the PK of VOR.
Figure 2. The addition of HCQ does not significantly impact the pharmacokinetic profile of VOR. (A) Quantification of whole blood concentrations of HCQ. HCQ concentrations were determined as described in Patients and Methods. HCQ levels for patients that received 400 mg and 600 mg HCQ are shown. *Indicates P < 0.05. (B) Serum concentrations of VOR. The concentrations of VOR in the serum of patients enrolled on the study were quantified as detailed in Patients and Methods. Plot shows the time dependence of serum VOR levels (concentration vs. time). Numbers indicate the subject number. Post-HCQ concentration curves are marked with a (0.1) after the patient number. (C) Comparison of VOR levels over time in specimens collected pre- and post-HCQ treatment. Pre-HCQ VOR concentrations are plotted on the left (n = 30), post-HCQ VOR levels are plotted on the right (n = 14). Wilcoxon Signed Rank testing determined that the time-dependence of VOR concentrations was not significantly affected by the addition of HCQ.
Pharmacodynamics (PD)
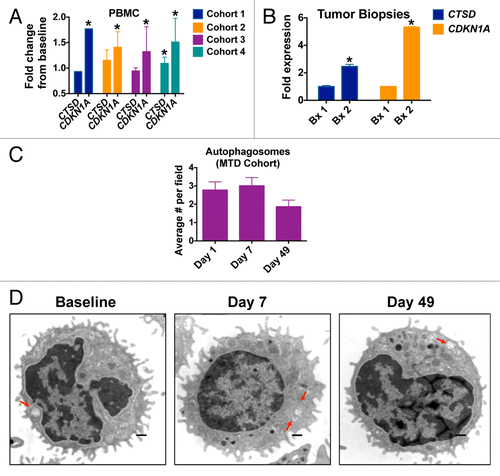
To quantify potential biomarkers and PD endpoints that we identified in our preclinical studies of the combination of VOR plus HCQ, peripheral blood specimens were collected from patients on d 1, 7, and 49 of treatment.Citation10,Citation16 Tumor biopsies were also obtained from 2 patients with CRC at baseline and post-treatment on d 49. Quantitative RT-PCR analyses revealed that significant increases in the levels of the cyclin-dependent kinase inhibitor 1A CDKN1A from baseline, an established biomarker of VOR, could be detected in PBMCs from patients in all 4 treatment cohorts . The levels of the lysosomal protease CTSD, which we previously showed to be a key mediator of CQ/HCQ and HCQ plus VOR-induced apoptosis, were only increased in patients in cohort 4 (400 mg VOR po qd plus 800 mg HCQ po qd). Considering that this dose level is above the MTD, these findings indicate that PBMC specimens may not be appropriate for monitoring of HCQ-driven correlative PD endpoints. In contrast, significant increases from baseline in both CDKN1A and CTSD were readily observed in tumor biopsy specimens obtained from 2 patients with CRC (one with unmutated RAS [Patient #1] and the other with mutant KRAS [Patient #2]) treated at the MTD of VOR plus HCQ . The patient with wild-type RAS had progressive disease after 2 cycles and the patient with the KRAS mutation had stable disease at cycle 2 and subsequently progressed after 4 cycles of therapy. Although the number of tumors that we were able to obtain for these analyses is small, our preliminary results suggest that tumor specimens may be more valuable than PBMCs with respect to quantifying treatment-related markers associated with autophagy inhibition. This possibility is further supported by our analyses of autophagic vacuoles (AV) in PBMCs. Notably, the number of AVs per cell in PBMC specimens collected from patients treated in the MTD cohort was not significantly affected by treatment with VOR and HCQ at any time points. A very modest, but statistically insignificant rise in the number of AVs/cell was noted on d 7. However, by d 49 this effect was gone and the mean AVs/cell was actually slightly below baseline levels .
Figure 3. HCQ and VOR stimulate the expression of CTSD and CDKN1A and the accumulation of autophagic vacuoles. (A) Fold change from baseline in the levels of CTSD and CDKN1A in PBMC specimens in individual cohorts. PBMC specimens were collected at baseline and on C1D7. Gene expression was quantified by qRT-PCR and normalized to GAPDH. *Indicates a significant change from baseline, P < 0.05. (B) Tumor biopsies were obtained from 2 patients with colorectal cancer at baseline and on d 49 (Patient #1 = unmutated RAS, Patient #2 = mutant KRAS). The fold change from baseline in the levels of CTSD and CDKN1A expression in tumor specimens was quantified by qRT-PCR and normalized to GAPDH. *Indicates a significant change from baseline, P < 0.05. (C and D) Effects of treatment on autophagic vacuoles. PBMC specimens were collected from patients at baseline and post-treatment on d 7 and 49. Transmission electron microscopy was utilized to visualize and quantify autophagic vacuoles in PBMCs. The average number of autophagic vacuoles per cell for patients enrolled in the MTD cohort (cohort 3) is shown in (C). Representative images for one patient’s specimens collected at baseline, d 7 and d 49 are shown in (D).
Based on these initial PD analyses, we focused additional assays on the tumor biopsy specimens collected at baseline and on d 49 from 2 of the patients with colorectal cancer that were treated on this study at the MTD. Interestingly, hematoxylin and eosin staining conducted to visualize tumor architecture indicated that the areas of tumor necrosis were more prevalent following treatment with VOR + HCQ as compared with baseline in tumors from both patients . This suggests that therapy-induced necrosis may contribute to the antitumor activity of HCQ plus VOR.
Figure 4. HCQ and VOR trigger intratumoral increases in the levels of CDKN1A, CTSD, and LC3-II. Effects of treatment on the expression of key biomarkers of HCQ and VOR in tumor specimens. Tumor biopsies were collected at baseline and post-treatment on d 49 from 2 patients with colorectal cancer (Patient #1 = unmutated RAS, Patient #2 = mutant KRAS). Immunohistochemistry was utilized to assess the levels of CDKN1A, CTSD, and LC3-II as described in Patients and Methods. Hematoxylin and eosin staining was conducted to visualize tumor architecture.
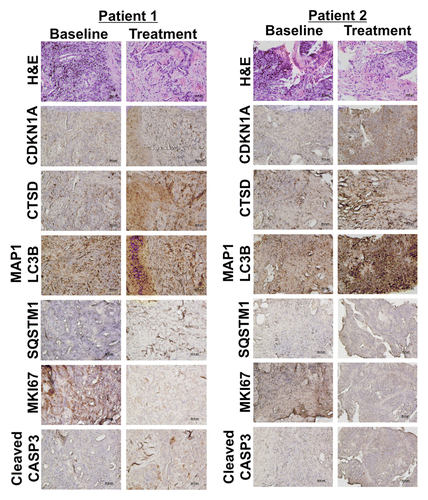
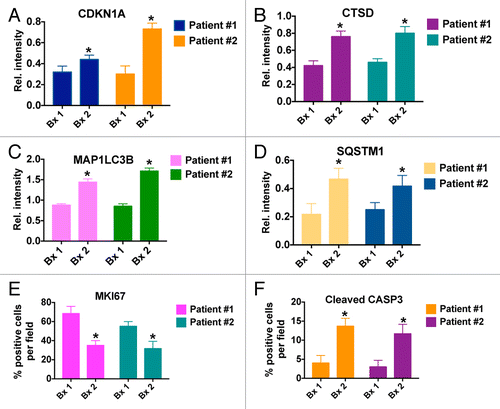
Immunohistochemistry (IHC) was utilized to quantify the levels of MKI67 (proliferation), active (cleaved) CASP3 (apoptosis), CDKN1A (biomarker of VOR effects), CTSD, SQSTM1, and MAP1LC3B (all biomarkers of HCQ effects) in tumor biopsies collected from both patients at baseline and post-treatment on d 49 . IHC images that were used for quantification were obtained from regions of tumor tissue that did not display high levels of necrotic cells in order to minimize potential complications with data interpretation. In agreement with our earlier preclinical studies, these analyses demonstrated significant increases from baseline in the levels of all 4 drug-related biomarkers (CDKN1A, SQSTM1, MAP1LC3B, and CTSD) as well as a general therapy-related decrease in tumor cell proliferation (MKI67) and an increase in apoptosis (active CASP3, ).Citation16 Notably, MAP1LC3B staining appeared to be largely punctate in nature. These results suggest that mouse xenografts may be useful models for the prediction and characterization of the PD effects of HCQ plus VOR in human tumors and . Collectively, our PD results indicate that while PBMC specimens may be adequate for assessment for biomarkers of VOR action, they appear to be largely uninformative for monitoring in vivo inhibition of autophagy at the HCQ doses that were achieved in this study. Although not as readily obtainable, tumor biopsies appear to be more valuable for the assessment of PD effects associated with autophagy inhibition.
Figure 5. Quantification of the effects of treatment with HCQ and VOR on the expression of CDKN1A (A), CTSD (B), MAP1LC3B (C), SQSTM1 (D), MKI67 (E), and active CASP3 (F). *Indicates a significant change from baseline, P < 0.05.
Discussion
Preclinical studies have demonstrated that inhibition of autophagy is a novel strategy to augment the activity of numerous standards of care anticancer agents and to overcome drug resistance.Citation5,Citation6 Since autophagy may promote survival via the recycling of cellular components to generate energy during periods of treatment-induced stress, it is not surprising that targeting autophagy could be broadly clinically useful. One class of anticancer agents that induce autophagy in multiple preclinical models is HDAC inhibitors. We and others have demonstrated that inhibition of autophagy leads to synergistic enhancement of the anticancer activity of HDAC inhibitors.Citation8,Citation9,Citation15,Citation16,Citation19-Citation21 These studies provided the foundation for the clinical evaluation of the autophagy inhibitor HCQ in combination with VOR as a potential novel therapy for advanced solid tumors. We selected 400 mg daily dosing for VOR in this study, which is frequently used for VOR administration. Other schedules of VOR that have been evaluated clinically include 200 mg twice per d for continuous daily dosing and 300 mg twice per d for 3 consecutive d per wk dosing if used as a single agent.Citation22
We established 600 mg HCQ po qd with 400 mg VOR po qd as the MTD and recommended phase II dose of this combination. Dose-limiting fatigue and gastrointestinal side effects were the most frequently observed AE in this study. Similar gastrointestinal AE were observed when HCQ was combined with temozolomide (Rosenfeld et al., this issueCitation23), bortezomib (Vogl et al., this issueCitation24), and temsirolimus (Rangwala et al., this issueCitation25). However, the severe fatigue that we observed with HCQ and VOR in this study did not occur in the aforementioned studies of other HCQ combinations. No significant toxicities were observed at the recommended phase II dose. Patients with NSCLC, STS, and CRC achieved stable disease in this study. In addition, a patient with RCC displayed a partial response and continues to be on study beyond 50 cycles of treatment. This is a promising result given that this patient had progressed following 7 lines of prior therapy. We are currently conducting an expansion study to further evaluate the safety and efficacy of this combination in additional patients with RCC and CRC.
Twelve treatment-refractory CRC patients were treated in this study of which 2 achieved stable disease. Interestingly, both of these patients had tumors with activating mutations in KRAS. This observation may be significant given that it has been previously reported in preclinical studies that mutations in RAS confer higher levels of basal autophagy.Citation26 Based on these findings, it has been suggested that cancers with RAS mutations may be “addicted” to autophagy and thus may be hypersensitive to autophagy inhibition. The enrollment of additional patients in our ongoing expansion study will allow us to further investigate this possibility.
PK analyses were performed to evaluate the potential effects of HCQ on the serum concentrations of VOR. As expected, no significant difference was observed in the PK parameters of VOR between pre- and post-HCQ treated patients. Considering that no drug-drug interaction between HCQ and VOR was apparent in this study, we conclude that the increased rate of grade 3 fatigue that we observed with this combination likely stems from the addition of HCQ rather than increased exposure to VOR.
We next evaluated the effects of HCQ plus VOR treatment on PD markers that we previously observed to be significantly induced in our preclinical studies focused on this combination. Induction of CDKN1A is commonly used as a marker of HDAC inhibition and was dramatically induced in preclinical models following exposure to VOR plus HCQ. Additionally, induction of the lysosomal protease CTSD was also established as a key downstream regulator of HCQ and VOR plus HCQ-triggered apoptosis in our preclinical investigations.Citation15,Citation16 We measured the expression of both of these factors using qRT-PCR in PBMC and tumor biopsy samples collected at baseline and following treatment with VOR plus HCQ. Consistent with prior preclinical findings, an increase in CDKN1A was observed following treatment with HCQ plus VOR in both PBMC specimens from all 4 treatment cohorts and tumor biopsy samples. CTSD levels were only elevated in PBMCs following treatment in cohort 4, which was established to be above the MTD and not recommended for further evaluation. Notably, significant therapy-associated induction of both of these genes was more pronounced in tumor biopsies than in PBMCs. Consistent with this finding, we did not observe a significant increase in AVs in PBMCs following VOR 400 mg po qd plus HCQ 600 mg po qd treatment. This is in contrast to a modest but significant increase in AV observed in PBMC in patients with glioma treated with temozolomide, whole brain radiation, and HCQ (Rosenfeld et al., this issueCitation23), suggesting that either the anticancer backbone may be important to elicit a significant signal in the PBMC-based EM assay or the sample size for the VOR and HCQ study was not powered to detect a significant therapy-associated increase in AV in PBMC. Collectively, these results suggest that PBMCs may not be ideal for the evaluation of biomarkers associated with autophagy inhibition and that future clinical trials focused on autophagy inhibitor-based therapeutic combinations should consider utilizing tumor specimens for correlative analysis of PD endpoints. To further explore this possibility, we conducted IHC analyses of paired pre- and post-treatment tumor specimens from 2 patients with CRC that were treated at the MTD. Our results demonstrated significant intratumoral increases in CDKN1A, SQSTM1, CTSD, and MAP1LC3B levels after drug treatment. Interestingly, tumor specimens displayed significant levels of basal MAP1LC3B expression, suggesting that these tumors may have constitutively active autophagy. Our findings are in agreement with a recent study that reported high basal MAP1LC3B expression in various advanced solid tumors.Citation27
At this time, CQ and its analog HCQ are the only clinically relevant autophagy inhibitors and they are currently being evaluated in more than 20 clinical trials for cancer therapy.Citation6 Our study provides one of the first reports of the clinical safety and preliminary efficacy of the inhibition of autophagy as a novel approach to augment the efficacy of conventional anticancer agents. Notably, our study demonstrates that the addition of HCQ to VOR is well tolerated and may be given safely to patients with advanced solid tumors. Our preliminary efficacy analyses also suggest that HCQ may augment the clinical activity of VOR. We are currently expanding our study to enroll additional patients with CRC and RCC to further evaluate the combination of HCQ and VOR in these tumor types.
While our study demonstrates that HCQ displays promising preliminary efficacy in combination with VOR, 2 major questions remain unanswered. First, it remains unclear how effective achievable doses of HCQ are at inhibiting autophagy in human tumors and whether this degree of autophagy inhibition is sufficient to significantly increase the efficacy of VOR and other anticancer agents that induce autophagy. It is also uncertain at this time whether the degree of therapy-induced autophagy disruption is directly linked to clinical sensitivity to HCQ-based regimens. Additional standardization of data interpretation and appropriate internal controls need to be established. For example, the best assay to quantify these effects in primary pre- and post-tumor biopsies and criteria for determining quantitatively what represents effective vs. ineffective autophagy inhibition need to be established. In addition to studies focused on addressing the aforementioned issues, major efforts are currently being invested in the identification and development of novel, more potent autophagy inhibitors. Lucanthone and Lys05 are 2 newly discovered autophagy inhibitors that have superior efficacy compared with HCQ and CQ in preclinical studies.Citation21,Citation28 It will be interesting to determine if these agents exhibit greater efficacy than HCQ in future clinical trials.
A second important unanswered question is related to the identification of patients that are most likely to benefit from therapy with autophagy inhibitors. In the current study, we observed a dramatic and durable response in a patient with RCC, stable disease in a few others, but the majority of the patients enrolled did not receive a significant benefit from treatment with VOR plus HCQ. Establishing a predictive biomarker associated with clinical sensitivity to autophagy inhibitors is essential for the optimal development of this class of drugs for cancer therapy. Preliminary data suggest that RAS mutations may potentially be a candidate, but other factors may also be critically important. Additional studies of a much larger number of patients treated on HCQ-based clinical trials may help to address this very important issue. Collectively, our findings demonstrate that inhibition of autophagy with HCQ is a novel and safe strategy that may augment the efficacy of VOR. Further investigation is warranted to more rigorously evaluate this possibility. The results of our study combined with those of our colleagues (Rosenfeld et al., this issueCitation23; Vogl et al., this issueCitation24; and Rangwala et al., this issueCitation25,Citation29) suggest that autophagy inhibition is a novel anticancer strategy with broad potential applications.
Patients and Methods
Patient population
Adult patients with histologically or cytologically confirmed advanced solid tumors that progressed despite standard therapy or for whom no standard therapy was available were eligible. Other key inclusion criteria were measurable or evaluable disease defined by RECIST 1.0.Citation17 Eastern Cooperative Oncology Group performance status ≤ 2; adequate bone marrow, liver, and kidney function (i.e., absolute neutrophil count ≥ 1000/mm3, platelets ≥ 75,000/mm3); creatinine ≤ 2 times the upper limits of normal; total bilirubin ≤ 1.5 mg/dL; alanine aminotransferase (ALT) and aspartate aminotransferase (AST) ≤ 3 times above the upper limits of the institutional norm alanine aminotransferase (aspartate aminotransferase can be < 5 times upper limits of normal if patients have hepatic involvement). Patients were excluded from participating if they had one or more of the following conditions: previously documented macular degeneration or diabetic retinopathy, uncontrolled brain metastases, QTc > 500 ms at baseline, clinically significant symptomatic hypercalcemia, or gastrointestinal dysfunction that might impair oral absorption of study medications. Patients with active, clinically significant and/or uncontrolled medical conditions were also excluded, including patients with uncontrolled psoriasis.
Protection of human research subjects
All patients provided written informed consent before enrollment. This study followed the ethical principles of the Declaration of Helsinki, the International Conference on Harmonization Guidelines for Good Clinical Practice, and local regulations (European Directive 2001/20/EC and US Code of Federal Regulations Title 21). The original protocol and all subsequent amendments were approved by the Institutional Review Board at the University of Texas Health Science Center at San Antonio.
Study design and HCQ dose escalation
This open label phase I single institution study of daily oral HCQ in combination with daily oral vorinostat (VOR) in patients with advanced solid tumors utilized a 3 + 3 dose escalation design.Citation30 VOR was administered with food as single agent on d 1 at the recommended FDA approved dose of 400 mg and continued daily through d 21. Oral HCQ treatment was initiated on d 2 with a starting phase I dose of 400 mg per d. Both drugs were continued daily thereafter. Three wk of treatment (21 d) was defined as one cycle of therapy. Cycles were repeated without interruption if the drug tolerance was acceptable. If toxicity occurred, treatment holidays were allowed at the discretion of the principal investigator. Three patients were treated at the starting dose and the dose was escalated in a stepwise fashion with expansion to a total of 6 patients if a dose-limiting toxicity (DLT) occurred in one or more patients. Prior to initiating accrual to the next dose level, all patients in a given cohort were required to complete the first 3 wk of treatment to permit toxicities to be assessed.
Evaluation of toxicities and determination of the maximum tolerated dose
The target DLT rate was ≤ 33%. The MTD was defined as the dose producing a DLT for 2 out of 6 patients; or a dose level below the dose which produced a DLT in ≥ 2 out of 6 patients. No intra-patient dose escalation occurred. Patients were evaluable for their cohort if they completed 80% of their expected dose of HCQ for the 3 wk of combined treatment. Patients who experienced a DLT were evaluable for their cohort after at least one dose of HCQ. A DLT was defined as a toxicity of the following nature that occurred during the first 6 wk (2 cycles) of treatment: 1) any nonhematologic adverse event (AE) of grade 3 or higher that was clinically significant and at least possibly treatment-related with the exception of nausea and vomiting, which were not treated with optimal antiemetic therapy; 2) a hematologic toxicity if any of the following occurred during the first 2 cycles of treatment: A) Grade 4 neutropenia that lasted more than 7 d, B) febrile neutropenia (grade 3 or 4) and C) platelet count (grade 4) less than 25,000/mm3. Any AE of ≥ grade 3 and attributed as possibly, probably or definitely related to HCQ and/or Vorinostat will result in the dose being held until the AE has resolved to ≤ grade 1 or baseline. If the AE resolves, reinstitution of treatment can occur per protocol outlined reduction (Table S1).
Safety and efficacy evaluations
Safety was assessed according to CTCAE version 3.0 guidelines.Citation31 Assessments included regular laboratory evaluations, physical examinations, vital signs, weight, and periodic electrocardiogram recordings. All patients were monitored for safety from the first dose until 28 d following the final dose. Additional monitoring included baseline ophthalmologic evaluation that was repeated if any visual disturbances occurred while a patient was on study. All potential sites of tumor lesions were evaluated by CT and/or magnetic resonance imaging at baseline and every 6 wk (2 cycles). Antitumor activity was determined according to RECIST 1.0.Citation17
Chemicals and reagents
Solvents and formic acid were LC-MS grade and purchased from Fluka Analytical (LC-MS CHROMASOLV®, 34688). Human serum and anticoagulated (lithium heparin) whole blood (single male donors) for standard curves and quality control samples were purchased from Biological Specialty Corporation (115-00). HCQ, VOR, VOR glucuronide, 4-anilino-4-oxobutanoic acid, deuterium-labeled (d5) internal standards for VOR and VOR glucuronide, and deuterium-labeled (d4) hydroxychloroquine were purchased from Toronto Research Chemicals (H916900, S688700, S688710, and A663950). The deuterium labeled (d5) internal standard for 4-anilino-4-oxobutanoic acid was generously provided by Merck Research Laboratories.
Determination of HCQ whole blood concentrations
Whole blood samples for HCQ analysis were collected in heparinized tubes prior to dosing on cycle 2 d 20, then transferred to a cryotube and frozen at −70 °C. For analysis, samples were thawed on ice and aliquots of 100 µL were mixed with 10 µL of internal standard (IS) (d4-HCQ), vortexed vigorously for 5 min with 400 µL of 90:10 acetonitrile/methanol, and then centrifuged at 4 °C for 15 min at 14,000 × g. A 350-µL aliquot of the supernatant fraction was withdrawn and dried under nitrogen gas. The samples were reconstituted with 100 µL of mobile phase (90:10:0.1% acetonitrile/water/formic acid), transferred to autosampler vials on a cooled autosampler (Agilent Technologies, Santa Clara, CA) (4 °C), and 10 µL of each specimen was injected onto the LC-MS/MS system. A 1200 Series Agilent HPLC system (Agilent Technologies, Santa Clara, CA) was used with an API 4000™ mass spectrometer (AB SCIEX, Concord, ON, Canada and electrospray interface operated in positive mode with multiple reaction monitoring detection. Samples were injected onto a Kinetex 50 mm × 3.0 mm, 2.6 um C18 100A HPLC column with SecurityGuard (Phenomenex, 008-4462-AN) and eluted with a gradient mobile phase of 0.1% formic acid in acetonitrile and water at 500 uL/min. The column was maintained at 40 °C using a thermostat column compartment. The capillary voltage was 4000 V with a source temperature of 500 °C. Mass spectrometer parameters were adjusted to maximize the intensity of the [M + H]+ ions in quadrupole 1 and the m/z transition ions of HCQ (337.275 → 248.152) and IS (341.150 → 252.035) in quadropole 3. The HPLC system and mass spectrometer were controlled by AB SCIEX Analyst® software (version 1.6.1) and data collection and analyses were conducted with the same software. Standard curves were constructed by plotting the analyte to IS ratio vs. the known concentration of HCQ (x) in each sample. Standard curves were fit by linear regression with weighting by 1/x. Samples were assayed in duplicate; samples for which the percent difference exceeded 15% were reanalyzed and samples for which concentrations exceeded the range values for the calibration curve were diluted appropriately and reanalyzed. The calibration curve was linear from 1 to 5000 ng/mL with correlation coefficients ranging from 0.9990 to 0.9999. The lower limit of quantitation was 1.0 ng/mL. The correlation coefficients for both inter- and intra-day variability were < 5.6% for each concentration (15 ng/mL, 750 ng/mL, and 1500 ng/mL) studied. The mean accuracy for inter- and intra-day evaluations was between 97.2 and 102%.
Determination of VOR serum concentrations
Peripheral blood samples were collected prior to dosing on cycle 1 d 1 and at 1, 2, 4, 6, 8, 24, and 48 following the dose of vorinostat and also obtained on cycle 2 d 20 prior to treatment and then at 1, 2, 4, 6, 8, 24, and 48 h after dosing. Blood samples were allowed to clot at room temperature for approximately 30 min and then centrifuged at 2,000 × g for 15 min at 4 °C. The resulting serum was transferred to a cryovial and frozen at −70 °C. For analysis, samples were thawed on ice and processed for protein precipitation and filtration using Phree Phospholipid Removal Plates (Phenomenex, 8B-S133-TAK). Aliquots of 200 µL of serum were pipetted and mixed into wells containing 800 µL of 99:1 acetonitrile/formic acid plus 10 µL of a mixture of deuterated internal standards to make a final concentration of 5 ng/mL d5-VOR. The plates were vortexed for 2 min, placed on a 96-sample manifold, and subjected to vacuum at 5 mmHg for 5 min to collect the filtrate. The filtrate collections were dried under nitrogen gas at 37 °C using a Biotage SPE Dry 96 evaporator. The samples were reconstituted with 100 µL of mobile phase (80:20:0.1% acetonitrile/water/formic acid), transferred to autosampler vials on a cooled autosampler (4 °C), and 10 µL was injected onto the LC-MS/MS system as described for HCQ. LC-MS/MS analysis was performed using a modified previously described method.Citation18 Mass spectrometer parameters were adjusted to maximize the intensity of the [M + H]+ ions in quadrupole 1 and the m/z transition ions of vorinostat (265.224 → 232.100) and d5-vorinostat (270.191 → 237.000) in quadropole 3. Standard curves were constructed by plotting the analyte to IS ratio vs. the known concentration of vorinostat (x) in each sample. Standard curves were fit by linear regression with weighting by 1/x. Samples were assayed in duplicate; samples for which the percent difference exceeded 15% were reanalyzed and samples for which concentrations exceeded the range values for the calibration curve were diluted appropriately and reanalyzed. The calibration curves were linear from 3 to 1000 ng/mL for all analytes with correlation coefficients of 0.997 for vorinostat. The lower limit of quantitation for each analyte was 3.0 ng/mL.
Pharmacokinetic analyses
VOR concentration vs. time data for each patient were fit using noncompartmental analysis using Phoenix™ WinNonlin 6.3. Peak concentrations and time to peak concentrations were determined by visual inspection of the data. The terminal elimination rate constants (λz) were determined by linear regression analysis of the terminal log-linear part of the concentration-time curve. The total area under the observed plasma concentration-time curve (AUC) and the area under the first moment curve values were calculated for each analyte from time zero to the last measured concentration, using the linear-log trapezoidal rule. AUC values were extrapolated from the last observed time point to infinity by dividing the last measured concentration by λz. Mean residence time was calculated from AUMC/AUC where AUMC represents the area under the first moment curve value. VOR apparent oral clearance was calculated by assessing Dose/AUC. VOR apparent steady-state volume of distribution was determined from the product of apparent oral clearance and mean residence time. Pharmacokinetic parameters for VOR were compared for VOR administered alone and in combination with HCQ. The ratios of AUC values of VOR were calculated for each patient and compared for VOR administered alone and in combination with HCQ.
Quantitative RT-PCR analyses
Total RNA was isolated from peripheral blood mononuclear cells or tumor cells using the RNeasy Plus Mini Kit (Qiagen Inc., 74104). RNA was treated with the TURBO DNA-free™ Kit (Ambion Inc., AM1907). First-strand cDNA synthesis was performed with the high capacity cDNA Reverse Transcription Kit (Applied Biosystems, 4368813). CTSD and CDKN1A transcripts were amplified using TaqMan® Gene expression assays as previously described.Citation21 The relative expression of each gene was calculated with the 2−ΔΔCt method using GAPDH as a housekeeping gene.Citation32
Immunohistochemistry
Pre- and post-treatment tumor biopsies were collected from 2 patients enrolled on this study. Tumor biopsies were fixed in formalin and subsequently embedded in paraffin. Paraffin-embedded tumor sections were deparaffinized in xylene, exposed to a graded series of alcohol, and rehydrated in PBS (pH 7.5). Heat-induced epitope retrieval was performed by microwaving slides in a citrate buffer for 5 min. A 3% hydrogen peroxide solution was used to block endogenous peroxides. Following this, slides were incubated in a protein block solution (5% horse serum and 1% goat serum (Gibco, 16050 and 16210) in PBS (Corning Cellgro, 21-031-CV) for 20 min. Slides were exposed to MAP1LC3B (Abcam, AB48394), CDKN1A (Cell Signaling Technologies, 2947), SQSTM1 (Abcam, AB91526), MKI67 (Cell Signaling Technologies, 9027), active CASP3 (Cell Signaling Technologies, 9661) and CTSD (Abcam, AB91526) antibodies diluted in the protein block solution at 4 °C overnight as previously described.Citation16 After washing with PBS, slides were incubated in the appropriate secondary antibody (Jackson Immunoresearch, 111-035-003) for 1 h at ambient temperature. Slides were incubated with 3,3′-diaminobenzidine (Dako, S1967) for 10 min to visualize positive reactions. Slides were rinsed with water and then briefly counterstained with Gill's hematoxylin solution (Sigma, GHS1128). Images were captured under 20× magnification with an Olympus fluorescent microscope equipped with a DP71 camera (Olympus, Center Valley, PA). MediaCybernetics Image-Pro Plus software Version 6.2.1 was used for image acquisition. ImageJ software was used for quantification of CDKN1A, CTSD, and LC3-II levels by densitometric analysis of 5 random fields and MKI67 and active CASP3 positive cells were quantified by manual counts of 5 random fields as previously described.Citation33
Quantification of autophagic vacuoles
Measurement of autophagic vesicle accumulation as a surrogate for autophagic flux was assessed in peripheral blood mononuclear cells (PBMCs) and serial tumor biopsies. Venous blood samples were collected in 2 BD Vacutainer® CPT tubes at the following time points: 1) cycle 1 d 1 pre-dose; 2) cycle 1 d 7 per dose (6 d of combined therapy); and 3) cycle 1 d 49 (48 d of combined therapy). Manufacturer’s instructions were followed to collect PBMC in 2 cell pellets. Cells obtained from PBMC pellet one were immediately fixed with 2% glutaraldehyde and stored at 4 °C until embedding. Embedding and image capture were performed as previously described.Citation34 For quantification of AV in PBMC using electron microscopy (JEOL-1010 transmission electron microscope, Tokyo, Japan), high-powered micrographs (10,000–12,000×) of 20 to 25 mononuclear cells from multiple distinct low-powered fields in each sample were obtained. Autophagic vacuoles were scored by 2 independent investigators who were masked to treatment time points. Morphological criteria for AV included 1) circularity, 2) contrast with structures that were white or lighter than the cytoplasm, 3) vacuoles with contents, 4) vacuoles > 200 nm in size and, 5) vacuoles > 200 nm interior to the plasma membrane. Vesicular structures with cristae characteristic of mitochondria in cross section were excluded. The average of 2 investigators counts are presented as mean ± standard error of the mean.
Statistical analysis
Potential differences in vorinostat serum concentrations pre- and post-HCQ treatment were assessed using the Wilcoxon signed rank test. All pharmacodynamic data sets (baseline vs. post-therapy) were analyzed using the Student t test with the assistance of GraphPad Prism Version 6. Differences between parameters were considered statistically significant at P < 0.05.
| Abbreviations: | ||
| AE | = | adverse event |
| AUC | = | area under the observed plasma concentration-time curve |
| AV | = | autophagic vacuoles |
| CQ | = | chloroquine |
| CRC | = | colorectal cancer |
| DLT | = | dose-limiting toxicity |
| HCQ | = | hydroxychloroquine |
| HDAC | = | histone deacetylase |
| IHC | = | immunohistochemistry |
| MTD | = | maximum tolerated dose |
| NSCLC | = | non-small cell lung cancer |
| PBMC | = | peripheral blood mononuclear cells |
| PD | = | pharmacodynamics |
| PK | = | pharmacokinetics |
| PO | = | orally |
| PR | = | partial response |
| QD | = | daily |
| RCC | = | renal cell carcinoma |
| RECIST | = | response evaluation criteria in solid tumors |
| RT-PCR | = | real-time polymerase chain reaction |
| STS | = | soft tissue sarcoma |
| VOR | = | vorinostat |
Additional material
Download Zip (125.6 KB)Disclosure of Potential Conflicts of Interest
No potential conflicts of interest were disclosed.
Acknowledgments
This research was supported by NIH grants R21CA139476 (FG) and P30CA054174 (TC). The authors would like to thank Merck, Inc. for providing vorinostat in support of this study.
References
- Rubinsztein DC, Codogno P, Levine B. Autophagy modulation as a potential therapeutic target for diverse diseases. Nat Rev Drug Discov 2012; 11:709 - 30; http://dx.doi.org/10.1038/nrd3802; PMID: 22935804
- Yang Z, Klionsky DJ. Mammalian autophagy: core molecular machinery and signaling regulation. Curr Opin Cell Biol 2010; 22:124 - 31; http://dx.doi.org/10.1016/j.ceb.2009.11.014; PMID: 20034776
- White E. Deconvoluting the context-dependent role for autophagy in cancer. Nat Rev Cancer 2012; 12:401 - 10; http://dx.doi.org/10.1038/nrc3262; PMID: 22534666
- Janku F, McConkey DJ, Hong DS, Kurzrock R. Autophagy as a target for anticancer therapy. Nat Rev Clin Oncol 2011; 8:528 - 39; http://dx.doi.org/10.1038/nrclinonc.2011.71; PMID: 21587219
- Amaravadi RK, Lippincott-Schwartz J, Yin XM, Weiss WA, Takebe N, Timmer W, DiPaola RS, Lotze MT, White E. Principles and current strategies for targeting autophagy for cancer treatment. Clin Cancer Res 2011; 17:654 - 66; http://dx.doi.org/10.1158/1078-0432.CCR-10-2634; PMID: 21325294
- Carew JS, Kelly KR, Nawrocki ST. Autophagy as a target for cancer therapy: new developments. Cancer Manag Res 2012; 4:357 - 65; PMID: 23091399
- Carew JS, Nawrocki ST, Cleveland JL. Modulating autophagy for therapeutic benefit. Autophagy 2007; 3:464 - 7; PMID: 17495516
- Carew JS, Giles FJ, Nawrocki ST. Histone deacetylase inhibitors: mechanisms of cell death and promise in combination cancer therapy. Cancer Lett 2008; 269:7 - 17; http://dx.doi.org/10.1016/j.canlet.2008.03.037; PMID: 18462867
- Shao Y, Gao Z, Marks PA, Jiang X. Apoptotic and autophagic cell death induced by histone deacetylase inhibitors. Proc Natl Acad Sci U S A 2004; 101:18030 - 5; http://dx.doi.org/10.1073/pnas.0408345102; PMID: 15596714
- Carew JS, Nawrocki ST, Giles FJ, Cleveland JL. Targeting autophagy: a novel anticancer strategy with therapeutic implications for imatinib resistance. Biologics 2008; 2:201 - 4; PMID: 19707354
- Spiegel S, Milstien S, Grant S. Endogenous modulators and pharmacological inhibitors of histone deacetylases in cancer therapy. Oncogene 2012; 31:537 - 51; PMID: 21725353
- Lane AA, Chabner BA. Histone deacetylase inhibitors in cancer therapy. J Clin Oncol 2009; 27:5459 - 68; http://dx.doi.org/10.1200/JCO.2009.22.1291; PMID: 19826124
- Robey RW, Chakraborty AR, Basseville A, Luchenko V, Bahr J, Zhan Z, Bates SE. Histone deacetylase inhibitors: emerging mechanisms of resistance. Mol Pharm 2011; 8:2021 - 31; http://dx.doi.org/10.1021/mp200329f; PMID: 21899343
- Lee JH, Choy ML, Marks PA. Mechanisms of resistance to histone deacetylase inhibitors. Adv Cancer Res 2012; 116:39 - 86; http://dx.doi.org/10.1016/B978-0-12-394387-3.00002-1; PMID: 23088868
- Carew JS, Nawrocki ST, Kahue CN, Zhang H, Yang C, Chung L, Houghton JA, Huang P, Giles FJ, Cleveland JL. Targeting autophagy augments the anticancer activity of the histone deacetylase inhibitor SAHA to overcome Bcr-Abl-mediated drug resistance. Blood 2007; 110:313 - 22; http://dx.doi.org/10.1182/blood-2006-10-050260; PMID: 17363733
- Carew JS, Medina EC, Esquivel JA 2nd, Mahalingam D, Swords R, Kelly K, Zhang H, Huang P, Mita AC, Mita MM, et al. Autophagy inhibition enhances vorinostat-induced apoptosis via ubiquitinated protein accumulation. J Cell Mol Med 2010; 14:2448 - 59; http://dx.doi.org/10.1111/j.1582-4934.2009.00832.x; PMID: 19583815
- Therasse P, Arbuck SG, Eisenhauer EA, Wanders J, Kaplan RS, Rubinstein L, Verweij J, Van Glabbeke M, van Oosterom AT, Christian MC, et al. New guidelines to evaluate the response to treatment in solid tumors. European Organization for Research and Treatment of Cancer, National Cancer Institute of the United States, National Cancer Institute of Canada. J Natl Cancer Inst 2000; 92:205 - 16; http://dx.doi.org/10.1093/jnci/92.3.205; PMID: 10655437
- Parise RA, Holleran JL, Beumer JH, Ramalingam S, Egorin MJ. A liquid chromatography-electrospray ionization tandem mass spectrometric assay for quantitation of the histone deacetylase inhibitor, vorinostat (suberoylanilide hydroxamicacid, SAHA), and its metabolites in human serum. J Chromatogr B Analyt Technol Biomed Life Sci 2006; 840:108 - 15; http://dx.doi.org/10.1016/j.jchromb.2006.04.044; PMID: 16725386
- Torgersen ML, Engedal N, Bøe SO, Hokland P, Simonsen A. Targeting autophagy potentiates the apoptotic effect of histone deacetylase inhibitors in t(8;21) AML cells. Blood 2013; 122:2467 - 76; http://dx.doi.org/10.1182/blood-2013-05-500629; PMID: 23970379
- Rao R, Balusu R, Fiskus W, Mudunuru U, Venkannagari S, Chauhan L, Smith JE, Hembruff SL, Ha K, Atadja P, et al. Combination of pan-histone deacetylase inhibitor and autophagy inhibitor exerts superior efficacy against triple-negative human breast cancer cells. Mol Cancer Ther 2012; 11:973 - 83; http://dx.doi.org/10.1158/1535-7163.MCT-11-0979; PMID: 22367781
- Carew JS, Espitia CM, Esquivel JA 2nd, Mahalingam D, Kelly KR, Reddy G, Giles FJ, Nawrocki ST. Lucanthone is a novel inhibitor of autophagy that induces cathepsin D-mediated apoptosis. J Biol Chem 2011; 286:6602 - 13; http://dx.doi.org/10.1074/jbc.M110.151324; PMID: 21148553
- Kelly WK, O’Connor OA, Krug LM, Chiao JH, Heaney M, Curley T, MacGregore-Cortelli B, Tong W, Secrist JP, Schwartz L, et al. Phase I study of an oral histone deacetylase inhibitor, suberoylanilide hydroxamic acid, in patients with advanced cancer. J Clin Oncol 2005; 23:3923 - 31; http://dx.doi.org/10.1200/JCO.2005.14.167; PMID: 15897550
- Rosenfeld MR, Ye X, Supko JG, Desideri S, Grossman SA, Brem S, Mikkelson T, Wang D, Chang YC, Hu J, et al. A phase I/II trial of hydroxychloroquine in conjunction with radiation therapy and concurrent and adjuvant temozolomide in patients with newly diagnosed glioblastoma multiforme. Autophagy 2014; 10:1359 - 68; http://dx.doi.org/10.4161/auto.28984; PMID: 24991840
- Vogl DT, Stadtmauer EA, Tan KS, Heitjan DF, Davis LE, Pontiggia L, Rangwala R, Piao S, Chang YC, Scott EC, et al. Combined autophagy and proteasome inhibition: A phase 1 trial of hydroxychloroquine and bortezomib in patients with relapsed/refractory myeloma. Autophagy 2014; 10:1380 - 90; http://dx.doi.org/10.4161/auto.29264; PMID: 24991834
- Rangwala R, Chang YC, Hu J, Algazy KM, Evans TL, Fecher LA, Schuchter LM, Torigian DA, Panosian JT, Troxel AB, et al. Combined MTOR and autophagy inhibition: Phase I trial of hydroxychloroquine and temsirolimus in patients with advanced solid tumors and melanoma. Autophagy 2014; 10:1391 - 402; http://dx.doi.org/10.4161/auto.29119; PMID: 24991838
- Guo JY, Chen HY, Mathew R, Fan J, Strohecker AM, Karsli-Uzunbas G, Kamphorst JJ, Chen G, Lemons JM, Karantza V, et al. Activated Ras requires autophagy to maintain oxidative metabolism and tumorigenesis. Genes Dev 2011; 25:460 - 70; http://dx.doi.org/10.1101/gad.2016311; PMID: 21317241
- Lazova R, Camp RL, Klump V, Siddiqui SF, Amaravadi RK, Pawelek JM. Punctate LC3B expression is a common feature of solid tumors and associated with proliferation, metastasis, and poor outcome. Clin Cancer Res 2012; 18:370 - 9; http://dx.doi.org/10.1158/1078-0432.CCR-11-1282; PMID: 22080440
- McAfee Q, Zhang Z, Samanta A, Levi SM, Ma XH, Piao S, Lynch JP, Uehara T, Sepulveda AR, Davis LE, et al. Autophagy inhibitor Lys05 has single-agent antitumor activity and reproduces the phenotype of a genetic autophagy deficiency. Proc Natl Acad Sci U S A 2012; 109:8253 - 8; http://dx.doi.org/10.1073/pnas.1118193109; PMID: 22566612
- Rangwala R, Leone R, Chang YC, Fecher LA, Schuchter LM, Kramer A, Tan KS, Heitjan DF, Rodgers G, Gallagher M, et al. Phase I trial of hydroxychloroquine with dose-intense temozolomide in patients with advanced solid tumors and melanoma. Autophagy 2014; 10:1369 - 79; http://dx.doi.org/10.4161/auto.29118; PMID: 24991839
- Lin Y, Shih WJ. Statistical properties of the traditional algorithm-based designs for phase I cancer clinical trials. Biostatistics 2001; 2:203 - 15; http://dx.doi.org/10.1093/biostatistics/2.2.203; PMID: 12933550
- Trotti A, Colevas AD, Setser A, Rusch V, Jaques D, Budach V, Langer C, Murphy B, Cumberlin R, Coleman CN, et al. CTCAE v3.0: development of a comprehensive grading system for the adverse effects of cancer treatment. Semin Radiat Oncol 2003; 13:176 - 81; http://dx.doi.org/10.1016/S1053-4296(03)00031-6; PMID: 12903007
- Pfaffl MW. A new mathematical model for relative quantification in real-time RT-PCR. Nucleic Acids Res 2001; 29:e45; http://dx.doi.org/10.1093/nar/29.9.e45; PMID: 11328886
- Carew JS, Nawrocki ST, Reddy VK, Bush D, Rehg JE, Goodwin A, Houghton JA, Casero RA Jr., Marton LJ, Cleveland JL. The novel polyamine analogue CGC-11093 enhances the antimyeloma activity of bortezomib. Cancer Res 2008; 68:4783 - 90; http://dx.doi.org/10.1158/0008-5472.CAN-07-6483; PMID: 18559525
- Amaravadi RK, Yu D, Lum JJ, Bui T, Christophorou MA, Evan GI, Thomas-Tikhonenko A, Thompson CB. Autophagy inhibition enhances therapy-induced apoptosis in a Myc-induced model of lymphoma. J Clin Invest 2007; 117:326 - 36; http://dx.doi.org/10.1172/JCI28833; PMID: 17235397