
Abstract
Yersinia pseudotuberculosis can replicate inside macrophages by hijacking autophagy and blocking autophagosome acidification. In bone marrow-derived macrophages, the bacteria are mainly observed inside double-membrane vacuoles positive for LC3, a hallmark of autophagy. Here, we address the question of the membrane traffic during internalization of Yersinia investigating the role of vesicle- associated membrane proteins (VAMPs). First, we show that as in epithelial cells, Yersinia pseudotuberculosis replicates mainly in nonacidic LC3-positive vacuoles. Second, in these cells, we unexpectedly found that VAMP3 localizes preferentially to Yersinia-containing vacuoles (YCVs) with single membranes using correlative light-electron microscopy. Third, we reveal the precise kinetics of VAMP3 and VAMP7 association with YCVs positive for LC3. Fourth, we show that VAMP7 knockdown alters LC3′s association with single-and multimembrane-YCVs. Finally, in uninfected epithelial cells stimulated for autophagy, VAMP3 overexpression and knockdown led respectively to a lower and higher number of double-membrane, LC3-positive vesicles. Hence, our results highlight the role that VAMPs play in selection of the pathways leading to generation of ultrastructurally different LC3 compartments and pave the way for determining the full set of docking and fusion proteins involved in Yersinia pseudotuberculosis’ intravesicular life cycle.
Introduction
Autophagy is an evolutionarily conserved mechanism for cellular self-digestion that can be involved in the host’s immune response against microbial infection.Citation1-Citation4 This pathway is conventionally described as comprising several steps in which cytoplasmic constituents or pathogens are sequestered within double-membrane vesicles called autophagosomes. The luminal contents are then degraded through fusion with lysosomes.Citation5 Three main “classical” autophagy pathways have been described: macro-autophagy, microautophagy, and chaperone-mediated autophagy.Citation6 Macroautophagy is characterized by the hierarchically ordered activity of autophagy-related (ATG) proteins. The yeast Atg8 protein, whose mammalian ortholog is microtubule-associated protein light chain 3 (MAP1LC3, abbreviated as LC3 in the text) is generally considered to be the hallmark of autophagosomes, when present in its cleaved and lipidated form (LC3-II).Citation7-Citation9 It is important to note that LC3 can also be recruited to single-membrane phagosomes via a process called LC3-associated phagocytosis (LAP).Citation10-Citation12 Indeed, it has been shown that phagocytosis of toll-like receptors in murine macrophages triggers LC3 recruitment to phagosomes; this process requires BECN1/Beclin1, PIK3C3/VPS34, ATG5, and ATG7 but not the autophagy protein ULK1.Citation11,Citation13 This internalization process enhances the formation of an LC3-positive compartment capable of delivering engulfed bacteria to lysosomes.Citation12,Citation14,Citation15 It has been shown that during infection, Listeria monocytogenes expressing low levels of listeriolysin O is not prone to phagosome escape and resides in single-membrane, LC3-positive, spacious Listeria-containing phagosomes.Citation16 Thus, one of the main features of autophagy is the dynamic rearrangement of cell membrane structures via multiple membrane fusion events. Soluble N-ethylmaleimide-sensitive factor attachment protein receptors (SNAREs) are known to play a key role in the docking and subsequent fusion of intracellular membranes.Citation17 The membrane fusion of vacuoles is dependent on a SNARE complex composed of v/R-SNARE and t/Q-SNARE.Citation18 In fact, SNARE proteins are classified according to whether the central amino acid in the SNARE motif is arginine (R) or glutamine (Q) (yielding R-SNAREs and Q-SNAREs, respectively)Citation19 and whether they are located on the acceptor compartment (as target-SNAREs (t-SNAREs)) or on the donor membrane (vesicular-SNAREs, also known as v-SNAREs). The latter family includes vesicle-associated membrane proteins (VAMPs), in which glutamine is a central amino acid of the SNARE motif.Citation20 Studies in yeast have highlighted the involvement of SNAREs at several points in autophagy but the sequence of recruitment remains unknown. It is thought that Vam3 and Vam7 SNAREs are involved in the fusion between the autophagosome and the lysosome.Citation21,Citation22 Tlg2, Sec22, Ykt6, and Sso1-Sec9 are also reportedly involved in autophagosome biogenesis via Atg9 transport.Citation23 Moreover, it has been reported that 2 mammalian v/R-SNAREs (VAMP3 and VAMP7) are involved in specific autophagy steps.Citation24 VAMP3 regulates amphisome formation by controlling the fusion between multivesicular bodies and autophagosomesCitation24 and participates in autophagy by the fusion of ATG9-containing vesicles.Citation25 VAMP7 is required for autophagosome biogenesisCitation26 and lysosome fusion events.Citation24,Citation27 Mizushima and collaborators also highlight the fact that t/Q-SNARE STX17 and SNAP29 bind to the v/R-SNARE VAMP8 and are required for fusion between the endosomal/lysosomal membrane and autophagosomal membrane and thus are involved in the degradation steps of autophagy.Citation28-Citation30 In contrast, VAMPs 3, 7, and 8 reportedly have a role in the intracellular trafficking of pathogenic bacteria such as the Chlamydiae.Citation31 Moreover, VAMP7 is involved in phagosome formation during infection by Helicobacter pylori whereas VAMP3 is involved in phagosome maturation upon Mycobacterium tuberculosis infection.Citation32,Citation33
We have previously reported that Y. pseudotuberculosis is able to survive in murine bone marrow-derived macrophages (BMDMs) by hijacking autophagy and impairing the acidification of autophagosomes.Citation34 Yersinia are degraded if ATG5 is knocked down or if an ATG4B mutant is overexpressed.Citation34 These findings are consistent with autophagy providing a replicative niche for this pathogen.Citation34 The membrane fusion events leading to the formation and the growth of bacteria-containing vacuoles remained to be addressed. In the present study, we investigated the intracellular trafficking of Y. pseudotuberculosis in epithelial cells and compared with macrophages focusing on the involvement of SNAREs in these processes. To date, for the first time, we unveil the role played by VAMP3 in the formation of single-membrane LC3-positive vacuoles. Moreover, we reveal the kinetics of VAMP3 and VAMP7 recruitment to bacteria-containing vacuoles positive for LC3. Finally, we highlight the involvement of VAMP7 in the recruitment of LC3 to YCVs.
Results
In epithelial cells, Yersinia pseudotuberculosis replicates inside LC3-positive vacuoles
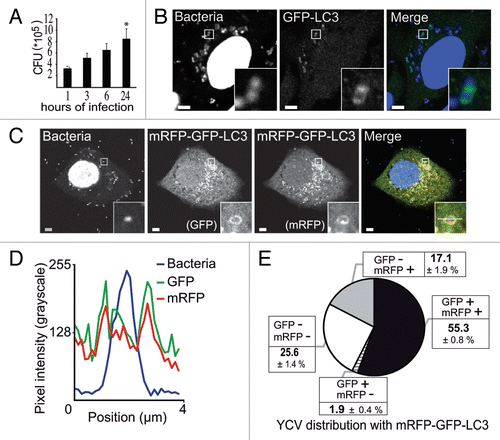
Following on our finding that Y. pseudotuberculosis is able to replicate inside nonacidic autophagosomes in BMDMs,Citation34 we sought to determine whether this bacterium can also replicate inside epithelial cells. We found that the number of colony forming units (corresponding to intracellular bacteria) increased by a factor of 2.5 between 1 h and 24 h postinfection (); this result confirmed an earlier reportCitation35 that Y. pseudotuberculosis can replicate in HeLa cells. To determine whether autophagy is involved in Yersinia infection, we analyzed the distribution of the autophagy marker LC3 and observed its recruitment to Yersinia-containing vacuoles (YCVs). When studying HeLa cells stably expressing GFP-LC3, a confocal laser scanning microscopy (CLSM) analysis 4 h after infection with Y. pseudotuberculosis showed that GFP-LC3 and YCVs codistributed (). We then investigated the maturation of LC3-positive vacuoles containing Y. pseudotuberculosis. First (in order to monitor the acidification of YCVs), we infected HeLa cells stably expressing the mRFP-GFP-LC3 construct. The disappearance of the GFP signal following protonation enables acidic compartments to be identified, whereas the presence of both mRFP and GFP signals indicates the presence of a nonacidic compartment.Citation36 Coupling these markers to LC3 enabled the fate of LC3-positive vesicles to be tracked. Our observation of both GFP and mRFP signals () suggested that autophagosomes could not fuse with lysosomes. The line profile () revealed correlated increases in GFP and mRFP intensities on either sides of the bacterium. These results suggested the presence of a pool of Y. pseudotuberculosis located inside nonacidic, LC3-positive vacuoles. We found that 55.3 ± 0.8%, of Y. pseudotuberculosis resided inside vacuoles positive for both fluorescent proteins (). About 25% of bacteria were not labeled and may thus have been extracellular bacteria (probably killed by gentamycin treatment), bacteria not yet committed to the autophagy pathway and/or bacteria within phagosomes. Indeed, 15.7 ± 4.7% of bacteria were targeted to a LysoTracker-positive compartment corresponding to the phagosome-lysosomal pathway (Fig. S1A). Relatively few bacteria were targeted to autophagy-dependent degradation, since 17.1 ± 1.9% were located in an mRFP-positive but GFP-negative vacuole. Lastly, the mRFP-negative and GFP-positive profiles might correspond to background noise or a tiny pool of nonfunctional mRFP proteins. As infection proceeds, we observe an increase of LC3-positive YCVs as shown in Figure S1B. Taken as a whole, our data suggest that Y. pseudotuberculosis is able to replicate inside nonacidic, LC3-positive vacuoles in epithelial cells. We then wanted to investigate the ultrastructure of these LC3-positive YCVs.
Figure 1.Yersinia pseudotuberculosis resides in nonacidic, LC3-positive compartments. (A) Intracellular replication of Y. pseudotuberculosis inside HeLa cells. Colonies were counted 1, 3, 6, and 24 h after infection. Data represent the mean ± SEM of 3 independent experiments. (B) HeLa cells transiently expressing GFP-LC3 were infected with wild-type Y. pseudotuberculosis for 4 h and processed for CLSM. Bacteria were visualized after staining with DAPI. The insert shows bacteria inside a LC3-positive vacuole. Scale bars: 5 µm. Insert magnification: 5×. (C) Bacteria contained in LC3-vacuoles do not reach an acidified compartment. HeLa stably expressing mRFP-GFP-LC3 were infected with Y. pseudotuberculosis for 4 h and processed for CLSM. Bacteria were visualized after staining with DAPI. The insert shows a bacterium inside an mRFP-GFP-LC3 vacuole. Scale bars: 5 µm. Insert magnification: 5×. The fluorescence profile along the white line in the image insert is shown in the lower left corner (D). (E) The distribution of bacteria is plotted as a function of GFP-LC3 and mRFP-LC3 labeling. In each experiment, at least 50 cells infected by Y. pseudotuberculosis during 4 h were quantified in a double-blind analysis. Data are displayed as the mean ± SEM from at least 3 independent experiments.
Y. pseudotuberculosis is contained within nonacidic, LC3-positive, single-membrane vacuoles in epithelial cells
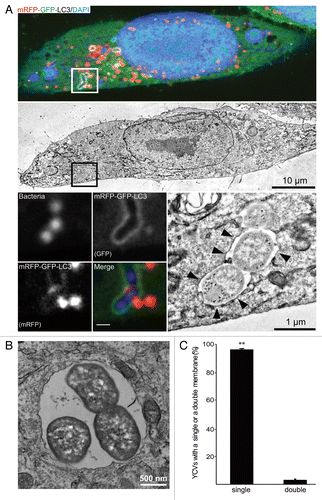
Having observed the recruitment of LC3 to YCVs in epithelial cells, we went on to characterize these organelles in an ultrastructural analysis. We had previously shown that Y. pseudotuberculosis can reside in LC3-positive, double-membrane autophagosomes in BMDMs.Citation34 To this end, we performed correlative light-electron microscopy (CLEM) on HeLa cells stably expressing an mRFP-GFP-LC3 construct and that had been infected for 4 h with Y. pseudotuberculosis. In CLSM, the YCVs displayed the mRFP and GFP fluorescence associated with LC3 (insert, )—thus confirming the bacteria’s location within nonacidic, LC3-positive vacuoles (; ). However, the CLEM analysis showed that these bacteria were present within single-membrane vacuoles and not the double-membrane vacuoles associated with “classical” autophagy (). We confirmed this observation by performing a quantitative analysis of YCV profiles (). Moreover, we monitored the vacuoles’ ultrastructural features during infection. Y. pseudotuberculosis was mainly found inside single-membrane vacuoles (from 30 min p.i. onwards and as late as 24 h p.i.; data not show). Indeed, 96 ± 0.5% of YCVs presented only a single membrane at 4 h postinfection (). We checked these results in HeLa cells not expressing the mRFP-GFP-LC3 construct (data not shown). We also confirmed that Y. pseudotuberculosis can replicate inside single-membrane vacuoles, since the number of bacteria increased during infection and a replicative profile could be observed (). These results were reminiscent of LAP and (in view of our previous results in macrophages) suggested that Y. pseudotuberculosis is capable of replicating within several different types of LC3-positive vacuoles, autophagosomes inside BMDMs and LAPs in HeLa cells. Given that the bacteria replicate, the LC3-positive vacuoles should be supplied with incoming membranes. Considering the topology of the LC3 location on the limiting membrane, in order to ascertain the acidification status of the YCVs, we decided to perform a double labeling using the GFP-LC3 protein and the LysoTracker® Red (Fig. S1C and S1D). We observed that 44.5 ± 5.9% of YCVs were LC3-positive and negative for the LysoTracker® Red demonstrating that these single membrane YCVs were nonacidic. Due to the SNAREs’ role in membrane trafficking, our findings prompted us to investigate the proteins’ involvement in Yersinia’s intracellular life cycle.
Figure 2.Yersinia pseudotuberculosis is contained within single-membrane, nonacidic, LC3-positive vacuoles. (A) HeLa cells stably expressing mRFP-GFP-LC3 were infected with Y. pseudotuberculosis for 4 h and then processed for CLEM. Bacteria were visualized after staining with DAPI. The upper panel shows a single HeLa cell observed by CLSM and the middle panel shows the corresponding TEM image. The lower left images show bacteria inside an mRFP-GFP-LC3 vacuole (insert magnification: 8×). The lower right image shows bacteria contained inside a single-membrane vacuole (arrowheads). (B) Bacteria dividing inside a single-membrane vacuole, as visualized by TEM. HeLa cells stably expressing mRFP-GFP-LC3 were infected with Y. pseudotuberculosis for 4 h and then processed for electron microscopy. (C) A quantitative TEM analysis of YCVs with single or double membranes. Values are quoted as the mean ± SEM from 3 independent experiments in which at least 20 HeLa cells stably expressing mRFP-GFP-LC3 were analyzed.
VAMP3 and VAMP7 are sequentially recruited to LC3-positive and single-membrane YCVs in epithelial cells
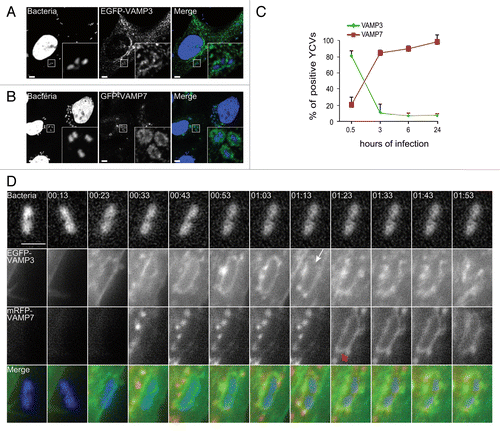
We focused on 2 t-SNAREs (VAMP3 and VAMP7), reportedly involved in the autophagy pathway.Citation24 Following infection of HeLa cells, EGFP-VAMP3 and GFP-VAMP7 codistributed with Y. pseudotuberculosis (). We then characterized the time course of recruitment as the infection proceeded. Thirty min after the entry of Yersinia into HeLa cells, we found that about 80% of YCVs were labeled with VAMP3 (; Vid. S1); however, this phenomenon was transient because VAMP3 started to dissociate from the YCVs after 30 min (, white arrow and Vid. S1). At the same time, VAMP7 began to be recruited to YCVs (; Vid. S1). We saw that VAMP7-positive vacuoles migrated and then fused with YCVs (red arrows in and Vid. S1). After 4 h of infection, the majority of YCVs displayed VAMP7 labeling. The protein remained bound to YCVs for 24 h postinfection (p.i.) (). In order to analyze the role of LC3 recruitment and the LAP pathway in bacterial replication, we performed knockdown expression of ATG5, VAMP3 and VAMP7 using siRNA treatments against their respective mRNAs. We observed a decrease of bacterial replication upon either treatment (Fig. S2A–S2D). Our results thus reveal the sequential recruitment of VAMP3 and then VAMP7 to YCVs and suggest that these v-SNAREs are involved in the LAP pathway used by Y. pseudotuberculosis in epithelial cells.
Figure 3. VAMP3 and VAMP7 associate with YCVs. (A) HeLa cells transiently expressing an EGFP-VAMP3 chimera were infected with Y. pseudotuberculosis for 45 min and then processed for CLSM. Bacteria (blue) are contained in EGFP-VAMP3-positive vacuoles. Scale bar: 5 µm. Insert magnification: 5×. (B) HeLa cells transiently expressing a GFP-VAMP7 chimera were infected with Y. pseudotuberculosis for 4 h and then processed for CLSM. Bacteria (blue) are contained in mRFP-VAMP7-positive vacuoles. Scale bar: 5 µm. Insert magnification: 5×. (C) A time-series acquisition of VAMP3 and VAMP7 proteins on YCVs during infection. Data represent average percentages of YCVs positive for the considered protein (in 3 independent experiments and after the analysis of 50 transfected, infected cells per experiment). (D) HeLa cells transiently expressing EGFP-VAMP3 (green) and mRFP-VAMP7 (red) were infected for 3 h and 33 min with Y. pseudotuberculosis. Bacteria were stained with DAPI (DNA, blue). Panels show series of images from Video S1 showing the migration of EGFP-VAMP3 and mRFP-VAMP7 proteins around a YCV. The white arrow indicates dissociation of VAMP3 from the YCV. Red arrows indicate VAMP7 vesicles heading to fusion with the YCV. At 1:23, the YCV displays VAMP7 on its surface as a result of these fusions. Acquisition times are indicated in the lower left corner (h:min). Scale bar: 5 µm.
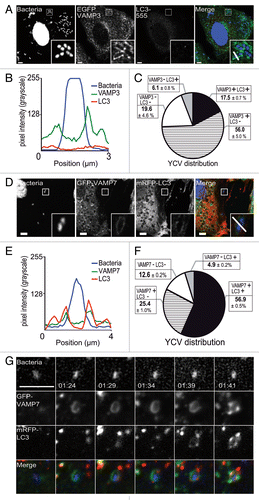
In view of the subsequent recruitment of LC3, we wanted to know when it was coming into the sequence. HeLa cells transiently expressing EGFP-VAMP3 were infected with Y. pseudotuberculosis for 30 min before fixation. Next, the distribution of LC3 was examined by CLSM. We found that 56.0 ± 5.0% of YCVs were positive for EGFP-VAMP3 but negative for LC3 (). In contrast, only 17.5 ± 0.7% of YCVs presented both EGFP-VAMP3 and mRFP-LC3 signals and only a tiny pool displayed the LC3 signal but not the VAMP3 signal (). Neither signal could be detected in 19.6 ± 4.6% of YCVs (). On the basis of these results, we concluded that VAMP3 was recruited upstream of LC3. We performed similar experiments on HeLa cells transiently expressing the GFP-VAMP7 and mRFP-LC3 constructs. After 4 h of Y. pseudotuberculosis infection, we observed YCVs displaying both VAMP7 and LC3 recruitment (). Codistribution was also observed on line profile plots (such as that shown in , depicting the correlation between GFP fluorescence and mRFP fluorescence). Moreover, by using HeLa stably transfected with the mRFP-GFP-LC3 construct, we observed that VAMP7 was recruited to nonacidic, LC3-positive organelles (Fig. S2E–S2G). Although these organelles were positive for the lysosomal markers CD63 and LAMP1, they were LysoTracker® Red-negative (Fig. S2F and S2G). We noticed that almost 57% of the YCV pool presented both VAMP7 and LC3 signals, whereas only about 25% and 5% of the YCVs presented GFP-VAMP7 only and mRFP-LC3 only signals, respectively (). Only 12.6 ± 0.2% of the YCVs were negative for both signals (). The difference in the percentage of LC3-negative YCVs between and might be due to the use of a stably transfected cell line in one experiment () and transiently transfected cells in the other (). These results prompted us to investigate the time course of VAMP7 and LC3 recruitment. By using video microscopy, we observed the migration of GFP-VAMP7 and mRFP-LC3 vacuoles in HeLa cells infected with Y. pseudotuberculosis. On and Video S2 (after 1 h 24 min of infection), one can start to see the GFP-VAMP7 signal. The mRFP-LC3 signal appeared later. Moreover, the markers appeared as hot spots containing one of the signals or both (; Vid. S2). These results suggest that both VAMP3 recruitment and VAMP7 recruitment precede LC3 recruitment to YCVs. In view of these results, we wondered whether VAMP7 might have a role in the recruitment of LC3 to YCVs in epithelial cells.
Figure 4. YCV vacuoles harbor LC3 and SNARE proteins. (A) HeLa cells transiently expressing an EGFP-VAMP3 chimera were infected with Y. pseudotuberculosis for 30 min and then processed for CLSM. Bacteria (blue) are contained within EGFP-VAMP3-positive and LC3-AlexaFluor® 555-negative vacuoles. Scale bar: 5 µm. Insert magnification: 4×. A fluorescence scan along the white line in the insert in the merged panel is shown in (B). (C) A pie chart displaying the distribution of bacteria as a function of EGFP-VAMP3 and LC3-AlexaFluor® 555 labeling. In each experiment, at least 50 infected cells were quantified in a double-blind analysis. Values are quoted as the mean ± SEM from at least 3 independent experiments. (D) HeLa cells transiently expressing GFP-VAMP7 proteins were infected with Y. pseudotuberculosis for 4 h and then processed for CLSM. Bacteria (blue) are contained in GFP-VAMP7-positive and mRFP-LC3 negative vacuoles. Scale bar: 5 µm. Insert magnification: 4×. A fluorescence scan along the white line in the insert is shown at the bottom (E). (F) A pie chart displaying the distribution of bacteria as a function of GFP-VAMP7 and mRFP-LC3 labeling. In each experiment, at least 50 infected cells were quantified in a double-blind analysis. Values are quoted as the mean ± SEM from at least 3 independent experiments. (G) HeLa cells transiently expressing GFP-VAMP7 (green) and mRFP-LC3 (red) were infected with Y. pseudotuberculosis for 2 h. Cells were stained with DAPI (DNA, blue). Panels show series of images from Video S2. Acquisition times are indicated in the lower left corner (h:min). Scale bar: 5 µm.
VAMP7 is involved in LC3 recruitment to YCVs
VAMP7 is reportedly involved in autophagosome biogenesis because knockdown of this protein decreases levels of autophagy as a result of limited LC3 processing.Citation26 We looked at whether VAMP7 might play a role in LC3′s recruitment to YCVs. After transfection with a control siRNA, we observed the recruitment of VAMP7 and GFP-LC3 to YCVs () and confirmed the codistribution according to the line profile plots (). After VAMP7 RNA silencing, infected HeLa cells transiently expressing GFP-LC3 displayed YCVs devoid of LC3 (). Treatment of HeLa cells with siRNA targeting VAMP7 was associated with a 21.1% decrease in the percentage of YCVs positive for GFP-LC3 (). We then performed a series of immunoblots to investigate the processing of LC3. After its synthesis and the activation of autophagy, LC3 is proteolytically converted into a form lacking C-terminal amino acids (referred to as LC3-I), which in turn is modified by conjugation with phosphatidylethanolamine to form LC3-II. This latter is a hallmark of the mature autophagosome and thus reflects induction of the autophagy pathway. We thus quantified the intensity of the LC3-II band.Citation9 As has been observed in macrophages,Citation34 infection with Y. pseudotuberculosis activated autophagy. Infection increased autophagy even after treatment with rapamycin (which induces autophagy by inhibiting the phosphorylation of MTOR) (; Fig. S3A). After treatment with bafilomycin A1 (which inhibits autophagosome acidification and thus reduces further fusion with lysosomes), there was no difference in autophagy levels when comparing infected and uninfected cells (). The fact that infection impairs acidification (see above) explained why we could not observe changes in LC3-I processing upon BafA1 treatment of infected cells. Western blot results confirmed that siRNA treatment had knocked down VAMP7 expression to 22.6 ± 3.0% of the control value (Fig. S3A and S3C). VAMP7 knockdown significantly impaired the infection-dependent activation of autophagy (; Fig. S3A–S3C). The ([LC3-II/TUBULIN]infected)/([LC3-II/TUBULIN]uninfected) ratio was significantly lower for siVAMP7-treated cells than for siCTRL-treated cells (). These results confirmed VAMP7’s involvement in the early steps in the autophagy pathway (as suggested previously)Citation26 and demonstrated its involvement in the recruitment of LC3 to YCVs during the course of Y. pseudotuberculosis infection in epithelial cells. Furthermore, rapamycin treatment did not accentuate the effect of VAMP7 siRNA treatment. Taken as a whole, these results strongly suggest that VAMP7 has a role in LC3 recruitment to Yersinia-containing single-membrane vacuoles.
Figure 5. VAMP7 has a role in the recruitment of LC3 to YCVs-LAP. (A) HeLa cells transiently expressing a GFP-LC3 chimera and treated with control siRNA (siCTRL) were infected with Y. pseudotuberculosis for 4 h and then processed for CLSM. VAMP7 proteins were immunostained and visualized with a secondary antibody coupled to AlexaFluor® 555. Bacteria (blue) are contained in GFP-LC3- (green) and VAMP7-AlexaFluor® 555- (red) positive vacuoles. Scale bar: 5 µm. Insert magnification: 4×. A fluorescence scan along the white line in the insert is shown in the right panel (B). (C) HeLa cells transiently expressing a GFP-LC3 chimera and treated with VAMP7 siRNA (siVAMP7) were infected with Y. pseudotuberculosis for 4 h and then processed for CLSM. VAMP7 proteins were immunostained and visualized with a secondary antibody coupled to AlexaFluor® 555 (red). Bacteria (blue) are contained in GFP-LC3-positive (green) and VAMP7-AlexaFluor® 555-negative vacuoles. Scale bar: 5 µm. Insert magnification: 5×. A fluorescence scan along the white line in the merged insert is shown on the right (D). (E) The percentages of YCVs displaying a GFP-LC3 labeling were quantified in HeLa cells treated or not with VAMP7 siRNA. In each experiment, at least 20 cells infected with Y. pseudotuberculosis during 4 h were quantified. (F) HeLa cells transfected with control or VAMP7 siRNA were analyzed for LC3 by immunoblotting. The cells were treated with rapamycin or BafA1 as indicated and DMSO was used as a solvent control. Protein loading was checked against the α-tubulin (TUBA) content. The complete data set is shown in Figure S2A. (G) The LC3-II/TUBULIN ratio for the HeLa siCTRL condition as a function of cell treatment or infection. The data correspond to the mean of 3 independent experiments and the error bars correspond to the SEM (H) VAMP7’s role in Yersinia-activated autophagy is shown by the [(LC3-II/TUBULIN)infected]/[(LC3-II/TUBULIN) uninfected] ratio for HeLa cells treated with control siRNA (siCTRL) or siRNA against VAMP7 (siVAMP7) and as a function of drug treatments. The data correspond to the mean of 3 independent experiments and the error bars correspond to the SEM.
![Figure 5. VAMP7 has a role in the recruitment of LC3 to YCVs-LAP. (A) HeLa cells transiently expressing a GFP-LC3 chimera and treated with control siRNA (siCTRL) were infected with Y. pseudotuberculosis for 4 h and then processed for CLSM. VAMP7 proteins were immunostained and visualized with a secondary antibody coupled to AlexaFluor® 555. Bacteria (blue) are contained in GFP-LC3- (green) and VAMP7-AlexaFluor® 555- (red) positive vacuoles. Scale bar: 5 µm. Insert magnification: 4×. A fluorescence scan along the white line in the insert is shown in the right panel (B). (C) HeLa cells transiently expressing a GFP-LC3 chimera and treated with VAMP7 siRNA (siVAMP7) were infected with Y. pseudotuberculosis for 4 h and then processed for CLSM. VAMP7 proteins were immunostained and visualized with a secondary antibody coupled to AlexaFluor® 555 (red). Bacteria (blue) are contained in GFP-LC3-positive (green) and VAMP7-AlexaFluor® 555-negative vacuoles. Scale bar: 5 µm. Insert magnification: 5×. A fluorescence scan along the white line in the merged insert is shown on the right (D). (E) The percentages of YCVs displaying a GFP-LC3 labeling were quantified in HeLa cells treated or not with VAMP7 siRNA. In each experiment, at least 20 cells infected with Y. pseudotuberculosis during 4 h were quantified. (F) HeLa cells transfected with control or VAMP7 siRNA were analyzed for LC3 by immunoblotting. The cells were treated with rapamycin or BafA1 as indicated and DMSO was used as a solvent control. Protein loading was checked against the α-tubulin (TUBA) content. The complete data set is shown in Figure S2A. (G) The LC3-II/TUBULIN ratio for the HeLa siCTRL condition as a function of cell treatment or infection. The data correspond to the mean of 3 independent experiments and the error bars correspond to the SEM (H) VAMP7’s role in Yersinia-activated autophagy is shown by the [(LC3-II/TUBULIN)infected]/[(LC3-II/TUBULIN) uninfected] ratio for HeLa cells treated with control siRNA (siCTRL) or siRNA against VAMP7 (siVAMP7) and as a function of drug treatments. The data correspond to the mean of 3 independent experiments and the error bars correspond to the SEM.](/cms/asset/5913ef51-50fa-4a17-bcc2-80231ecd418e/kaup_a_10929411_f0005.gif)
VAMP3, VAMP7, and LC3 recruitment to YCVs in macrophages
In macrophages, Y. pseudotuberculosis is able to replicate within nonacidic autophagosomesCitation34 and in view of our precedent results in HeLa cells, we then investigated VAMP3 and VAMP7 involvement during macrophage infection. We infected BMDMs transiently expressing EGFP-VAMP3 or mRFP-VAMP7 and used SIM to observe that EGFP-VAMP3 was recruited to YCVs 30 min p.i. (). mRFP-VAMP7 was recruited to YCVs later (4 h p.i.) in macrophages than in epithelial cells (). Autophagy was activated by infection (; Fig. S3D) after control siRNA treatment of BMDMs. VAMP7 siRNA treatment reduced the percentage of cells expressing Vamp7 to 48.5 ± 0.1% of the control value (Fig. S3D–S3F). Under control conditions, we observed a lower ([LC3-II/TUBULIN]infected)/([LC3-II/TUBULIN]uninfected) ratio and the effects were not accentuated by BafA1 or rapamycin treatments of the cells (; Fig. S3D and S3E). In view of the efficiency of VAMP7 knockdown and the level of LC3-I processing, we concluded that VAMP7 is involved in the recruitment of LC3 to double-membrane YCVs in BMDMs. Hence, the time course of VAMP3, VAMP7, and LC3 recruitment did not differ in HeLa cells and BMDMs. Nevertheless, the LC3-positive YCVs in the 2 cell types differed in terms of their shape; most of the vesicles had a single membrane in HeLa cells, whereas LC3-positive YCVs displayed double membrane in BMDMs. However, there were few VAMP3-positive YCVs in BMDMs.
Figure 6. VAMP3 and VAMP7 are recruited to YCVs in macrophages and VAMP7 is involved in LC3 recruitment. (A) BMDMs transiently expressing EGFP-VAMP3 were infected with Y. pseudotuberculosis for 30 min and then processed for super resolution fluorescence analysis (structured illumination microscopy- SIM). Bacteria were visualized after staining with DAPI. Scale bars: 5 µm. The fluorescence profile along the white line of the image insert is shown in the lower left corner (B). (C) BMDMs transiently expressing mRFP-VAMP7 were infected with Y. pseudotuberculosis for 3 h and then processed for SIM. Bacteria were visualized after staining with DAPI. Scale bars: 5 µm. The fluorescence profile along the white line in the image insert is shown at the bottom left (D). (E) BMDMs transfected with control (siCTRL) or VAMP7 siRNA were analyzed for LC3 by immunoblotting. The cells were treated with rapamycin or BafA1 as indicated and DMSO was used as a solvent control. Protein loading was checked against the α-tubulin (TUBA) content. The complete data set is shown in Figure S2D. (F) The LC3-II/TUBULIN ratio for BMDMs treated with control siRNA (siCTRL) as a function of cell treatment or infection. The mean of 3 independent experiments is indicated and the error bars correspond to the SEM (G) ([LC3-II/TUBULIN]infected)/([LC3-II/TUBULIN] uninfected) ratio in BMDMs treated with control siRNA (siCTRL) or siRNA against VAMP7 (siVAMP7) cells as a function of treatment with rapamycin or BafA1. The mean of 3 independent experiments is indicated and the error bars correspond to the SEM.
![Figure 6. VAMP3 and VAMP7 are recruited to YCVs in macrophages and VAMP7 is involved in LC3 recruitment. (A) BMDMs transiently expressing EGFP-VAMP3 were infected with Y. pseudotuberculosis for 30 min and then processed for super resolution fluorescence analysis (structured illumination microscopy- SIM). Bacteria were visualized after staining with DAPI. Scale bars: 5 µm. The fluorescence profile along the white line of the image insert is shown in the lower left corner (B). (C) BMDMs transiently expressing mRFP-VAMP7 were infected with Y. pseudotuberculosis for 3 h and then processed for SIM. Bacteria were visualized after staining with DAPI. Scale bars: 5 µm. The fluorescence profile along the white line in the image insert is shown at the bottom left (D). (E) BMDMs transfected with control (siCTRL) or VAMP7 siRNA were analyzed for LC3 by immunoblotting. The cells were treated with rapamycin or BafA1 as indicated and DMSO was used as a solvent control. Protein loading was checked against the α-tubulin (TUBA) content. The complete data set is shown in Figure S2D. (F) The LC3-II/TUBULIN ratio for BMDMs treated with control siRNA (siCTRL) as a function of cell treatment or infection. The mean of 3 independent experiments is indicated and the error bars correspond to the SEM (G) ([LC3-II/TUBULIN]infected)/([LC3-II/TUBULIN] uninfected) ratio in BMDMs treated with control siRNA (siCTRL) or siRNA against VAMP7 (siVAMP7) cells as a function of treatment with rapamycin or BafA1. The mean of 3 independent experiments is indicated and the error bars correspond to the SEM.](/cms/asset/8d4f1969-c617-4c16-aeba-7247f7a6afd2/kaup_a_10929411_f0006.gif)
VAMP3 participates in a checkpoint for LC3-positive vacuole morphology
At 30 min p.i., we observed that almost 74% of YCVs in HeLa cells were positive for VAMP3, whereas the corresponding figure was only 14% in macrophages (; ; ; ). In contrast, we noticed that the majority of the nonacidic, LC3-positive vacuoles had multiple membrane in BMDMsCitation34 and single membrane in HeLa cells (). We therefore wondered whether VAMP3 might have a regulatory role in this checkpoint and therefore looked at whether the level of VAMP3 expression influenced the ratio between single- and multiple-membrane YCVs.
Figure 7. VAMP3 participates in the regulation of LC3-positive vacuole morphology. (A) BMDMs transiently expressing an EGFP-VAMP3 chimera were infected with Y. pseudotuberculosis for 30 min and then processed for CLSM. Bacteria (blue) are contained within EGFP-VAMP3-positive and LC3-AlexaFluor® 555-negative vacuoles. Scale bar: 5 µm and insert magnification 4×. A fluorescence scan along the white line on the insert in the merged panel is shown in (B). (C) A pie chart displaying the distribution of bacteria as a function of EGFP-VAMP3 and LC3-AlexaFluor® 555 labeling. In each experiment, at least 30 infected cells were quantified in a double-blind analysis. Values are quoted as the mean ± SEM from at least 3 independent experiments. (D) The panel shows a bacterium inside a double-membrane vacuole (as visualized by TEM) in a HeLa cell treated with VAMP3 siRNA (siVAMP3). HeLa cells were treated with VAMP3 siRNA and siGLO-GREEN siRNA, sorted according to the GFP signal, again treated with VAMP3 siRNA or siCTRL, infected with Y. pseudotuberculosis for 4 h, and then processed for TEM. Arrowheads show double-membrane vacuoles. (E) Quantification of YCVs with single or double membrane after 4 h p.i in HeLa cells treated with control siRNA (siCTRL), smart pool VAMP3 siRNA (siVAMP3 (SP)). For each experiment, 45 cells were analyzed. The mean of 3 independent experiments is indicated and the error bars correspond to the SEM (F) BMDMs transiently expressing EGFP-VAMP3 were infected with Y. pseudotuberculosis for 3 h and processed for TEM. Arrowheads show Y. pseudotuberculosis contained in a single-membrane vacuole. (G) TEM quantification of single- or double-membrane YCVs for 38 BMDMs transiently expressing EGFP-VAMP3 or EGFP. (H) HeLa cells transiently expressing EGFP (left) or EGFP-VAMP3 (right) were treated with rapamycin for 7 h and then processed for TEM. White arrowheads show double-membrane vacuoles. The complete data set is shown in Figure S3G. (I) Quantification of double-membrane vacuoles in HeLa cells transiently expressing EGFP or EGFP-VAMP3 and treated (or not) with rapamycin. In each experiment, at least 35 infected cells were quantified in a double-blind analysis.
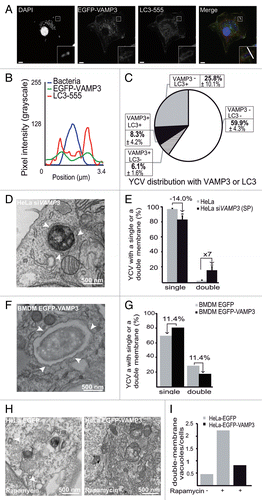
In a first step, we knocked down the expression of VAMP3 in HeLa cells and examined the proportion of single/double membrane YCVs. HeLa cells were treated with VAMP3 and siGLO-GREEN siRNAs. siGLO-positive cells were sorted by FACS. This pool of cells then underwent a second round of siVAMP3 and control siRNA treatment. Effective VAMP3 knockdown was checked by western blotting (Fig. S4A and S4B) and infected cells were analyzed by electron microscopy. Four hours p.i., treatment of HeLa cells with siRNA against VAMP3 was associated with a 14% decrease in the percentage of single-membrane YCVs and a 7-fold increase in double- and multiple-membrane YCVs (). Moderately higher numbers were obtained by using individual siRNA against VAMP3 (Fig. S4C–S4E). In a second step, we overexpressed VAMP3 in BMDMs and again analyzed the proportion of single- and double-membrane YCVs. In BMDMs, only 8.3 ± 4.2% of LC3-positive YCVs also displayed VAMP3 after 30 min of infection and the majority of LC3-positive YCVs were VAMP3-negative (). The pEGFP-VAMP3 transfection in BMDMs was moderately effective, since only about 17% of macrophages expressed the fusion protein (data not shown). Upon EGFP-VAMP3 overexpression, an electron microscopy analysis revealed a decrease in the proportion of double- and multi-membrane YCVs (relative to BMDMs expressing GFP alone) (). Taken as a whole, these data suggest that the recruitment of VAMP3 to the bacterial vacuole favors the single-membrane, LC3-positive YCV pathway.
We next wondered whether VAMP3 might influence the number of membranes (i.e., double vs. single) observed in LC3-positive compartments independently of infection. Since the baseline level of autophagy was low, HeLa cells transiently expressing EGFP or EGFP-VAMP3 were treated with rapamycin and then processed for electronic microscopy. We checked that HeLa cells were correctly transfected and that rapamycin treatment increased the autophagy level after expression of either plasmid (Fig. S4F–S4I). As expected, the electron microscopy profiles revealed that rapamycin-treated, EGFP-expressing HeLa contained more double-membrane vacuoles than untreated cells did (; Fig. S4J). LC3-I processing was unaffected during EGFP-VAMP3 expression (Fig. S4G–S4I). Interestingly, we observed fewer double-membrane vacuoles in rapamycin-treated VAMP3-overexpressing cells than in the EGFP-rapamycin condition (; Fig. S4J). Cells overexpressing VAMP3 and untreated cells expressing EGFP had similar numbers of double-membrane vacuoles (; Fig. S4J).
We used western blots to assess the impact of VAMP3 overexpression and knockdown on LC3-I processing independently of infection. Treatment with rapamycin and/or BafA1 did not significantly modify LC3-I processing in HeLa cells transiently expressing EGFP-VAMP3 or HeLa cells HeLa treated with VAMP3 siRNA (Fig. S5A–S5D). These data suggested that the presence of VAMP3 influenced the nature of the LC3-positive membrane compartments.
Hence our results suggest that VAMP3 acts at a checkpoint at which bacteria are committed to single-or multi-membrane LC3-positive YCV pathways and more generally raise the question of the SNAREs’ involvement in selection of the LC3 route.
Discussion
The present study revealed 4 key characteristics of intracellular Y. pseudotuberculosis trafficking during the early stages of host-cell invasion: i) bacteria can traffic through different LC3-positive membrane pathways to reach intracellular replication niches; ii) VAMP3 is involved in the commitment of bacteria toward replication in single-membrane, LC3-positive vacuoles; iii) VAMP3 and VAMP7 are recruited sequentially to YCVs, and iv) VAMP7 has a role in the recruitment of LC3.
Although LAP has already been described for cytosol-resident bacteria and vacuolar bacteria in macrophages,Citation12 we report herein the formation of single-membrane, LC3-positive YCVs in epithelial cells.
Analysis of Y. pseudotuberculosis traffic in epithelial cells revealed that the bacteria were able to replicate inside intracellular vacuolar niches and travel along several different pathways. Surprisingly, a CLEM analysis of infected HeLa cells showed that most of the Y. pseudotuberculosis was enclosed in vacuoles with a single mRFP-GFP-LC3-positive membrane. Our data suggested that in epithelial cells infected with Y. pseudotuberculosis, LC3 proteins are directly recruited to single-membrane YCVs (as has been previously reported for vacuolar bacteria in macrophages infected with Escherichia coli or Burkholderia pseudomallei).Citation13-Citation15 The presence of Y. pseudotuberculosis inside nonacidic, single-membrane, LC3-positive vacuoles in epithelial cells enabled us to extend the LAP model already described by Brumell for macrophages infected with Listeria monocytogenes.Citation37 In fact, Listeria (probably expressing a low amount of Listeriolysin O)Citation12 are targeted by the LAP pathway via diacylglycerol enrichment and downstream reactive oxygen species production to establish spacious Listeria-containing phagosomes used as intracellular niches (SLAPs).Citation37 There are also literature data showing that wild-type Escherichia coli induces a rapid recruitment of LC3 to the phagosome in macrophages.Citation13 On the other hand, a Burkholderia pseudomallei mutant lacking the type-3 secretion system follows the LAP pathway for their degradation in macrophages.Citation15,Citation37 We have previously shown that in unactivated BMDMs, 80% of the LC3-positive compartments containing Y pseudotuberculosis had a double- or multimembrane autophagosomes (20% were present in single-membrane LC3-positive vacuoles).Citation34 Hence, impairment of acidification blocks the maturation of both single- and double-membrane LC3-positive vacuoles containing Y. pseudotuberculosis (in epithelial and macrophages, respectively), which allows the bacteria to establish replicative niches (data from the present study and from,Citation34 respectively). Herein, we showed that Y. pseudotuberculosis subverts the LAP and autophagosome pathways and thus creates a replicative niche the ultrastructure of which depends on the cell type. This finding raises the question of how LC3 pathways are selected.
A variety of studies have highlighted the involvement of SNAREs in the autophagosome biogenesis and autophagosome-lysosome steps of autophagy.Citation24,Citation28,Citation29,Citation38 In the present study, we provide compelling evidence for the recruitment of VAMP3 followed by VAMP7 to YCVs positive for LC3 4 h p.i in both epithelial cells and macrophages. In epithelial cells, the majority of YCVs are VAMP3-positive. In contrast, few YCVs in BMDMs are positive for VAMP3. Our present data highlighted a correlation between VAMP3 recruitment to YCVs during early-stage infection on one hand and the morphology of LC3-positive vacuoles on the other (; Fig. S4). It has been reported that SNAREs can be involved during bacterial infection. For instance, VAMP7 is required for the formation of vacuoles induced by the VacA toxin produced by Helicobacter pylori.Citation33 A study has shown the kinetics of recruitment of VAMP3, 8, 7 proteins to the Coxiella burnetii-containing vacuole.Citation39 The authors highlight that the percentage of Coxiella replicative vacuoles (CRVs) colocalized with VAMP8 decreases during infection, while that of CRVs positive for VAMP3 or VAMP7 is stable and also, they report that VAMP7 is required in the biogenesis of these CRVs.Citation39 Moreover, VAMP3 associates with Mycobacterium tuberculosis-containing vacuoles while being degraded over the course of infection.Citation32 Finally to date, whereas Brucella melitens VAMP3 expression increases during infection of macrophages, the silencing of this VAMP does not affect the infection level.Citation40 In this study, we showed that Y. pseudotuberculosis replicate inside an LC3-positive compartment whose morphology depends on VAMP3. Indeed, in epithelial cells the VAMP3 knockdown increases the proportion of double-membrane YCVs (). Conversely, we observed that, in BMDMs, VAMP3 overexpression is associated with an increase in the proportion of single-membrane YCVs (). Taken as a whole, these results suggest that VAMP3 regulates the LC3-positive vacuole pathways followed by bacteria. It is probable that VAMP3 is not the only factor involved in this process. Interestingly, TMEM59 is known to interact with ATG16L1, activate LC3, and mediate autophagy during Staphylococcocus aureus infection of HeLa cells; the bacteria were present in single-membrane, LC3-positive structures.Citation41 Our findings have widespread significance because we have shown that VAMP3 also participates in infection-independent autophagy. Upon rapamycin-mediated activation of autophagy, VAMP3 overexpression was associated with a decrease number of double-membrane autophagosomes. Hence, we suggest that VAMP3 is part of a molecular checkpoint for the commitment of Y. pseudotuberculosis toward either single- or double-membrane, LC3-positive vacuoles during invasion. It remains to be seen whether other SNAREs are involved. Although characterizing the membrane mechanism in detail will require further work, we have clearly identified the seminal molecular basis of this process, with VAMP3 involved in the selection of single- or multi-membrane, LC3-positive compartments. We also showed that VAMP7 preceded LC3 recruitment to YCVs in both epithelial cells and BMDMs and that VAMP7 knockdown interfered with LC3 recruitment. Our data on VAMP7 knockdown indicate that this protein is involved in autophagy (as previously suggested)Citation26 but we highlighted for the first time that VAMP7 is also involved in LC3 recruitment during LC3-associated phagocytosis.
In conclusion, our study emphasizes the importance of characterizing the morphology of LC3-positive vacuoles when analyzing pathogen-dependent LC3 compartments and thus the related membrane-trafficking regulation. Our present data revealed the molecular basis of the LC3 pathway selection process. This study paves the way for a comprehensive analysis (using a high-content screening approach, for example) of the SNAREs involved in Yersinia infection and the membrane traffic effectors that may govern the fate of intracellular pathogens. Another important point is to identify the origin of the membrane donor compartment in order to accommodate the growth of the bacteria-containing vacuole. Especially the role of ATG9 and the ULK complex in the formation of LAPCitation42 deserves more investigations.
Materials and Methods
Cell culture
HeLa cells were cultured in minimum essential medium (Gibco, 21090022) (supplemented with 10% fetal bovine serum [FBS; Gibco, 10270106), 2 mM L-glutamine (Gibco, 25030024) and 100 U/ml penicillin/streptomycin (Gibco, 15140122)] in 5% CO2 at 37 °C.
HeLa cells having been stably transfected with mRFP-GFP-LC3 (a kind gift from D Rubinzstein, University of Cambridge, UK) were cultured in L-glutamine Roswell Park Memorial Institute medium (Gibco, 11875093) (supplemented with 10% FBS, 2 mM L-glutamine and 100 U/ml penicillin/streptomycin) in 5% CO2 at 37 °C.
Mouse BMDMs were derived in a 6-d culture in nontissue-culture-treated dishes (diameter: 100 mm) containing Dulbecco Modified Eagle Medium L-Glutamax (Gibco, 11995065) supplemented with 30% L-Cell conditioned medium (as a source of CSF1), 10% FBS and 100 U/ml penicillin/streptomycin.
Reagents
Antibodies included rabbit polyclonal anti-LC3 (MBL international PM036), mouse monoclonal anti-LAMP1 (Santa-Cruz Biotechnology, sc-18821, clone H5G11), mouse monoclonal anti-CD63 (BD, 556019), plus LysoTracker® Red DND-99 (Invitrogen, L7528) and goat anti-rabbit Alexafluor® 488-, 555-, or 633-conjugated antibody (Invitrogen) for immunofluorescence, rabbit polyclonal anti-LC3 antibody (Novus Biologicals NB100-2220) for western blots, rabbit polyclonal anti-VAMP7 antibody (TG50), rabbit polyclonal anti-VAMP3 (TG1) or (abcam, ab43080), rabbit polyclonal anti-GFP (abcam, ab6556), rabbit polyclonal anti-ATG5 antibody (Novus biological NB110-53818) mouse monoclonal anti-tubulin antibody (Sigma, T6074) and mouse or rabbit anti-HRP antibody (Jackson, 711-035). Predesigned small, interfering RNAs (siRNAs) were ordered from Thermo Scientific Dharmacon. The siRNA IDs were as follows: VAMP7/SYBL1 siGENOME SMARTpool Human SYBL1 (M-020864-00), VAMP3 siGENOME SMARTpool ONE-TARGETplus Human (L 011934-00), individual VAMP3 siGENOME Human [D-011934-01 (n°1) and D-011934-02 (n°2)], ATG5 siGENOME SMARTpool Human (M-004374-04) and siGLO Green (D-001630-01-05).
Bacterial strain
Yersinia pseudotuberculosis strain 2777 wild type was grown at 28 °C in Luria-Bertani broth (Sigma-Aldrich, L3022) or on Luria-Bertani agar (Sigma-Aldrich, L2897) plates.
Plasmids
Plasmid pEGFP-LC3 containing rat LC3 cDNA inserted into a GFP fusion expression vector was a kind gift from T Yoshimori (Osaka University, Japan). Plasmid pmRFP-LC3 was derived from pEGFP-LC3, with an mRFP sequence instead of the GFP sequence. Plasmids pEGFP-VAMP7 and pmRFP-VAMP7 (containing the human VAMP7 gene) have been described elsewhere.Citation43 Plasmid pEGFP-VAMP3 is derived from plasmid pEGF-C3 and contains the human VAMP3 gene.Citation44
Cell transfections
HeLa cells were transiently transfected with plasmids using Fugen HD (Promega, E231A), according to the manufacturer’s instructions. For VAMP7 siRNA treatment, cells were transfected with Lipofectamine RNAi max (Invitrogen, 1529510), according to manufacturer’s recommendations. VAMP3 siRNAs were cotransfected with siGLO-GREEN siRNAs, again according to manufacturer’s recommendations. Upon siGLO-GREEN expression, transfected cells emit a green fluorescence signal that enables fluorescence-activated cell sorting (FACS). The sorted cells were cultured in 6-well plates. After plating, the cells were again treated with VAMP3 siRNA and then incubated for a further 48 h at 37 °C in 5% CO2.
Murine BMDMs were transiently transfected with plasmids or siRNA using the AmaxaTM Mouse Macrophage NucleofectorTM kit (Lonza, VAP-1009), according to the manufacturer’s instructions.
Modulation of autophagy
To inhibit LC3-II degradation, cells were treated with 100 nM bafilomycin A1 (Sigma-Aldrich, B1793) for 2 h before fixation. To induce autophagy in an MTOR-dependent manner, cells were treated with rapamycin (Sigma-Aldrich, R0395) at 20 µg for 2 h before infection or for 7 h for experiments without infection.
Cell infection assay
Cells were infected with Yersinia at a multiplicity of infection of 10. Briefly, a suspension of exponentially grown (OD600 = 0.6) bacteria in culture medium was centrifuged onto cells for 5 min at 1700 × g rpm.
For video microscopy, bacteria were prelabeled with DAPI (5 µg/ml, Invitrogen, D3571) for 15 min at 28 °C. Infected cells were incubated for 30 min at 37 °C in 5% CO2 or directly observed using video microscopy. In order to kill extracellular microorganisms, the medium was removed and replaced with fresh cell culture medium containing 10 µg/ml gentamicin (Sigma-Aldrich, G1264).
Bacterial intracellular replication assay
In order to determine the number of intracellular bacteria, HeLa cells were washed with phosphate-buffer saline (PBS; Gibco, 14040091) and lysed with 0.1% Triton X-100 (VWR, A1287). The lysates were sonicated to disperse bacteria and then plated onto LB agar plates for counting viable Yersinia (quantified as colony forming units, CFUs).
Western blotting
Cells were harvested, rinsed with PBS, and lysed on ice for 10 min in Laemmli buffer. The cell lysates were centrifuged at 15,000 × g for 10 min at 4 °C and resolved by SDS-PAGE. The proteins were then transferred to PVDF membranes (BioRad, 162-0177). The membranes were blocked with 5% milk or 5% bovine serum albumin (Euromedex, 04-100-811C) in PBS-0.1% Tween (Sigma-Aldrich, P1379) (depending on the antibody being used), then incubated with primary antibodies diluted in blocking solution, washed with PBS-Tween 0.1% and then incubated for 1 h at room temperature with HRP-conjugated secondary antibodies. Immune complexes were revealed using SuperSignal West Pico chemiluminescence substrate (Thermo Scientific, 34080). Band density was read on a LAS-3000 system (GE Healthcare Life sciences) and quantified using ImageGauge® software (FUJIFILM).
Immunofluorescence microscopy
Cells were cultured on coverslips, fixed with 4% paraformaldehyde in PBS for 20 min, and permeabilized with 0.1% Triton X-100 in PBS for 5 min. The coverslips were incubated with primary antibodies at room temperature, washed 3 times with PBS, and incubated with secondary antibodies. Samples were stained with DAPI, mounted with Dako Fluorescent Mouting Meduim (DAKO,S3023) and observed with a LSM710 confocal microscope (Zeiss, Oberkochen, Germany) mounted on an AxioObserver Z1 (Zeiss, Oberkochen, Germany). Excitation was performed with an Argon laser (Lasos Lasertechnik GmbH, Jena, Germany) (458 to 488 to 514 nm) or a laser diode (Lasos Lasertechnik GmbH, Jena, Germany) (561 nm). The spectral detection range was adjusted for each fluorophore by using a Quasar detection unit. Images were acquired with ZEN software (Zeiss, Carl Zeiss, Oberkochen, Germany) and assembled using ImageJ software. Super-resolution images were acquired on a ElyraPS1 microscope system (Zeiss, Oberkochen, Germany) using a 100× oil-immersion lens (NA 1.46). This SIM system can achieve a resolution of 100 nm along the x–y axis and 300 nm along the z-axis. Laser lines at 488 and 561 nm were used for excitation. Structured illumination microscopy (SIM) images (15 images with 5 different phases for 3 different angular orientations of illumination for each SIM image) were acquired with an EMCCD camera (Andor Technology Ltd., Belfast, UK) (1002 × 1004 pixels) and processed with Zen (Zeiss) software.
Live-cell imaging
Cell marker recruitment was tracked with time-lapse, high-speed video microscopy. Epifluorescence and total internal reflection fluorescence (TIRF) were recorded using an inverted AxioObserver Z1 microscope fitted with a Zeiss Axiocam® MRm camera (Carl Zeiss, Oberkochen, Germany) and operated by Axiovision® software. Images were acquired with a Plan-Apo 100×/1.46 oil immersion objective (Carl Zeiss, Oberkochen, Germany). For video microscopy, the fluorophore excitation system was composed of a Colibri system (Zeiss, Carl Zeiss, Oberkochen, Germany) with 365, 470, 555, and 590 nm LEDs. For TIRF, the fluorophore excitation system featured a laser module with a multiline (458 to 488 to 514 nm, 100 mW) argon laser (Lasos Lasertechnik GmbH, Jena, Germany) and a laser TIRF slider with a monomode fiber (561 nm, 10 mV) diode-pumped with a lambda 10-3 optical filter changer with SmartShutterTM (Sutter Instrument Company, Novato, CA, USA). Images were further analyzed using ImageJ software and converted into .avi files.
Electron microscopy and correlative light-electron microscopy
After infection, cells were fixed at 4 °C overnight with 1% glutaraldehyde (Sigma-Aldrich, G5882) in 0.1 M sodium cacodylate (Agar, R1104) pH 6.8. Cells were post-fixed with 1% osmium tetroxide (EMS, 19150) and 1.5% potassium ferricyanide (Sigma-Aldrich, P-8131) for 1 h and then with 1% uranyl acetate (EMS, 22400) for 45 min (both in distilled water at room temperature and in the dark). After washing, cells were dehydrated in graded ethanol solutions, scraped off, and then infiltrated with propylene oxide (Sigma-Aldrich, 82320). Lastly, cells were infiltrated with epoxy resin (EMS, 14120) and cured for 24 h at 60 °C. Sections (thickness: 70 to 80 nm) on formvar-coated grids were observed with a Hitachi H7500 transmission electron microscope (Schaumburg, IL, USA). Images were acquired with a 1 Mpixel digital camera (AMT, Woburn, MA, USA)
For correlative light-electron microscopy, mRFP-GFP-LC3-expressing HeLa cells were grown on glass coverslips bearing an alphanumeric photo-etched coordinate system (EMS). After infection, cells were fixed with 10% formalin plus 0.05% glutaraldehyde for 20 min at room temperature and then incubated with 0.1% sodium borohydride (Sigma-Aldrich, 452882) in PBS for 15 min. The coverslips were mounted on a concavity slide for observation under a confocal microscope. Cells of interest were located according to the alphanumerical coordinate system and imaged. The cells were again fixed with 1% glutaraldehyde in 0.1 M sodium cacodylate pH 6.8 at 4 °C overnight, and then processed for electron microscopy as described above (except that cells were flat-embedded and resin was cured on the coverslip). After removal of the coverslip, cells of interest were relocated and prepared for sectioning parallel to the resin surface. Serial sections (thickness: 70 to 80 nm) were laid down on carbon and formvar-coated slot grids.
Statistics
Unless otherwise stated, all data are reported as the mean ± SEM of at least 3 independent assays. A 2-tailed, unpaired Student t test was used for intergroup comparisons. A P value of less than 0.05 was considered to be statistically significant and is denoted hereafter by **; P < 0.1 is denoted by *
| Abbreviations: | ||
| ATG | = | autophagy-related |
| BafA1 | = | bafilomycin A1 |
| BMDM | = | bone marrow-derived macrophages |
| CLEM | = | correlative light-electron microscopy |
| CLSM | = | confocal laser scanning microscopy |
| CRV | = | Coxellia replicative vacuoles |
| DAPI | = | DAPI, 4′,6-diamidino-2-phenylindole |
| FBS | = | fetal bovine serum |
| GFP | = | green fluorescent protein |
| LAMP1 | = | lysosomal-associated membrane protein 1 |
| LAP | = | LC3-associated phagocytosis |
| MAP1LC3 (LC3) | = | microtubule-associated protein 1 light chain 3 |
| PBS | = | phosphate-buffered saline |
| mRFP | = | monomeric red fluorescent protein |
| SIM | = | structured illumination microscopy |
| CTRL siRNA | = | small interfering RNA control |
| SNARE | = | soluble N-ethylmaleimide-sensitive factor attachment protein receptor |
| TEM | = | transmission electron microscopy |
| TIRF | = | total internal reflection fluorescence |
| VAMP | = | vesicle-associated membrane proteins |
| YCV | = | Yersinia-containing vacuole |
Additional material
Download Zip (17.2 MB)Disclosure of Potential Conflicts of Interest
No potential conflicts of interest were disclosed.
Acknowledgments
We thank J. Warein, L. Brunet and C. Slomianny for expert technical assistance and advice, T. Proikas-Cezanne for providing plasmids and advice M. Simonet and P. Codogno for carefully reading the manuscript. The work was funded by grants from the CNRS and Région Nord Pas-de-Calais (L-AL), FEDER 12001407 (D-AL) and ANR 09-MIEN-020-01, ANR-10-EQPX-04-01, FEDER 12001407 (FL).
Related Research Data
References
- Deretic V, Levine B. Autophagy, immunity, and microbial adaptations. Cell Host Microbe 2009; 5:527 - 49; http://dx.doi.org/10.1016/j.chom.2009.05.016; PMID: 19527881
- Deretic V. Autophagy in immunity and cell-autonomous defense against intracellular microbes. Immunol Rev 2011; 240:92 - 104; http://dx.doi.org/10.1111/j.1600-065X.2010.00995.x; PMID: 21349088
- Johansen T, Lamark T. Selective autophagy mediated by autophagic adapter proteins. Autophagy 2011; 7:279 - 96; http://dx.doi.org/10.4161/auto.7.3.14487; PMID: 21189453
- Faure M, Lafont F. Pathogen-induced autophagy signaling in innate immunity. J Innate Immun 2013; 5:456 - 70; http://dx.doi.org/10.1159/000350918; PMID: 23652193
- Yang Z, Klionsky DJ. Eaten alive: a history of macroautophagy. Nat Cell Biol 2010; 12:814 - 22; http://dx.doi.org/10.1038/ncb0910-814; PMID: 20811353
- Mizushima N. Autophagy: process and function. Genes Dev 2007; 21:2861 - 73; http://dx.doi.org/10.1101/gad.1599207; PMID: 18006683
- Burman C, Ktistakis NT. Autophagosome formation in mammalian cells. Semin Immunopathol 2010; 32:397 - 413; http://dx.doi.org/10.1007/s00281-010-0222-z; PMID: 20740284
- Mizushima N, Yoshimori T, Ohsumi Y. The role of Atg proteins in autophagosome formation. Annu Rev Cell Dev Biol 2011; 27:107 - 32; http://dx.doi.org/10.1146/annurev-cellbio-092910-154005; PMID: 21801009
- Klionsky DJ, Abdalla FC, Abeliovich H, Abraham RT, Acevedo-Arozena A, Adeli K, Agholme L, Agnello M, Agostinis P, Aguirre-Ghiso JA, et al. Guidelines for the use and interpretation of assays for monitoring autophagy. Autophagy 2012; 8:445 - 544; http://dx.doi.org/10.4161/auto.19496; PMID: 22966490
- Lai SC, Devenish RJ. LC3-Associated Phagocytosis (LAP): Connections with Host Autophagy. Cells 2012; 1:396 - 408; http://dx.doi.org/10.3390/cells1030396; PMID: 24710482
- Sanjuan MA, Milasta S, Green DR. Toll-like receptor signaling in the lysosomal pathways. Immunol Rev 2009; 227:203 - 20; http://dx.doi.org/10.1111/j.1600-065X.2008.00732.x; PMID: 19120486
- Cemma M, Brumell JH. Interactions of pathogenic bacteria with autophagy systems. Curr Biol 2012; 22:R540 - 5; http://dx.doi.org/10.1016/j.cub.2012.06.001; PMID: 22790007
- Sanjuan MA, Dillon CP, Tait SWG, Moshiach S, Dorsey F, Connell S, Komatsu M, Tanaka K, Cleveland JL, Withoff S, et al. Toll-like receptor signalling in macrophages links the autophagy pathway to phagocytosis. Nature 2007; 450:1253 - 7; http://dx.doi.org/10.1038/nature06421; PMID: 18097414
- Huang J, Canadien V, Lam GY, Steinberg BE, Dinauer MC, Magalhaes MAO, Glogauer M, Grinstein S, Brumell JH. Activation of antibacterial autophagy by NADPH oxidases. Proc Natl Acad Sci U S A 2009; 106:6226 - 31; http://dx.doi.org/10.1073/pnas.0811045106; PMID: 19339495
- Gong L, Cullinane M, Treerat P, Ramm G, Prescott M, Adler B, Boyce JD, Devenish RJ. The Burkholderia pseudomallei type III secretion system and BopA are required for evasion of LC3-associated phagocytosis. PLoS One 2011; 6:e17852; http://dx.doi.org/10.1371/journal.pone.0017852; PMID: 21412437
- Birmingham CL, Canadien V, Kaniuk NA, Steinberg BE, Higgins DE, Brumell JH. Listeriolysin O allows Listeria monocytogenes replication in macrophage vacuoles. Nature 2008; 451:350 - 4; http://dx.doi.org/10.1038/nature06479; PMID: 18202661
- Hong W. SNAREs and traffic. Biochim Biophys Acta 2005; 1744:120 - 44; http://dx.doi.org/10.1016/j.bbamcr.2005.03.014; PMID: 15893389
- Jahn R, Scheller RH. SNAREs--engines for membrane fusion. Nat Rev Mol Cell Biol 2006; 7:631 - 43; http://dx.doi.org/10.1038/nrm2002; PMID: 16912714
- Fasshauer D, Sutton RB, Brunger AT, Jahn R. Conserved structural features of the synaptic fusion complex: SNARE proteins reclassified as Q- and R-SNAREs. Proc Natl Acad Sci U S A 1998; 95:15781 - 6; http://dx.doi.org/10.1073/pnas.95.26.15781; PMID: 9861047
- Zylbersztejn K, Galli T. Vesicular traffic in cell navigation. FEBS J 2011; 278:4497 - 505; http://dx.doi.org/10.1111/j.1742-4658.2011.08168.x; PMID: 21554543
- Darsow T, Rieder SE, Emr SD. A multispecificity syntaxin homologue, Vam3p, essential for autophagic and biosynthetic protein transport to the vacuole. J Cell Biol 1997; 138:517 - 29; http://dx.doi.org/10.1083/jcb.138.3.517; PMID: 9245783
- Sato TK, Darsow T, Emr SD. Vam7p, a SNAP-25-like molecule, and Vam3p, a syntaxin homolog, function together in yeast vacuolar protein trafficking. Mol Cell Biol 1998; 18:5308 - 19; PMID: 9710615
- Nair U, Jotwani A, Geng J, Gammoh N, Richerson D, Yen WL, Griffith J, Nag S, Wang K, Moss T, et al. SNARE proteins are required for macroautophagy. Cell 2011; 146:290 - 302; http://dx.doi.org/10.1016/j.cell.2011.06.022; PMID: 21784249
- Fader CM, Sánchez DG, Mestre MB, Colombo MI. TI-VAMP/VAMP7 and VAMP3/cellubrevin: two v-SNARE proteins involved in specific steps of the autophagy/multivesicular body pathways. Biochim Biophys Acta 2009; 1793:1901 - 16; http://dx.doi.org/10.1016/j.bbamcr.2009.09.011; PMID: 19781582
- Puri C, Renna M, Bento CF, Moreau K, Rubinsztein DC. Diverse autophagosome membrane sources coalesce in recycling endosomes. Cell 2013; 154:1285 - 99; http://dx.doi.org/10.1016/j.cell.2013.08.044; PMID: 24034251
- Moreau K, Ravikumar B, Renna M, Puri C, Rubinsztein DC. Autophagosome precursor maturation requires homotypic fusion. Cell 2011; 146:303 - 17; http://dx.doi.org/10.1016/j.cell.2011.06.023; PMID: 21784250
- Furuta N, Fujita N, Noda T, Yoshimori T, Amano A. Combinational soluble N-ethylmaleimide-sensitive factor attachment protein receptor proteins VAMP8 and Vti1b mediate fusion of antimicrobial and canonical autophagosomes with lysosomes. Mol Biol Cell 2010; 21:1001 - 10; http://dx.doi.org/10.1091/mbc.E09-08-0693; PMID: 20089838
- Moreau K, Renna M, Rubinsztein DC. Connections between SNAREs and autophagy. Trends Biochem Sci 2013; 38:57 - 63; http://dx.doi.org/10.1016/j.tibs.2012.11.004; PMID: 23306003
- Itakura E, Kishi-Itakura C, Mizushima N. The hairpin-type tail-anchored SNARE syntaxin 17 targets to autophagosomes for fusion with endosomes/lysosomes. Cell 2012; 151:1256 - 69; http://dx.doi.org/10.1016/j.cell.2012.11.001; PMID: 23217709
- Itakura E, Mizushima N. Syntaxin 17: the autophagosomal SNARE. Autophagy 2013; 9:917 - 9; http://dx.doi.org/10.4161/auto.24109; PMID: 23466629
- Delevoye C, Nilges M, Dehoux P, Paumet F, Perrinet S, Dautry-Varsat A, Subtil A. SNARE protein mimicry by an intracellular bacterium. PLoS Pathog 2008; 4:e1000022; http://dx.doi.org/10.1371/journal.ppat.1000022; PMID: 18369472
- Fratti RA, Chua J, Deretic V. Cellubrevin alterations and Mycobacterium tuberculosis phagosome maturation arrest. J Biol Chem 2002; 277:17320 - 6; http://dx.doi.org/10.1074/jbc.M200335200; PMID: 11825909
- Mashima H, Suzuki J, Hirayama T, Yoshikumi Y, Ohno H, Ohnishi H, Yasuda H, Fujita T, Omata M. Involvement of vesicle-associated membrane protein 7 in human gastric epithelial cell vacuolation induced by Helicobacter pylori-produced VacA. Infect Immun 2008; 76:2296 - 303; http://dx.doi.org/10.1128/IAI.01573-07; PMID: 18362137
- Moreau K, Lacas-Gervais S, Fujita N, Sebbane F, Yoshimori T, Simonet M, Lafont F. Autophagosomes can support Yersinia pseudotuberculosis replication in macrophages. Cell Microbiol 2010; 12:1108 - 23; http://dx.doi.org/10.1111/j.1462-5822.2010.01456.x; PMID: 20180800
- Ewanowich CA, Peppler MS. Phorbol myristate acetate inhibits HeLa 229 invasion by Bordetella pertussis and other invasive bacterial pathogens. Infect Immun 1990; 58:3187 - 93; PMID: 2119340
- Kimura S, Noda T, Yoshimori T. Dissection of the autophagosome maturation process by a novel reporter protein, tandem fluorescent-tagged LC3. Autophagy 2007; 3:452 - 60; PMID: 17534139
- Lam GY, Cemma M, Muise AM, Higgins DE, Brumell JH. Host and bacterial factors that regulate LC3 recruitment to Listeria monocytogenes during the early stages of macrophage infection. Autophagy 2013; 9:985 - 95; http://dx.doi.org/10.4161/auto.24406; PMID: 23584039
- Nair U, Klionsky DJ. Autophagosome biogenesis requires SNAREs. Autophagy 2011; 7:1570 - 2; http://dx.doi.org/10.4161/auto.7.12.18001; PMID: 22024744
- Campoy EM, Mansilla ME, Colombo MI. Endocytic SNAREs are involved in optimal Coxiella burnetii vacuole development. Cell Microbiol 2013; 15:922 - 41; http://dx.doi.org/10.1111/cmi.12087; PMID: 23217169
- Castañeda-Ramírez A, Puente JL, González-Noriega A, Verdugo-Rodríguez A. Silencing of VAMP3 expression does not affect Brucella melitensis infection in mouse macrophages. Virulence 2012; 3:434 - 9; http://dx.doi.org/10.4161/viru.21251; PMID: 23076244
- Boada-Romero E, Letek M, Fleischer A, Pallauf K, Ramón-Barros C, Pimentel-Muiños FX. TMEM59 defines a novel ATG16L1-binding motif that promotes local activation of LC3. EMBO J 2013; 32:566 - 82; http://dx.doi.org/10.1038/emboj.2013.8; PMID: 23376921
- Kageyama S, Omori H, Saitoh T, Sone T, Guan JL, Akira S, Imamoto F, Noda T, Yoshimori T. The LC3 recruitment mechanism is separate from Atg9L1-dependent membrane formation in the autophagic response against Salmonella. Mol Biol Cell 2011; 22:2290 - 300; http://dx.doi.org/10.1091/mbc.E10-11-0893; PMID: 21525242
- Martinez-Arca S, Alberts P, Zahraoui A, Louvard D, Galli T. Role of tetanus neurotoxin insensitive vesicle-associated membrane protein (TI-VAMP) in vesicular transport mediating neurite outgrowth. J Cell Biol 2000; 149:889 - 900; http://dx.doi.org/10.1083/jcb.149.4.889; PMID: 10811829
- Martinez-Arca S, Proux-Gillardeaux V, Alberts P, Louvard D, Galli T. Ectopic expression of syntaxin 1 in the ER redirects TI-VAMP- and cellubrevin-containing vesicles. J Cell Sci 2003; 116:2805 - 16; http://dx.doi.org/10.1242/jcs.00467; PMID: 12759369