Abstract
Caffeine is one of the most frequently ingested neuroactive compounds. All known mechanisms of apoptosis induced by caffeine act through cell cycle modulation or p53 induction. It is currently unknown whether caffeine-induced apoptosis is associated with other cell death mechanisms, such as autophagy. Herein we show that caffeine increases both the levels of microtubule-associated protein 1 light chain 3-II and the number of autophagosomes, through the use of western blotting, electron microscopy and immunocytochemistry techniques. Phosphorylated p70 ribosomal protein S6 kinase (Thr389), S6 ribosomal protein (Ser235/236), 4E-BP1 (Thr37/46) and Akt (Ser473) were significantly decreased by caffeine. In contrast, ERK1/2 (Thr202/204) was increased by caffeine, suggesting an inhibition of the Akt/mTOR/p70S6K pathway and activation of the ERK1/2 pathway. Although insulin treatment phosphorylated Akt (Ser473) and led to autophagy suppression, the effect of insulin treatment was completely abolished by caffeine addition. Caffeine-induced autophagy was not completely blocked by inhibition of ERK1/2 by U0126. Caffeine induced reduction of mitochondrial membrane potentials and apoptosis in a dose-dependent manner, which was further attenuated by the inhibition of autophagy with 3-methyladenine or Atg7 siRNA knockdown. Furthermore, there was a reduced number of early apoptotic cells (annexin V positive, propidium iodide negative) among autophagy-deficient mouse embryonic fibroblasts treated with caffeine than their wild-type counterparts. These results support previous studies on the use of caffeine in the treatment of human tumors and indicate a potential new target in the regulation of apoptosis.
Introduction
Caffeine has a diverse range of pharmacological effects.Citation1 In addition to its various effects on the cell cycle and growth arrest, higher (4–10 mM) concentrations of caffeine can induce apoptosis in several cell lines, such as 10 mM caffeine in human neuroblastoma cells,Citation2 4 mM caffeine in human pancreatic adenocarcinoma cellsCitation3 and 5 mM caffeine in human A549 lung adenocarcinoma cells.Citation4 Although caffeine has been reported to modulate cell cycle checkpoints and perturb molecular targets of the cell cycle, the exact mechanism of caffeine-induced apoptosis remains unclear.Citation1
Autophagy is a key mechanism in various physiopathological processes, including tumorigenesis, development, cell death and survival.Citation5,Citation6 It has also been shown to have a complex relationship with apoptosis, especially in tumor cell lines.Citation7 Several reports have shown that autophagy not only enhances caspase-dependent cell death, but is also required for it.Citation8 In contrast, it has also been shown that autophagy plays an important role in promoting cell survival against apoptosis.Citation7 Caffeine has been reported to inhibit some kinase activities, including various forms of phosphoinositol-3 kinase and mammalian target of rapamycin (mTOR).Citation9,Citation10 Recently, in food spoilage studies involving yeast, caffeine has been shown to induce a starvation response,Citation11 which is a key regulator of autophagy causing its induction. However, the exact mechanism by which caffeine induces autophagy is still unknown.
Here we report that higher concentrations of caffeine enhance autophagic flux in a dose-dependent manner in various cell lines. Furthermore, we show that caffeine-induced autophagy is mainly dependent on PI3K/Akt/mTOR/p70S6 signaling and eventually results in apoptosis.
Results and Discussion
Caffeine () is a widely used psychoactive drug that has been used for centuries to increase alertness and energy. It has been reported that caffeine induces autophagy in Zygosaccharomyces bailii in association with a starvation response, caused by a unknown mechanism.Citation11 However, it remains unknown whether caffeine affects autophagy in mammalian cells. To determine if caffeine regulates autophagy at a steady state, we first examined levels of the microtubule-associated protein 1 light chain 3 (LC3)-II, which is an LC3-phosphatidyl-ethanolamine conjugate and a promising autophagosomal marker.Citation12 LC3-II levels (compared to actin loading controls) increased with 525 mM caffeine treatment over 48 hours in SH-SY5Y ( and C), PC12D and HeLa cells (Suppl. Fig. S1A and B). The LC3-II/actin ratio also increased in a time-dependent manner in SH-SY5Y ( and E) and HeLa cells (data not shown). Using an electron microscopy technique, the numbers of autophagic vacuoles (AVs) were markedly increased in SH-SY5Y cells treated with 10 or 25 mM caffeine, but not in the control ( and G). Morphometric analysis revealed that the number of AVs per 100 µm2 of SH-SY5Y cytoplasm in control (Mean ± standard deviation: 1.3 ± 0.50), whereas that in caffeine-treated cells (10 mM: 8.0 ± 0.82; 25 mM: 15 ± 1.9) for 24 hours. Expression levels of p62, a well-known autophagic substrate, were also decreased by caffeine treatment in SH-SY5Y ( and I) and HeLa cells (Suppl. Fig. S1C and D). Furthermore, 10 mM caffeine treatment markedly increased the number of EGFP-LC3-positive vesicles in SH-SY5Y cells transiently transfected with EGFP-LC3 (data not shown) and HeLa cells stably expressing EGFP-LC3 ( and K).Citation12,Citation13 This effect was confirmed by the observation that caffeine administration also increased the number of vesicles positive to endogenous LC3 (Suppl. Fig. S1E).
Endogenous LC3 is post-transcriptionally processed into LC3-I, which is found in the cytosol. LC3-I is in turn lipidated to LC3-II, which then associates with autophagosome membranes.Citation14 LC3-II can accumulate due to increased upstream autophagosome formation or impaired downstream autophagosome-lysosome fusion. To distinguish between these two possibilities, we assayed LC3-II in the presence of E64D plus pepstatin A or bafilomycin A1, which inhibits lysosomal proteases or blocks downstream autophagosome-lysosome fusion and lysosomal pro-teases, respectively.Citation15,Citation16 Caffeine significantly increased LC3-II levels in the presence of E64d plus pepstatin A or bafilomycin compared to E64d plus pepstatin A or bafilomycin alone in ( and B; Suppl. Fig. S1F and G) and HeLa cells ( and D; Suppl. Fig. S1H and I). A saturating dosage of bafilomycin A1 was used in this assay and no further increases in LC3-II levels were observed when cells were treated with higher concentrations. Similar results were observed in PC12D cell lines (data not shown). To confirm the caffeine effect on autophagic flux, we assessed the numbers of autolysosomes and autophagosomes in HeLa cells. The ratio of the numbers of autolysosomes (positive to both LC3 and LAMP2) to autophagosomes (positive to LC3) was increased by 10 mM caffeine treatment for 48 hours (). Quantification data using ImageJ also showed significant increase of the ratio (). These results strongly indicate that high concentration of caffeine treatment enhances autophagic flux.
The class I phosphatidylinositol 3-phosphate kinase (PI3K)/ Akt/mTOR/p70ribosomal protein S6 kinase (p70S6K) signaling pathway and the Ras/Raf-1/mitogen-activated protein kinase 1/2 (MEK1/2)/extracellular signal-regulated kinase 1/2 (ERK1/2) pathway are two well-known pathways involved in the regulation of autophagy. Both are associated with tumorigenesis and often activated in numerous types of tumors.Citation17 Therefore, we examined the effect of caffeine on both of these pathways, using western blotting, according to the protocol by Inoki and colleagues.Citation18 After a 24 hour treatment with caffeine, there was a significant decrease in the levels of phosphorylated p70 S6 kinase, S6 ribosomal protein and 4E-BP1, compared with total normal levels in SH-SY5Y (), HeLa and PC12D cells (data not shown). Consistent with these results, nonphosphorylated 4E-BP1 proteins were increased by caffeine treatment (). To further investigate the upstream inhibition of mTOR by caffeine, we examined Ser473 phosphorylation of Akt, which measures both Akt/mTOR and mTORC2 activity. As shown in , treatment with caffeine also decreased the level of phosphorylated Akt in SH-SY5Y cells, which was consistent with a previous report.Citation19 Similar findings were obtained in HeLa (Suppl. Fig. S2A) and PC12D cells (data not shown). Subsequently, we examined whether caffeine increases the phosphorylation of ERK1/2, a key regulator of autophagy downstream of Akt. As shown in , treatment with caffeine increased phosphorylated ERK1/2. The effects of caffeine on mTOR inhibition were initially detected 3 hours after the addition of caffeine and reached a maximal level after 6 hours in SH-SY5Y () and 9 hours in HeLa cells (Suppl. Fig. S2B and C).
Caffeine has been shown to inhibit PI3K and components of the PI3K/Akt pathway.Citation9,Citation20 Next, we performed experiments to confirm whether caffeine-induced autophagy is activated through the PI3K/Akt pathway. Insulin or insulin-like growth factor upregulates PI3K and its downstream targets including Akt and mTOR, resulting in the inactivation of autophagy.Citation21–Citation23 As shown in and B, insulin treatment for 30 minutes significantly phosphorylated Akt at Ser473, whereas the phosphorylation was completely abolished by additional treatment with caffeine. No significant differences of the LC3-II/actin ratio between caffeine treatment and caffeine treatment with insulin were observed. Also, caffeine and Akt1/2 inhibitors did not have additive effects on the levels of LC3-II/actin ratio compared to the single treatment of caffeine or Akt inhibitors ( and D). To further confirm the caffeine effects on this pathway, cells were transiently transfected with myristoylated Akt (myr-Akt), a constitutively active form of Akt.Citation24 Caffeine treatment of both cells transfected with control vector and myr-Akt markedly decreased the levels of the phosphorylated Akt (), indicating that caffeine directly inhibits the Akt phosphorylation. If caffeine facilitates autophagy through PI3K/Akt and ERK1/2 signalings, the autophagy should be partially blocked by ERK1/2 inhibition using the mitogen-activated protein kinase kinase 1/2 (MEK1/2) inhibitor, U0126. U0126 significantly but mildly reversed the levels of LC3-II/actin ratio ( and G). The failure of U1026 to reverse completely the caffeine effect can be explained by the autophagy induction through Akt/mTOR signaling. In addition, only Akt knockdown with inducible short hairpin RNAs (shRNAs) to specifically and stably knock down all three Akt isoforms sufficiently increases autophagic flux.Citation25 Therefore, we concluded that the caffeine-induced autophagy is mainly dependent on the PI3K/Akt/mTOR pathway.
Because caffeine induces autophagy dependently of mTOR inhibition, we hypothesized that combination treatment of caffeine with rapamycin would not have additive effects on autophagy. However, caffeine and rapamycin showed an additive effect on the enhancement of LC3-II/actin ratio compared to the single treatment of caffeine or rapamycin ( and B). Several lines of evidences support the hypothesis that resistance to rapamycin results from a positive feedback loop from mTOR/S6K1 to Akt, resulting in enhancement of Akt phosphorylation at Ser 473.Citation26–Citation28 Recently, mutual suppression of the PI3K/Akt/ mTOR pathway by combination of rapamycin with perifosine, an Akt inhibitor, induces synergistic effects on autophagy-induced apoptosis as well as enhancement of autophagy, suggesting that dual inhibition of the PI3K/Akt/mTOR by rapamycin with caffeine would be also a rational treatment for cancer.Citation29
Several anti-cancer agents are known to inhibit the PI3K/Akt/ mTOR/p70S6K pathway and simultaneously activate ERK1/2, resulting in induction of autophagy in tumor cell lines.Citation30,Citation31 The upregulation of this process has beneficial effects in neurodegenerative diseases, such as Parkinson and Huntington diseases, whereas an excess of autophagy can lead to cell death.Citation32,Citation33 Therefore, we decided to investigate whether caffeine-induced autophagy rescues or induces cell death. Using PC12D cells treated with 1-methyl-4-phenylpyridinium (MPP+), a well-established Parkinson disease model,Citation34 we determined that 1 mM caffeine treatment was not sufficient for the induction of autophagy (Suppl. Fig. S4 and B) and promoted increased cell viability, whereas >2.5 mM caffeine decreased cell viability (). In addition, a significant decrease in cell viability was noted in cells treated with >2.5 mM caffeine without MPP+. Also, mitochondrial membrane potentials assessed by JC-1 were significantly preserved by 1 mM caffeine treatment compared to the control with MPP+, while those were lost by >5 mM caffeine treatment ( and Suppl. Fig. S5A). These data suggest that caffeine-induced autophagy is not protective in these cell lines and leads to cell death.
Autophagy and apoptosis may act independently in parallel pathways or may influence one another.Citation7 To confirm the relationship between these pathways in cells treated with caffeine, we examined caffeine effects on the cell cycle with a propidium iodide (PI) staining assay. Treatment with 2.5–10 mM caffeine increased the percentage of cells in the sub-G1 peak, which is indicative of apoptosis (). To confirm whether caffeine-induced cell death is apoptotic, we examined the activity of caspase-3, a well-known inducer of apoptosis. Treatment with 10 mM caffeine markedly increased levels of cleaved caspase-3 and decreased full-length caspase-3 in PC12D cells (), consistent with previous reports on the induction of apoptosis by caffeine.Citation35–Citation37
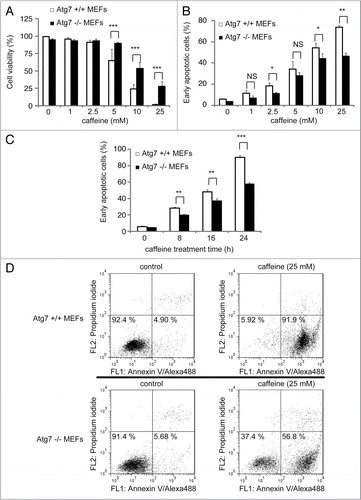
To test whether caffeine-induced apoptosis is dependent on autophagy, we determined whether the inhibition of autophagy by 3-methyladenine (3-MA) or Atg7 siRNA knockdown affects caffeine-induced cytotoxicity in PC12D cells. Treatment with 1 or 5 mM 3MA or Atg7 knockdown significantly decreased the percentage of cell death or cells with reduced mitochondrial membrane potentials caused by caffeine treatment (5 or 10 mM) ( and F and Suppl. Fig. S6B). As can be seen from the increased caffeine-induced apoptosis shown in and C, our data suggests that caffeine-induced autophagy is necessary for apoptotic cell death. To further confirm this, we compared autophagy-deficient mouse embryonic fibroblasts (MEFs), lacking the Atg7 gene (Atg7−/−), without LC3-II expression (Suppl. Fig. S4E), and matched wild-type (Atg7+/+) MEFs, in which autophagy is induced by caffeine in a dose-dependent manner (Suppl. Fig. S4C and D). As expected, the level of caffeine-induced cell death (positive to trypan blue staining) in Atg7−/− MEFs was less than that in Atg7+/+ MEFs (). The numbers of early apoptotic cells (annexin V positive, PI negative) were significantly increased in both a time-dependent and dose-dependent manner by caffeine treatment of Atg7+/+ MEFs compared to Atg7−/− MEFs (). Also, apoptotic or necrotic cells (annexin V positive) were significantly increased by caffeine treatment of Atg7+/+ MEFs compared to Atg7−/− MEFs (Suppl. Fig. S6). Together, these results indicate that caffeine-induced autophagy partly occurs upstream of apoptosis and is not a protective response to caffeine.
In various tumor cell lines, higher concentrations of caffeine alone induce p53-dependent G1 phase arrest and under certain conditions apoptosis can also occur in a p53-independent manner.Citation1 Furthermore, disruption at the G2/M checkpoint by caffeine allows cells time to repair DNA damage by driving them through mitosis, eventually resulting in apoptosis.Citation36,Citation38,Citation39 Consistent with these reports, the results of our study indicate that increased concentrations of caffeine treatment cause a dose-dependent increase in apoptosis. More recently, autophagy, a process long known to provide a survival advantage to cells undergoing nutrient deprivation and other stresses, has also been linked to the cell death process.Citation7 The cross-talk between apoptosis and autophagy is complex and sometimes contradictory; however, it is critical to the overall fate of the cell. In this study, we have shown that autophagy is induced by higher concentrations of caffeine without starvation, mainly via the inhibition of PI3K/Akt/mTOR/p70S6K signaling. Likewise, when caffeine-induced autophagy is blocked by 3-MA treatment or Atg7 knockout, apoptosis is partially attenuated, suggesting that caffeine-induced autophagy occurs upstream of caffeine-induced apoptosis. It also indicates the involvement of other pathways in caffeine-induced apoptosis. These results provide new insight into the effects of caffeine on cell death and survival and its use as a possible intervention strategy for the upregulation of apoptosis by a harnessing of its autophagic activity in tumor treatment.
Materials and Methods
Cell line.
HeLa cells were maintained in DMEM (Sigma) supplemented with 10% fetal bovine serum (FBS) (Sigma) and 100 U/ml penicillin/streptomycin (Sigma) at 37°C and 5% CO2. PC12D and SH-SY5Y cells were maintained in DMEM (Sigma) supplemented with 10% FBS (Sigma), 5% horse serum and 100 U/ml penicillin/streptomycin at 37°C and 5% CO2. All experiments with PC12D were performed after differentiation with NGF treatment for 48 hours. Atg7+/+ and −/− MEFs were maintained in DMEM (Sigma) supplemented with 10% FBS, 100 U/ml penicillin/streptomycin, 1% sodium pyruvate (Gibco, 11360), 1% non-essential amino acid (NEAA) and 4.2 µl 2% beta-mercaptoethanol at 37°C.
To establish a HeLa GFP-LC3 stable cell line, proliferating HeLa cells were transfected with a GFP-LC3 plasmid.Citation14 Forty-eight hours post-transfection with Lipofectamine 2000 (Invitrogen), positive stable clones were selected by growing cells with G418 (400 µg/ml) for 2 weeks and maintained in DMEM (Sigma) supplemented with 10% FBS (Sigma), 100 U/ml penicillin/streptomycin and 200 µg/ml G418 at 37°C and 5% CO2. All cellular experiments were performed with cells cultured in complete medium with FBS as explained above.
Cell viability assays.
A trypan blue dye (Invitrogen, 15250-061) exclusion assay was used to examine cell viability and performed according to previously reported protocols.Citation40,Citation41 Changes of mitochondrial membrane potentials were assessed also with the lipophilic cationic membrane potential-sensitive dye JC-1 (5,5′,6,6′-tetrachloro-1,1′,3,3′-tetraehylbenzimidazolylcarbocyanineiodide) (Wako, 106-00131) according to the manufacturer's protocol. Detection of early apoptotic cells was determined using an annexin V/propidium iodide (PI) detection kit (Invitrogen), according to the manufacturer's protocol. Briefly, 0.5 × 10⁶ Atg7+/+ or −/− MEFs were exposed to caffeine (0–25 mM) for 24 hours and washed twice. Then, they were incubated at room temperature with annexin V/Alexa488 and PI for 15 minutes. Annexin V+PI− cells, considered as early apoptotic cells, were enumerated using FACScan (BD Biosciences). Data were analyzed with CellQuest (BD Biosciences) and FlowJo softwares (Tree Star Inc.). Cells positive or negative for annexin V were regarded as apoptotic or non-apoptotic cells, respectively.
Cell cycle analysis.
To examine apoptosis, 1.0 × 10⁴ cells/well PC12D cells were seeded onto 96-well culture plate and incubated for 48 h in DMEM with NGF and treated with caffeine for 72 h. The cells were harvested and washed with PBS and fixed with ice-cold 70% ethanol at 4C for 2 h. The cells were then stained with PI solution according to previously reported protocol.Citation41 DNA content was analyzed by flow cytometry using FACScan and CellQuest software (BD Biosciences).
Compounds.
Compounds used included caffeine (Wako, 031-06792), E64d (Sigma, E8640), pepstatin A (Sigma, P5318), rapamycin (LC Laboratories, R5000), CCI-779 (Selleck Chemicals, S1044), MPP+ (Sigma, M0896), bafilomycin A1 (Sigma, B1793), 3-methyladenine (Sigma, M9281), insulin (Sigma, I0516), U0126 (Sigma, U120), Akt1/2 inhibitors (Sigma, A6730), staurosporine (Cell Signaling Technology, 9953) and DMSO (Sigma, D2650).
Plasmid DNAs.
Myrystoylated Akt (21–151), a constitutively active form of Akt, was purchased from Millipore.
siRNA knockdown experiments. PC12D cells were transfected with rat Atg7 siRNAs (Invitrogen, 10620318-9) using Lipofectamine RNAiMAX (Invitrogen, 13778-075) according to the manufacturer's protocol.
Western blotting.
Cell pellets were lysed on ice in RIPA buffer for 20 minutes in the presence of protease inhibitor (Roche). Western blotting was performed according to a previously published report.Citation42 The antibodies used were as follows: anti-p70 ribosomal protein (Cell Signaling Technology, 2708), anti-ribosomal protein (Cell Signaling Technology, 2217), anti-4E-BP1 (Cell Signaling Technology, 9452), anti-Akt (Cell Signaling Technology, 9272), anti-p44/42 MAP kinase (Cell Signaling Technology, 9102), anti-phospho-p70 ribosomal protein (Thr389) (Cell Signaling Technology, 9205), anti-phospho-S6 ribosomal protein (Ser235/236) (Cell Signaling Technology, 2211), anti-phospho-4E-BP1 (Thr37/46) (Cell Signaling Technology, 9459), anti-phospho-p44/p42 MAPK (Thy202/Tyr204) (Cell Signaling Technology, 9101), anti-Atg7 (Cell Signaling Technology, 2631), anti-phospho-Akt (Cell Signaling Technology, 4060), anti-actin (Millipore, clone C4), anti-LC3 (MBL, clone 4E12), anti-p62 (Progen Biotechnik, GP62-C) antibodies. Antibody signals were enhanced with chemifluorescent methods from GE HealthCare.
Immunofluorescent microscopy.
Cells were embedded with 4% paraformaldehyde for 20 minutes. Following this, they were permeabilized with 0.1% Triton-X in 1x PBS. After incubation with 10% FBS and 1% bovine serum albumin in 1x PBS for 30 minutes, cells were immunostained with anti-LC3B (x500) (Sigma, L7543), anti-LAMP2 (x50) (Development Studies Hybridoma Bank, clone H4B4) overnight and incubated with anti-rabbit IgG tagged with AlexaFluor 488 or anti-mouse IgG tagged with AlexaFluor 546 for 1 hour. The cover slips were embedded with VectaShield, stained with DAPI and images were acquired on a Zeiss LSM510 META confocal microscope (63 × 1.4 NA) or a Leica TCS SP5 confocal microscope at room temperature using Zeiss LSM510 v.3.2 software or Leica LAS AF software. Adobe Photoshop 7.0 (Adobe Systems Inc.) was used for subsequent image processing. For colocalization assay in HeLa cells, an appropriate confocal image was taken with Leica LAS AF software. Then, these images were analyzed automatically with the ImageJ “Colocalization” Plugin (Settings: Each threshold: 25, Ratio: 75%) followed by “Analyze particles” (Settings: threshold 25; Pixel: 1) between endogenous LC3 positive and LAMP2 vesicles. Experiments were done in triplicate at least twice.
Quantification of cells with GFP-LC3 vesicles.
HeLa cells stable expressing GFP-LC3 were treated with various concentrations of caffeine for 24 or 48 hours and then fixed as described above. Analyses in triplicate were done for counting the proportion of GFP-positive cells with GFP-LC3 vesicles as previously described in reference Citation43.
Electron microscopy.
SH-SY5Y cells treated with various concentrations of caffeine were prefixed in 2% glutaraldehyde in PBS at 4°C, treated with 1% OsO4 for 3 hours at 4°C, dehydrated in a graded series of ethanol and flat embedded in epon. Ultra-thin sections were doubly stained with uranyl acetate and observed using a JEOL JEM-2000EX electron microscopy at 80 kV.
Statistical analysis.
Densitometry analysis was performed using ImageJ 1.43 on immunoblots from three independent experiments. A t-test was performed with SYSTAT software (Hulinks).
Abbreviations
| PI3K | = | phosphoinositide-3 kinase |
| 4E-BP1 | = | eukaryotic initiation factor 4-binding protein 1 |
| ERK | = | extracellular signal-regulated kinase |
| mTOR | = | mammalian target of rapamycin |
| 3-MA | = | 3-methyladenine |
| MEFs | = | mouse embryonic fibroblasts |
| p70S6K | = | 70-kDa ribosomal protein S6 kinase |
| PI | = | propidium iodide |
| MPP+ | = | 1-methyl-4-phenylpyridinium |
Figures and Tables
Figure 1A–G Caffeine increases autophagic flux in various cell lines. (A) structural formula of caffeine. (B and C) SH-SY5Y cells treated with various concentrations of caffeine for 24 or 48 hours were analyzed by immunoblotting (B) with antibodies against LC3 and actin. Densitometry analysis of LC3-II levels relative to actin (C) was performed using three independent experiments. (D and E) SH-SY5Y cells treated with 25 mM caffeine for 3–24 hours were analyzed by immunoblotting (D) with antibodies against LC3 and actin. Densitometry analysis of LC3-II levels relative to actin (E) was performed using three independent experiments. (F) Electron microscopic examination of SH-SY5Y cells treated with various concentrations of caffeine for 24 or 48 hours. Autophagic vacuoles accumulating in the cytoplasm are shown by arrows. (G) Morphometric analysis of autophagic vacuoles was performed with 30 different areas of the cytoplasm of control and caffeine-treated cells.
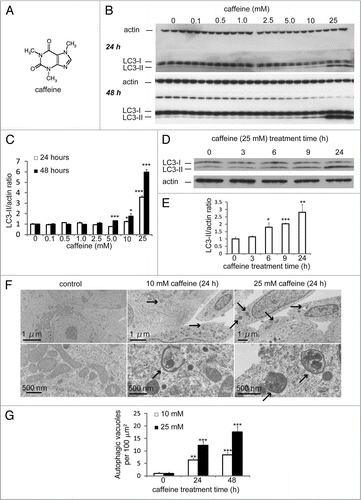
Figure 1H–K Caffeine increases autophagic flux in various cell lines. (H and I) SH-SY5Y cells treated with various concentrations of caffeine for 24 or 48 hours were analyzed by immunoblotting with antibodies against p62 and actin. Densitometry analysis of p62 levels relative to actin (I) was performed using three independent experiments. (J and K) HeLa cells stably expressing EGFP-LC3 were treated with various concentrations of caffeine for 24 hours and analyzed using confocal microscopy. The percentage of EGFP-positive HeLa cells with >5 EGFP-LC3 vesicles was assessed (K) described previously in reference Citation43. Error bars, S.D.; *p < 0.05; **p < 0.01.
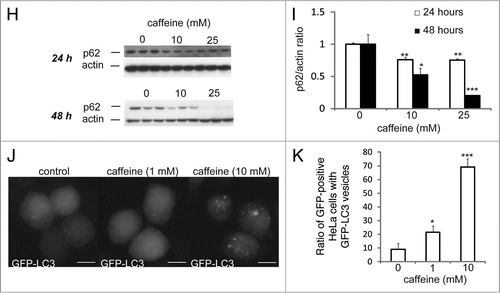
Figure 2 Caffeine does not block autophagosome-lysosome fusion. (A–D) SH-SY5Y (A) or heLa (C) cells treated with 10 mM caffeine with or without E64d (10 µg/ml) and pepstatin A (10 µg/ml) were analyzed by immunoblotting with antibodies against LC3 and actin. Densitometry analysis of LC3 levels relative to actin in SH-SY5Y (B) and HeLa (D) cells was performed using three independent experiments. (E and F) HeLa cells treated with various concentrations of caffeine for 48 hours were analyzed using confocal microscopy (E). Number of the autolysosomes and autophagosomes were automatically counted using imageJ “Colocalization” Plugin and the ratios were calculated (F).
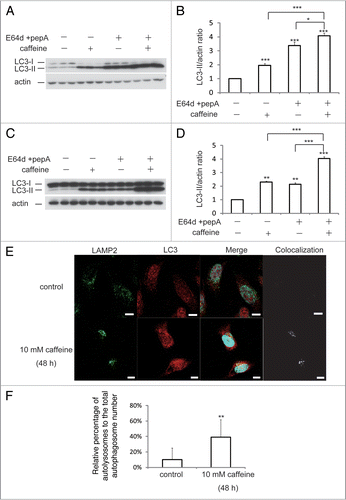
Figure 3 Caffeine inhibits the Akt/mTOR/p70S6 signaling pathway and activates ERK1/2 signaling. (A and B) SH-SY5Y cells treated with or without 10 mM caffeine for 24 hours were analyzed for mTOR activity by immunoblotting for levels of phosphor- and total p70 ribosomal S6 protein, S6, 4E-BP1 (A), Akt (B) and actin. (C) Sh-SY5Y cells treated with or without 10 mM caffeine for 0, 3, 6 or 9 hours were analyzed by immunoblotting for levels of phosphor- and total ERK1/2 and actin. (D) SH-SY5Y cells treated with 10 mM caffeine for various time periods were analyzed by immunoblotting for levels of phosphor- and total p70 ribosomal S6 protein, S6, 4E-BP1 and actin.
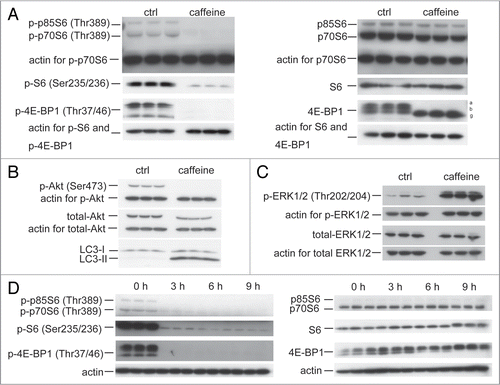
Figure 4 Caffeine-induced autophagy is dependent on PI3K/Akt/mTOR pathway. (A) SH-SY5Y cells treated with 25 mM caffeine for 3 hours followed by treatment with or without 200 nM insulin for 30 minutes were analyzed by immunoblotting. (B) Densitometry analysis of LC3-II levels relative to actin was performed using three independent experiments. (C) SH-SY5Y cells treated with 25 mM caffeine, 50 µM Akt1/2 inhibitors or 25 mM caffeine with 50 µM Akt1/2 inhibitors for 6 hours were analyzed by immunoblotting. (D) Densitometry analysis of LC3-II levels relative to actin was performed using three independent experiments. (E) SH-SY5Y cells were transfected for 24 hours with either a control plasmid DNA (pcDNA3.1) or a plasmid encoding constitutively active Akt (myr-Akt), and then treated with H2O or 10 mM caffeine for 6 hours. Immunoblotting was performed using antibodies against Akt, p-Akt (Ser 473) and actin. (F) SH-SY5Y cells treated with 25 mM caffeine with or without 20 µM U0126 for 6 hours were analyzed by immunoblotting using antibodies against actin, LC3, p-ERK and ERK. (G) Densitometry analysis was performed using three independent experiments. Error bars, SD; *p < 0.05; **p < 0.01; N.s., not significant.
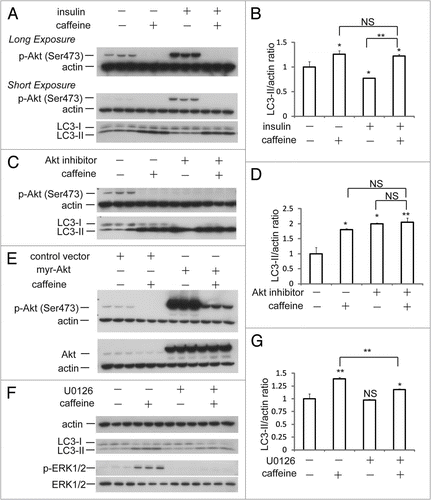
Figure 5 Rapamycin treatment with caffeine has an additive effect on enhancement of autophagy. (A) SH-SY5Y cells treated with various concentrations of rapamycin with or without 10 mM caffeine for 48 hours were analyzed by immunoblotting. (B) Densitometry analysis was performed using three independent experiments. Error bars, SD; *p < 0.05; **p < 0.01; N.s., not significant.
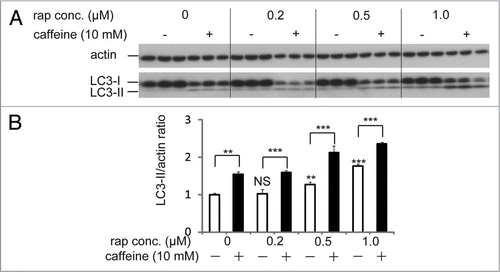
Figure 6 Caffeine induces apoptosis by enhancement of autophagy. (A) After PC12D cells were treated with 0, 1, 2.5, 5 or 10 mM caffeine with DMSO or MPP+ for 72 hours, cell viability was measured using trypan blue dye exclusion assay. Data are the means of triplicate experiments. (B) After cells were treated with 0, 1, 2.5, 5 or 10 mM caffeine with DMSO or MPP+ for 48 hours, mitochondrial membrane potential was analyzed by Jc-1 using a flow cytometry. Data are the means of triplicate experiments. (C) After PC12D cells were treated with 0, 1, 2.5, 5 or 10 mM caffeine with DMSO or MPP+ for 72 hours, caffeine-induced sub G1 area was analyzed by propidium iodide staining assay using a flow cytometry. Data are the means of triplicate experiments. (D) PC12D cells were treated with H2O or caffeine for 24 hours or staurosporine (positive control) for 3 hours and analyzed with immunoblotting for levels of caspase-3 and cleaved caspase-3. (E) After PC12D cells were treated with 0, 1, 2.5, 5 or 10 mM caffeine with or without 1, 3 or 5 mM 3MA for 24 hours, cell viability was measured by trypan blue dye exclusion assay. (F) PC12D cells were transfected with control siRNA or siRNAs targeting Atg7. Forty eight hours later, they were treated with 0, 1, 2.5 or 10 mM caffeine for 24 hours and mitochondrial membrane potential was analyzed using Jc-1. The knockdown effects on Atg7 were confirmed by immunoblotting using antibodies against Atg7 and actin. Data are the means of triplicate experiments. Error bars, S.D. NS, not significant; *p < 0.05; **p < 0.01; ***p < 0.001.
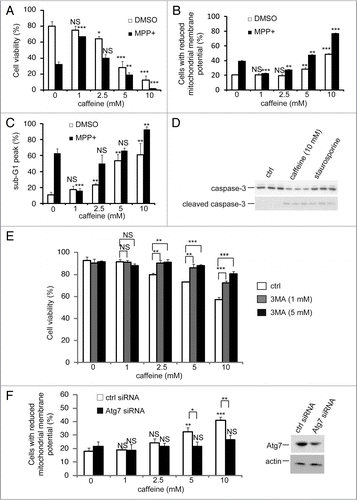
Figure 7 Cells without Atg7 expression are more resistant to caffeine-induced apoptosis. (A) After Atg7+/+ or −/− mouse embryonic fibroblasts (MEFs) were treated with 0, 1, 2.5, 5, 10, 25 mM caffeine for 24 hours, the cell viability was measured by trypan blue dye exclusion assay. Data are the means of triplicate experiments. (B–D) Fluorescence-activated cell-sorting analysis for annexin V/propidium iodide (PI). Atg7+/+ or −/− MEFs were cultured with various concentrations of caffeine for 24 hours (B) or with 25 mM caffeine for various times (0, 8, 16 or 24 hours) (C and D). Annexin V/PI staining was subsequently performed to assess early or late apoptosis and necrosis. 5 × 10³ cells were analyzed by flow cytometry and the percentage of early apoptotic cells (annexin V-positive and PI-negative cells, the lower right region in (D) was determined). Data are the means of triplicate experiments. Error bars, SD. NS, not significant; *p < 0.05; **p < 0.01; ***p < 0.001.
Additional material
Download Zip (4.1 MB)Acknowledgements
We thank Dr. Takashi Ueno (Department of Biochemistry, Juntendo University) for critical comments and Drs. Masaaki Komatsu and Yu-Shin Sou for providing Atg7+/+ and −/− MEFs. We are very grateful for a grant from Hayashi Memorial Foundation for Female Natural Scientists (Y.S.), the Grant-in-Aid for Young Scientists (B) (S. Saiki and F. Sato), grants from the All Japan Coffee Association (S. Saiki), the Takeda Scientific Foundation (S. Saiki) and the Nagao Memorial Fund (S. Saiki).
References
- Bode AM, Dong Z. The enigmatic effects of caffeine in cell cycle and cancer. Cancer Lett 2007; 247:26 - 39
- Jang MH, Shin MC, Kang IS, Baik HH, Cho YH, Chu JP, et al. Caffeine induces apoptosis in human neuroblastoma cell line SK-N-MC. J Korean Med Sci 2002; 17:674 - 678
- Gururajanna B, Al-Katib AA, Li YW, Aranha O, Vaitkevicius VK, Sarkar FH. Molecular effects of taxol and caffeine on pancreatic cancer cells. Int J Mol Med 1999; 4:501 - 507
- Qi W, Qiao D, Martinez JD. Caffeine induces TP53-independent G(1)-phase arrest and apoptosis in human lung tumor cells in a dose-dependent manner. Radiat Res 2002; 157:166 - 174
- Mizushima N, Levine B, Cuervo AM, Klionsky DJ. Autophagy fights disease through cellular self-digestion. Nature 2008; 451:1069 - 1075
- Rubinsztein DC. The roles of intracellular protein-degradation pathways in neurodegeneration. Nature 2006; 443:780 - 786
- Eisenberg-Lerner A, Bialik S, Simon HU, Kimchi A. Life and death partners: apoptosis, autophagy and the cross-talk between them. Cell Death Differ 2009; 16:966 - 975
- Espert L, Denizot M, Grimaldi M, Robert-Hebmann V, Gay B, Varbanov M, et al. Autophagy is involved in T cell death after binding of HIV-1 envelope proteins to CXCR4. J Clin Invest 2006; 116:2161 - 2172
- Foukas LC, Daniele N, Ktori C, Anderson KE, Jensen J, Shepherd PR. Direct effects of caffeine and theophylline on p110delta and other phosphoinositide 3-kinases. Differential effects on lipid kinase and protein kinase activities. J Biol Chem 2002; 277:37124 - 37130
- Kudchodkar SB, Yu Y, Maguire TG, Alwine JC. Human cytomegalovirus infection alters the substrate specificities and rapamycin sensitivities of raptor- and rictor-containing complexes. Proc Natl Acad Sci USA 2006; 103:14182 - 14187
- Winter G, Hazan R, Bakalinsky AT, Abeliovich H. Caffeine induces macroautophagy and confers a cytocidal effect on food spoilage yeast in combination with benzoic acid. Autophagy 2008; 4:28 - 36
- Rubinsztein DC, Cuervo AM, Ravikumar B, Sarkar S, Korolchuk V, Kaushik S, Klionsky DJ. In search of an “autophagomometer”. Autophagy 2009; 5:585 - 589
- Tanida I, Ueno T. Kominami Em LC3 and Autophagy. Methods Mol Biol 2008; 445:77 - 88
- Kabeya Y, Mizushima N, Ueno T, Yamamoto A, Kirisako T, Noda T, et al. LC3, a mammalian homologue of yeast Apg8p, is localized in autophagosome membranes after processing. EMBO J 2000; 19:5720 - 5728
- Yamamoto A, Tagawa Y, Yoshimori T, Moriyama Y, Masaki R, Tashiro Y. Bafilomycin A1 prevents maturation of autophagic vacuoles by inhibiting fusion between autophagosomes and lysosomes in rat hepatoma cell line, H-4-II-E cells. Cell Struct Funct 1998; 23:33 - 42
- Mizushima N, Yoshimori T, Levine B. Methods in mammalian autophagy research. Cell 140:313 - 326
- Hanahan D, Weinberg RA. The hallmarks of cancer. Cell 2000; 100:57 - 70
- Ikenoue T, Hong S, Inoki K. Monitoring mammalian target of rapamycin (mTOR) activity. Methods Enzymol 2009; 452:165 - 180
- Sinn B, Tallen G, Schroeder G, Grassl B, Schulze J, Budach V, Tinhofer I. Caffeine confers radiosensitization of PTEN-deficient malignant glioma cells by enhancing ionizing radiation-induced G1 arrest and negatively regulating Akt phosphorylation. Mol Cancer Ther 9:480 - 488
- Sarkaria JN, Busby EC, Tibbetts RS, Roos P, Taya Y, Karnitz LM, Abraham RT. Inhibition of ATM and ATR kinase activities by the radiosensitizing agent, caffeine. Cancer Res 1999; 59:4375 - 4382
- Inoki K, Li Y, Xu T, Guan KL. Rheb GTPase is a direct target of TSC2 GAP activity and regulates mTOR signaling. Genes Dev 2003; 17:1829 - 1834
- Inoki K, Li Y, Zhu T, Wu J, Guan KL. TSC2 is phosphorylated and inhibited by Akt and suppresses mTOR signalling. Nat Cell Biol 2002; 4:648 - 657
- Garami A, Zwartkruis FJ, Nobukuni T, Joaquin M, Roccio M, Stocker H, et al. Insulin activation of Rheb, a mediator of mTOR/S6K/4E-BP signaling, is inhibited by TSC1 and 2. Mol Cell 2003; 11:1457 - 1466
- Muise-Helmericks RC, Grimes HL, Bellacosa A, Malstrom SE, Tsichlis PN, Rosen N. Cyclin D expression is controlled post-transcriptionally via a phosphatidylinositol-3-kinase/Akt-dependent pathway. J Biol Chem 1998; 273:29864 - 29872
- Degtyarev M, De Maziere A, Orr C, Lin J, Lee BB, Tien JY, et al. Akt inhibition promotes autophagy and sensitizes PTEN-null tumors to lysosomotropic agents. J Cell Biol 2008; 183:101 - 116
- Wan X, Harkavy B, Shen N, Grohar P, Helman LJ. Rapamycin induces feedback activation of Akt signaling through an IGF-1R-dependent mechanism. Oncogene 2007; 26:1932 - 1940
- Sun SY, Rosenberg LM, Wang X, Zhou Z, Yue P, Fu H, Khuri FR. Activation of Akt and eIF4E survival pathways by rapamycin-mediated mammalian target of rapamycin inhibition. Cancer Res 2005; 65:7052 - 7058
- O'Reilly KE, Rojo F, She QB, Solit D, Mills GB, Smith D, et al. mTOR inhibition induces upstream receptor tyrosine kinase signaling and activates Akt. Cancer Res 2006; 66:1500 - 1508
- Cirstea D, Hideshima T, Rodig S, Santo L, Pozzi S, Vallet S, et al. Dual inhibition of akt/mammalian target of rapamycin pathway by nanoparticle albumin-bound-rapamycin and perifosine induces antitumor activity in multiple myeloma. Mol Cancer Ther 2010; 9:963 - 975
- Aoki H, Takada Y, Kondo S, Sawaya R, Aggarwal BB, Kondo Y. Evidence that curcumin suppresses the growth of malignant gliomas in vitro and in vivo through induction of autophagy: role of Akt and extracellular signal-regulated kinase signaling pathways. Mol Pharmacol 2007; 72:29 - 39
- Ellington AA, Berhow MA, Singletary KW. Inhibition of Akt signaling and enhanced ERK1/2 activity are involved in induction of macroautophagy by triterpenoid B-group soyasaponins in colon cancer cells. Carcinogenesis 2006; 27:298 - 306
- Rubinsztein DC, Gestwicki JE, Murphy LO, Klionsky DJ. Potential therapeutic applications of autophagy. Nat Rev Drug Discov 2007; 6:304 - 312
- Ravikumar B, Vacher C, Berger Z, Davies JE, Luo S, Oroz LG, et al. Inhibition of mTOR induces autophagy and reduces toxicity of polyglutamine expansions in fly and mouse models of Huntington disease. Nat Genet 2004; 36:585 - 595
- Kotake Y, Ohta S. MPP+ analogs acting on mitochondria and inducing neuro-degeneration. Curr Med Chem 2003; 10:2507 - 2516
- Hagan MP, Hopcia KL, Sylvester FC, Held KD. Caffeine-induced apoptosis reveals a persistent lesion after treatment with bromodeoxyuridine and ultraviolet-B light. Radiat Res 1997; 147:674 - 679
- Efferth T, Fabry U, Glatte P, Osieka R. Expression of apoptosis-related oncoproteins and modulation of apoptosis by caffeine in human leukemic cells. J Cancer Res Clin Oncol 1995; 121:648 - 656
- Shinomiya N, Takemura T, Iwamoto K, Rokutanda M. Caffeine induces S-phase apoptosis in cis-diamminedichloroplatinum-treated cells, whereas cis-diamminedichloroplatinum induces a block in G2/M. Cytometry 1997; 27:365 - 373
- Lau CC, Pardee AB. Mechanism by which caffeine potentiates lethality of nitrogen mustard. Proc Natl Acad Sci USA 1982; 79:2942 - 2946
- Takagi M, Shigeta T, Asada M, Iwata S, Nakazawa S, Kanke Y, et al. DNA damage-associated cell cycle and cell death control is differentially modulated by caffeine in clones with p53 mutations. Leukemia 1999; 13:70 - 77
- Ormerod MG, Collins MK, Rodriguez-Tarduchy G, Robertson D. Apoptosis in interleukin-3-dependent haemopoietic cells. Quantification by two flow cytometric methods. J Immunol Methods 1992; 153:57 - 65
- Kawatani M, Uchi M, Simizu S, Osada H, Imoto M. Transmembrane domain of Bcl-2 is required for inhibition of ceramide synthesis, but not cytochrome c release in the pathway of inostamycin-induced apoptosis. Exp Cell Res 2003; 286:57 - 66
- Kawajiri S, Saiki S, Sato S, Sato F, Hatano T, Eguchi H, Hattori N. PINK1 is recruited to mitochondria with parkin and associates with LC3 in mitophagy. FEBS Lett 2010; 584:1073 - 1079
- Sarkar S, Davies JE, Huang Z, Tunnacliffe A, Rubinsztein DC. Trehalose, a novel mTOR-independent autophagy enhancer, accelerates the clearance of mutant huntingtin and alpha-synuclein. J Biol Chem 2007; 282:5641 - 5652