Abstract
Determination of autophagic flux is essential to assess and differentiate between the induction or suppression of autophagy. Western blot analysis for free GFP fragments resulting from the degradation of GFP-LC3 within the autolysosome has been proposed as one of the autophagic flux assays. However, the exact dynamics of GFP-LC3 during the autophagy process are not clear. Moreover, the characterization of this assay in mammalian cells is limited. Here we found that lysosomal acidity is an important regulating factor for the step-wise degradation of GFP-LC3, in which the free GFP fragments are first generated but accumulate only when the lysosomal acidity is moderate, such as during rapamycin treatment. When the lysosomal acidity is high, such as during starvation in Earle's balanced salt solution (EBSS), the GFP fragments are further degraded and thus do not accumulate. Much to our surprise, we found that the level of free GFP fragments increased in the presence of several late stage autophagy inhibitors, such as chloroquine or E64D plus pepstatin A. Furthermore, the amount of free GFP fragments depends on the concentrations of these inhibitors. Unsaturating concentrations of chloroquine or bafilomycin A1 increased the level of free GFP fragments while saturating concentrations did not. Data from the present study demonstrate that GFP-LC3 is degraded in a step-wise fashion in the autolysosome, in which the LC3 portion of the fusion protein appears to be more rapidly degraded than GFP. However, the amount of free GFP fragments does not necessarily correlate with autophagic flux if the lysosomal enzyme activity and pH are changed. Therefore, caution must be used when conducting the GFP-LC3 cleavage assay as a determinant of autophagic flux. In order to accurately assess autophagy, it is more appropriate to assess GFP-LC3 cleavage in the presence or absence of saturating or unsaturating concentrations of chloroquine or bafilomycin A1 together with other autophagy markers, such as levels of p62 and endogenous LC3-II.
Introduction
Macroautophagy (hereafter referred to as autophagy) is a major intracellular degradation system. It is responsible for the degradation of long-lived proteins, organelles and other cellular contents.Citation1,Citation2 It is a bulk degradation system typically activated in response to adverse environmental conditions, such as the deprivation of nutrients or growth factors.Citation3 In addition, increasing evidence suggests that autophagy plays a role in development,Citation1 defense against microbial infections,Citation4 and regulation of organelle homeostasis.Citation5–Citation7 Therefore, misregulation of autophagy can lead to the pathogenesis of a number of human diseases including neurodegenerative disease, heart disease, cancer and aging.Citation8,Citation9
Autophagy is a dynamic process. Upon induction of autophagy, a small piece of double-membrane cisternae (called an isolation membrane or phagophore) engulfs a portion of the cytoplasm and its edges fuse to form a double-membrane-bound autophagosome. The autophagosome subsequently fuses with a lysosome to become an autolysosome, and thereby degrades the cytoplasmic material and organelles using the lysosomal hydrolytic enzymes.Citation10
A ubiquitin-like protein, Atg8 or one of its mammalian orthologs, the microtubule-associated protein 1 light chain 3 (LC3) has been thought to be important for the elongation of the isolation membrane and the eventual closure of the autophagosomal membrane.Citation11 LC3 is conjugated to phosphatidylethanolamine (PE) through an enzymatic cascade involving Atg7, Atg3 and the Atg5-12-16 complex.Citation12,Citation13 The unconjugated form of Atg8/LC3 (called LC3-I) is in the cytosol while the conjugated form (called LC3-II) targets the autophagosomal membrane following the Atg5-12-16 complex.Citation12 The LC3-II on the outer autophagolysosome membrane is deconjugated and removed by the cysteine protease Atg4B and recycled, while the LC3-II on the inner membrane, together with the enveloped cytosolic contents, is degraded by the lysosome. LC3-II stays on the membrane until it is degraded by the lysosome. The level of LC3-II or GFP-LC3-II is thus widely used as a marker for monitoring the autophagic process.Citation14–Citation16
However, because autophagy is a dynamic process, the accumulation of LC3-II or the increased number of GFP-LC3 puncta could be due to either the induction of autophagy or the inhibition of lysosomal function and/or fusion of autophagosomes with lysosomes.Citation14 To solve this problem several autophagic flux assays have been established and recommended to assess autophagy.Citation15,Citation17 One of the assays measures endogenous LC3-II levels in the presence of various lysosomal inhibitors.Citation15 Another widely used assay examines the levels of specific autophagy substrates such as p62/SQSTM1 or NBR1.Citation14,Citation18,Citation19 GFP-LC3 has been thought to behave the same way as endogenous LC3. Previous studies show that GFP is more resistant than LC3 in response to lysosomal degradation and thus the determination of free GFP has been suggested to be a functional autophagic flux assay.Citation14,Citation20 Indeed, in response to autophagy induction, free GFP levels are significantly increased in wild-type yeast cells that express GFP-Atg8 but not in yeast cells that have deleted one or more of the essential autophagy genes.Citation6,Citation21 Free GFP levels are also increased in response to amino acid starvation in an engineered GFP-LC3 mouse embryonic fibroblasts (MEF) cell line in which Atg5 levels are regulated by the “tet-off” system.Citation20 However, the evidence for using the GFP-LC3 cleavage assay to monitor autophagic flux is relatively limited in mammalian cells.
In the present study, we demonstrate that rapamycin, a well-known autophagy inducer by suppression of mTOR, increased free GFP fragments as well as the number of GFP-LC3 puncta and p62 degradation in GFP-LC3 stable cells. In contrast, when cells were starved using EBSS or DMEM-amino acid free medium (DMEM-AA-Free) or Hank's balanced salt solution (HBSS), no increased free GFP fragments were found in several stable GFP-LC3 cell lines, though the number of GFP-LC3 puncta and p62 degradation increased. Interestingly, rapamycin increased but EBSS or DMEM-AA-Free decreased lysosomal pH, indicating the lysosomal acidity is an important factor regulating GFP-LC3 cleavage to produce free GFP fragments. In line with this, increasing lysosomal pH by chloroquine (CQ)Citation22,Citation23 also increased free GFP levels in various cultured GFP-LC3 stable cell lines as well as in GFP-LC3 transgenic mice in vivo. We further found that higher doses (saturating doses) of CQ and bafilomycin A1 (BAF), another widely used autophagy inhibitor that inhibits the vacuolar H+-ATPase (V-ATPase),Citation15,Citation24 fully suppressed GFP-LC3 cleavage. These findings suggest that caution should be taken when using the GFP-LC3 cleavage assay for the determination of autophagic flux. Moreover, our studies further support the notion that GFP-LC3 is degraded in a step-wise fashion in the autolysosome, in which free GFP fragments are first generated but their accumulations depend on the lysosomal acidity. Our studies also define four different modes of GFP-LC3 degradation that can occur depending on the autophagy stimuli, the extent of lysosomal inhibition and change in lysosomal pH.
Results
Rapamycin but not EBSS increases the free GFP fragments in GFP-LC3-expressing cells.
It has been demonstrated that GFP-LC3 can behave in a similar manner as endogenous LC3.Citation20 Phosphatidylethanolamine (PE) conjugated LC3 (LC3-II) is associated with the isolation membranes, sealed autophagosomes and mature autophagosomes/autolysosome.Citation10,Citation20 LC3-II is located on both the lumen and the surface of autophagosomes. Upon fusion with a lysosome, luminal LC3-II is degraded by lysosomal enzymes whereas the surface LC3-II is delipidated and recycled by Atg4B. It has been shown that GFP is more resistant than LC3 to lysosomal degradation, resulting in increased free GFP fragments during autophagy induction. This assay has been widely used in yeast systems.Citation6,Citation25 However, there are very limited studies using this GFP-LC3 cleavage assay in mammalian cells.Citation14
To better characterize this assay in mammalian cells, HeLa cells stably expressing GFP-LC3 were treated with rapamycin (Rap), a well-known autophagy inducer by suppressing mTOR,Citation26 for different concentrations and time points. Rap increased the number of GFP-LC3 puncta in a concentration-dependent manner ( and B). Rap also increased endogenous LC3-II levels, but it seems these effects varied at different concentrations (). Interestingly, Rap treatment increased free GFP fragments from GFP-LC3 cleavage. Both the levels of endogenous LC3-II and GFP were higher in 0.25 µM Rap-treated cells but decreased in 1 µM or 10 µM Rap-treated cells. We think the decrease of LC3-II and GFP was likely due to the higher lysosomal degradative capacity in high dose Rap-treated cells (). In addition, Rap also increased free GFP fragments and endogenous LC3-II levels in a time-dependent manner ().
To further characterize this assay in starvation conditions, we subjected HeLa and MEF cells stably expressing GFP-LC3 to EBSS culture for various time points. We found that the number of GFP-LC3 puncta increased after starvation for 6 hrs (). However, the endogenous LC3-II levels fluctuated during the time course ( and G). LC3-II levels increased at 2 hrs and 6 hrs followed by a decrease at 24 hrs under starvation in both HeLa and MEF cells ( and G). The fluctuation in LC3-II levels suggests that levels of endogenous LC3-II can increase or decrease during starvation due to the dynamic process of autophagy. This also suggests that there may be a resynthesis of LC3 to compensate for the degradation of LC3-II by the autolysosome. However, when we examined the level of free GFP fragments as a result of GFP-LC3 cleavage, we found that when cultured with EBSS there was no detectable free GFP at any time point examined as early as 15 min after EBSS culture. Interestingly, we found that GFP-LC3-I levels decreased in a time-dependent manner during EBSS-induced autophagy ( and G). Similar results were observed in GFP-LC3 stable HCT116 (human colon cancer) and HepG2 (human hepatoma) cell lines (data not shown). To our surprise, treatment with CQ, an anti-malaria agent that increases lysosomal pH,Citation23 dramatically increased free GFP fragments ().
Suppression of autophagy by chloroquine increases the free GFP fragments in GFP-LC3-expressing cells.
The production of free GFP fragments from GFP-LC3 appears to vary between starvation (EBSS) and Rap-induced autophagy. We therefore wondered whether the degradative capacity of starvation-induced autolysosomes would be more potent than that of Rap-induced ones so that not only LC3-II but also free GFP was degraded. To test this hypothesis, we treated HeLa cells stably expressing GFP-LC3 with EBSS in the absence or presence of CQ (10 µM), a typical experimental design to study autophagic flux.Citation14–Citation16 We found that increases in the number of GFP-LC3 puncta and endogenous LC3-II levels caused by starvation were further elevated in the presence of CQ ( and B). Moreover, starvation also led to the degradation of p62/SQSTM1 but this degradation was suppressed by CQ (), confirming the use of the autophagy process for degradation. When we examined the level of free GFP fragments, we confirmed that there was no detectable free GFP after 6 hrs starvation. In contrast, in the presence of CQ, we were able to detect free GFP in the EBSS starved cells (). These data support our hypothesis that the cleavage of GFP-LC3 indeed occurred during starvation. Failure to detect GFP fragments by western blot analysis was likely due to the potent degradative capacity of the autolysosome induced by starvation (EBSS) leading to the degradation of not only LC3 but also GFP. The increased level of free GFP fragments in cells treated with CQ alone suggests that not only LC3-II but also GFP can be degraded even under basal level autophagy.
The finding that CQ alone increased free GFP fragments while suppressing autophagy was surprising. To further confirm this finding we examined whether this would be true in other GFP-LC3 stable cell lines. Consistently we found that CQ could significantly increase the free GFP levels in a time-dependent manner in several GFP-LC3 stable cell lines including HCT116, HepG2, HeLa () and MEF cells (data not shown). In all these cell lines, CQ suppressed p62 degradation and increased endogenous LC3-II levels () as well as the number of GFP-LC3 puncta () suggesting that CQ inhibited the basal autophagy. To examine whether CQ would induce similar effects in vivo we intraperitoneally injected CQ (60 mg/kg) into GFP-LC3 transgenic mice for 16 hrs. Studying the cryo sections of livers with confocal microscopy revealed a significant increase in the number of GFP-LC3 puncta in hepatocytes from CQ-treated mice (). CQ treatment also dramatically increased the free GFP fragments as well as the endogenous LC3-II levels in the total liver lysates (). These data clearly indicate that CQ can not only increase free GFP levels in vitro but also in vivo in mouse liver. To further determine whether the GFP-LC3 cleavage assay could also be used to monitor starvation-induced autophagy in vivo, GFP-LC3 mice were either starved or fed with or without a CQ injection 6 hrs before the mice were sacrificed. Similar to the in vitro cell culture, free GFP-fragments were barely detectable in the starved mouse liver lysates but increased in CQ-treated starved mouse liver lysates and increased further in CQ-treated fed mouse liver lysates ().
A saturating dose of lysosomal inhibitors is required to eliminate free GFP production.
The finding that CQ treatment increased free GFP levels in various GFP-LC3 stable cell lines and in vivo in the mouse liver while suppressing autophagy was paradoxical. The increased free GFP level has been proposed as an autophagic flux marker because it reflects cleavage from the GFP-LC3 resulting from degradation in the autolysosomal compartments, primarily studied in the yeast system.Citation14 It is well known that CQ suppresses the capacity of lysosomal degradation by increasing lysosomal pH and thus suppressing autophagy.Citation23 If this is the case one would expect to see less free GFP production by CQ treatment because of the suppression of GFP-LC3 cleavage. One possible explanation for the CQ-induced increase of free GFP fragments seen in this study could be that the concentration of CQ used was unable to completely suppress lysosomal function. Accordingly, a portion of GFP-LC3 was still cleaved to generate free GFP fragments. However, further degradation of free GFP was blocked. To test this hypothesis we treated GFP-LC3 HeLa cells with various concentrations of CQ from 10 µM to 150 µM. As shown in , CQ treatment resulted in significant free GFP fragments at concentrations from 10 to 30 µM but not from 40 µM to 150 µM. Similarly, no further increase of endogenous LC3-II, p62, or the number of GFP-LC3 puncta was observed when more than 40 µM of CQ was employed ( and B). These results clearly indicate that 40 µM is the minimal saturating concentration of CQ necessary to reach maximal suppression of autophagy in HeLa cells. The saturating dose of CQ is higher than 50 µM in HCT116 cells (data not shown) suggesting that saturating doses of CQ vary between cell types.
To further determine whether other lysosomal inhibitors would have similar effects on the GFP-LC3 cleavage, GFP-LC3 HeLa cells were treated with various concentrations of BAF or E64D plus pepstatin A. Similar to CQ, treatment with E64D plus pepstatin A significantly increased the number of GFP-LC3 puncta ( and D) as well as the level of free GFP fragments, endogenous LC3-II and p62 (). In contrast, we were unable to detect any significant amount of free GFP; only at prolonged exposure time was a very weak free GFP signal seen in BAF-treated cells. Yet, we observed a significant increase in GFP-LC3 puncta ( and D) as well as elevated levels of endogenous LC3-II and p62 after treatment with BAF (). No significant dose-dependent differences were seen in the levels of free GFP, endogenous LC3-II, or p62 after treatments with 12.5 nM to 150 nM BAF. Yet, the number of GFP-LC3 puncta increased in a dose-dependent manner in HeLa cells (). These data suggest that BAF is a more potent lysosomal inhibitor and its saturating dose required to fully suppress GFP-LC3 cleavage and degradation is much lower than that of CQ or E64D and pepstatin A. To further examine whether an unsaturating dose of BAF would also increase free GFP fragments as CQ does, we treated GFP-LC3 HeLa cells from as low as 0.025 nM to 25 nM. We found that 2.5 nM BAF also increased free GFP fragments while 25 nM BAF completely suppressed the appearance of free GFP fragments (). These data suggest that a saturating dose of lysosomal inhibitors is required to eliminate the free GFP production.
To further support our hypothesis that a low dose of CQ might not completely suppress lysosomal degradation, we performed a cathepsin B activity assay using a Magic RedTM cathepsin detection kit. The cell permeable cresyl violet labeled cathepsin B substrate is nonfluorescent until it is cleaved by cathepsins to generate cresyl violet fluorophores which yield red fluorescence. Therefore, the red fluorescence intensity reflects the cathepsin B activity. As seen in and H, nontreated HeLa cells displayed a strong red fluorescence whereas the red fluorescence almost completely disappeared at higher concentrations of CQ (50 µM) or BAF (50 nM). In contrast, only about 50% reduction of the fluorescence intensity was observed in cells treated with a low concentration of CQ (10 µM) ( and G). These data thus support the notion that the detection of free GFP fragments in unsaturating CQ-treated cells was due to a failure to fully suppress the lysosomal function and GFP-LC3 cleavage whereas saturating doses of CQ completely block GFP-LC3 cleavage, resulting in less or no free GFP fragments.
Effects of unsaturating and saturating doses of lysosomal inhibitors on mRFP-GFP-LC3 fluorescence analysis.
Because we observed that unsaturating doses of CQ could lead to the detection of free GFP that resulted from their cleavage from GFP-LC3, we hypothesized that autophagic degradation was not completely suppressed in these cells. To test this hypothesis we employed the tandem mRFP-GFP-LC3 fluorescence analysis.Citation27 In this assay, it is thought that RFP fluorescence is more stable in acidic compartments whereas GFP fluorescence is rapidly quenched. Accordingly, once autophagic flux is increased, both yellow (mRFP and GFP) and red (mRFP only) puncta are increased. Blocking the autophagosome fusion with the lysosome or suppressing lysosomal degradation (i.e., increase lysosomal pH) would only increase the number of yellow puncta. It is known that GFP has a relatively higher pKa value (pKa = 6.2) than mRFP (pKa = 4.8) suggesting that mRFP is resistant to lysosomal degradation.Citation27 When HeLa cells were transiently transfected with mRFP-GFP-LC3 we found that starvation increased both the number of yellow and red puncta ( and B) suggesting that starvation led to the increased quenching of GFP fluorescence or the degradation of the GFP moiety due to the increased autophagic flux. Because we were unable to detect the free GFP fragments under starvation conditions at various time points ( and G), we favor the notion that the GFP moiety is likely degraded rather than quenched. In contrast, treatment with BAF (either 50 or 100 nM) increased the number of yellow dots ( and B) with only ∼5% red dots (). These data suggest that BAF almost completely suppresses the degradation of GFP-LC3 at these concentrations. Unlike starvation and BAF, the effects of CQ treatment on mRFP-GFP-LC3 fluorescence seemed to depend more on dose. Although both unsaturating and saturating doses of CQ (10 and 50 µM) dramatically increased the number of yellow dots we found that there was still a portion of red dots occurring in the cells treated with the 10 µM unsaturating dose of CQ (∼30% red dots from the total LC3 dots) whereas this was significantly diminished in cells treated with the 50 µM saturating dose of CQ (∼8% of red dots from the total LC3 dots). These data further support the notion that unsaturating doses of CQ cannot efficiently block autophagic flux and the cleavage of GFP-LC3, which results in the generation of free GFP fragment and an increase in the number of red-LC3 dots. In contrast, saturating doses of CQ almost completely block the autophagic flux and the cleavage of GFP-LC3, resulting in less free GFP generation and fewer red-LC3 dots.
CQ-induced accumulation of free GFP is dependent on the classical autophagy machinery.
To test whether CQ-induced accumulation of free GFP requires autophagy machinery, we first infected wild-type and Atg5 knockout MEF cells with an adenovirus carrying GFP-LC3 for 24 hrs as described before.Citation28,Citation29 The cells were then cultured in complete medium or starved in EBSS in the absence or presence of CQ (10 µM) for 6 hrs. The number of GFP-LC3 puncta was increased by EBSS or CQ treatment and was further increased by the combination of EBSS and CQ in wild-type but not in Atg5 knockout cells ( and B). Consistent with the increase in GFP-LC3 puncta, CQ also suppressed EBSS-induced p62 degradation but further increased the endogenous LC3-II in wild type cells. In contrast, neither the formation of LC3-II nor the degradation of p62 was observed in Atg5 knockout cells. More importantly, there were no detectable free GFP fragments in CQ-treated Atg5 knockout cells (). These data clearly indicate that CQ-induced free GFP fragments rely on the canonical autophagy machinery.
EBSS and DMEM-AA-free starvation but not Rap leads to more acidic lysosomal compartments.
We observed that Rap, but not EBSS, increased free GFP fragments ( and F). Thus the degradative capacity of autolysosome was likely more potent during EBSS-induced starvation, leading to the rapid degradation of GFP. Because the acidity of lysosomes would affect their degradative capacity, we examined the lysosomal pH in HeLa cells after treatment with EBSS, Rap, CQ or EBSS plus CQ. Using the ratiometric pH sensor, LysoSensor Yellow/Blue DND-160, to measure lysosomal pH, we found that the lysosmal pH value was about 4.7 in normal cultured HeLa cells ( and B). Cells cultured in EBSS further decreased the lysosomal pH (pH = 4.3) whereas Rap treatment slightly increased pH (pH = 5.0). CQ treatment alone or the combination of CQ with EBSS dramatically increased lysosomal pH to values above the range of detection for this fluorophore (pH > 6.0). These data suggest that a more acidic lysosomal compartment caused by EBSS may contribute to the rapid degradation of free GFP fragments in the starved cells. To confirm whether there are no increased free GFP fragments in other amino acid free medium-induced starvation conditions in addition to EBSS, we cultured HeLa and MEF cells stably expressing GFP-LC3 in DMEM-AA-Free medium, HBSS with Hepes or HBSS alone in a CO2 free incubator to prevent the medium pH change during the culture. Consistent with the EBSS results, there were no increased free GFP fragments in cells cultured in either DMEM-AA-Free medium ( and Sup. Fig. 2), HBSS with Hepes or HBSS alone in a CO2 free incubator although there was an increase in the number of GFP-LC3 puncta in all these conditions ( and Sup. Fig. 1A and C). Similar to cells cultured with EBSS, cells cultured with DMEM-AA-Free or HBSS in a CO2 free incubator led to a decreased lysosomal pH ( and B and Sup. Fig. 1B). These data further support the notion that lysosomal pH is a critical factor regulating the stepwise GFP-LC3 cleavage to produce the free GFP fragments.
Because it is possible that the decreased lysosomal pH induced by EBSS, DMEM-AA-Free and HBSS alone in a CO2 free incubator could be due to decreased medium pH during our culture, we determined the medium pH changes in all our experimental conditions. We found that the pH value of EBSS was quite similar to DMEM and was actually slightly alkali (pH 7.5–8) rather than acidic when the culture was conducted in the presence of 5% CO2 in the first 6 hours (). Addition of Hepes did not alter the pH value much. In contrast, the pH value of HBSS quickly dropped in the presence of 5% CO2 because the lower concentration of NaHCO3 present in HBSS reduces its buffering capacity dramatically allowing the culture to become acidic in the presence of CO2. However, the pH value of HBSS changed slightly to alkali in the absence of CO2 although the cellular lysosomal pH was further decreased ( and Sup. Fig. 1B). These results indicate that the more acidic lysosomal pH in cells cultured with EBSS, DMEM-AA-Free or HBSS-CO2 free is likely the result of the amino acids starvation not the acidity of the medium.
Modulation of GFP-LC3 cleavage using saturating and unsaturating lysosomal inhibitors.
Since we observed that saturating and unsaturating concentrations of CQ led to different levels of free GFP fragments, we next asked what would occur if we used both saturating and unsaturating concentrations of CQ in the presence of an autophagy inducer. As seen in , CQ at an unsaturating concentration (10 µM) further increased the level of free GFP fragments in Rap-treated cells compare to cells treated with either CQ or Rap alone. This suggests that CQ at this concentration inhibited the GFP degradation. Similar changes were observed for the endogenous LC3-II, supporting an induction of autophagic flux by Rap. However, in the presence of a saturating concentration of CQ (50 µM) or BAF (50 nM), Rap-induced free GFP fragments were decreased or almost completely inhibited although Rap-induced LC3-II levels were further increased. The decreased level of free GFP fragments under these concentrations was likely due to the blockage of the GFP-LC3 cleavage and thus led to less free GFP generation (). Similar to Rap-treated cells, CQ at an unsaturating concentration (10 µM) increased free GFP fragments and at a saturating concentration (50 µM) also almost completely eliminated the free GFP fragments in EBSS () or DMEM-AA-Free () starved cells. However, in the presence of an unsaturated concentration of CQ, there was a decrease of free GFP fragments in cells also starved with EBSS or DMEM-AA-Free in comparison to CQ treatment alone ( and C). This was likely due to damage of the lysosomal compartments which led to less GFP-LC3 cleavage. Damage was seen as lysosomal swelling which occurred when cells were treated with a combination of EBSS + CQ (data not shown). These data suggest that the level of GFP fragments vary depending upon the capacity of the lysosomal degradation, which is influenced by its pH value. It would thus be advisable that a combination of saturating and unsaturating concentrations of lysosomal inhibitors be used for an accurate assessment of autophagic degradation of GFP-LC3.
Discussion
It has been suggested that the detection of free GFP fragments can be used to measure autophagic flux because GFP is more stable than the GFP-LC3 fusion protein in the acidic lysosomal compartment.Citation14 We have previously shown that free GFP fragments were increased during calcium phosphate-induced autophagy in a GFP-LC3 stably expressing 293 cell line.Citation30 Moreover, free GFP fragments also increased under starvation conditions in Atg5 tet-off MEF cells.Citation20 In this study we found that Rap, another classical autophagy inducer, also increased the level of free GFP fragments. Interestingly, in several GFP-LC3 stable cell lines starved in amino acids free mediums (EBSS, DMEMAA-Free, HBSS with Hepes and HBSS-CO2 free), there were no increased free GFP fragments detected. Moreover, incomplete suppression of autophagy using low unsaturating doses of CQ or BAF also led to an increased generation of free GFP fragments from GFP-LC3. Overall, our data suggest that lysosomal acidity is an important regulating factor for the step-wise degradation of GFP-LC3, in which the free GFP fragments are first generated but accumulate only when the lysosomal acidity is moderate, but are further degraded when the lysosomal acidity is high. The intermediate stage of the GFP-LC3 degradation, i.e., the accumulation of free GFP moieties, could thus represent either a positive flux, or suggest a certain level of lysosomal inhibition (such as a moderate increase in lysosomal pH). Based on these findings, we would recommend that when analyzing autophagic flux based on GFP-LC3 degradation one should compare the accumulation of free GFP and GFP-LC3-II in the absence and presence of a lysosomal inhibitor at both the unsaturating and saturating concentrations.
E64d, pepstatin A and CQ are widely used autophagy inhibitors which function by suppressing lysosomal proteases or by increasing lysosomal pH. The observation that CQ or E64d plus pepstatin A increased free GFP fragments was surprising. The level of free GFP fragments was thought to reflect the autophagic flux. However, if the generation of GFP fragments from GFP-LC3 was due to the degradation of GFP-LC3 fusion protein in the autolysosomes, why did suppression of lysosomal degradation by CQ or E64d plus pepstatin A increase the free GFP fragments? One possibility is that under certain conditions (unsaturating concentrations) some lysosomal inhibitors may not completely suppress lysosomal degradation (or cleavage) of GFP-LC3. This notion was supported by our observation that CQ (10 µM) could only partially suppress cathepsin B activity (). In this case GFP-LC3 is still cleaved resulting in the appearance of free GFP fragments.
Another note of interest is that the data from this study suggest that the level of free GFP fragments is dependent on the acidity and degradative capacity of the lysosomal compartments. It seems that the degradation of free GFP relies on a more acidic environment than LC3. It should also be noted that most of our data are from HeLa and MEF cells, and it is possible that the lysosomal acidity and degradative capacity could be different among different cell lines. Hosokwa et al.Citation20 have shown that free GFP fragments increased in a tet-off Atg5-/- MEF cell line when cultured in DMEM-AA-Free for 2 hrs. However, it is not known whether the selected clone of this stable cell line or tetracycline treatment would have already altered the lysosomal pH in these MEF cells. Nevertheless, our data indeed support that lysosomal acidity is a key factor in the regulation of GFP-LC3 cleavage to produce the free GFP fragments. The lower lysosomal pH promotes a rapid degradation of free GFP fragments while higher lysosomal pH has a slow degradation of free GFP fragments resulting in the appearance and retention of these fragments.
The rapid vs. slow degradation hypothesis also seems consistent with our data using the tandem mRFP-GFP-LC3 which shows a significantly high number of red LC3 dots (rapid mode) in starved cells, but only a low number of red LC3 dots in unsaturating CQ treated cells (slow mode). Although it has been suggested that the rapid disappearance of GFP-LC3 signals could be due to the quenching of the GFP fluorescence by the acidic pH environment inside the lysosome,Citation27 our data support that degradation of GFP-LC3 is the cause of disappearance based on the following observations. First, we failed to detect the free GFP fragments by immunoblotting analysis in the starved cells while these cells had an increased number of red LC3 dots. Also, suppression of lysosomal degradation by unsaturating doses of CQ or BAF increased the free GFP fragments. Therefore, the GFP fragments were likely degraded in the lysosomes. This conclusion is further supported by the data showing that the generation of free GFP fragments was almost completely blocked by the saturating doses of CQ or BAF with almost all the mRFP and GFP signals co-localized in mRFP-GFP-LC3 positive cells. The disappearance of free GFP fragments is due to the suppression of upstream GFP-LC3 cleavage when the saturating concentrations of these inhibitors are used. The saturating concentrations of the lysosomal inhibitors vary in different cell types or at different time points in the same cells depending on the activity and acidity of the lysosomes. Based on our data from HeLa cells, it appears that BAF is a more potent autophagy inhibitor than CQ. BAF showed no significant difference on autophagy inhibition from a range of 12.5 to 150 nM, while it seems CQ would require more than 50 µM to reach such a saturating level.
Currently there are very limited methods to determine autophagic flux in vivo. Similar to the in vitro findings, CQ treatment also increased the free GFP fragments in GFP-LC3 mouse liver in either starved or fed mice. Interestingly, we were unable to detect free GFP fragments in starved mouse liver without CQ (). It remains to be determined whether the lysosomal pH would also be decreased in starved mouse hepatocytes similar to the cells cultured in EBSS. It would be interesting to determine the saturating dose of CQ in vivo in the future. We recently reported that acute ethanol treatment induced autophagy both in vitro and in vivo in mouse liver. We also detected increased free GFP fragments in ethanol-treated mouse liver.Citation31 All the evidence support that GFP-LC3 cleavage indeed occurs in the mouse liver, although it seems that more work is needed to further characterize this assay in vivo.
The GFP-LC3 cleavage assay has been used in yeast to monitor autophagic flux. Either starvation or Rap increased free GFP fragments from GFP-Atg8 cleavage which was suppressed in several essential Atg mutants.Citation6,Citation25 However, it should be noted that the pH of the yeast vacuole (which is equivalent to the mammalian lysosome) is approximately 6.2 which is higher than the 4.7 of mammalian lysosomes.Citation32,Citation33 Since CQ can increase the pH in the mammalian cell lysosome, the lysosomes in CQ treated-cells are analogous to the yeast vacuole. This may partially explain why GFP-Atg8/LC3 cleavage is more reliable in yeast and why free GFP fragments can be readily detected in cells treated with an unsaturating dose of CQ.
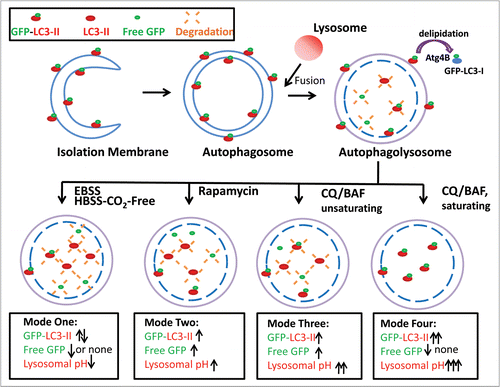
Based on our findings from this study, we propose four different possible modes of GFP-LC3 degradation. When cells are starved with EBSS or HBSS-CO2-Free, the number of autophagosomes and autolysosomes significantly increase. The fusion of autophagosomes with lysosomes then leads to either increased or decreased levels of LC3-II depending on the specific time point. However, no free GFP fragments are detectable. This rapid degradation of GFP is likely due to the more acidic lysosomal environment induced by EBSS or HBSS-CO2-Free (Mode 1, ). The rapid disappearance of the GFP signal during starvation-induced autophagy has also been noticed by Kimura et al.Citation27 Cells treated with Rap increase the level of LC3-II proteins as well as free GFP fragments. We found that Rap did not decrease the lysosomal pH (). This accounts for the slow degradation of LC3-II as well as the free GFP fragments (Mode 2, ). When cells are cultured in EBSS in the presence of unsaturating concentrations of CQ or treated with unsaturating concentrations of CQ or BAF alone in regular full culture medium, both the levels of LC3-II and free GFP fragments increase due to decreased lysosomal degradation without affecting the fusion of autophagosomes with lysosomes (Mode 3, and data not shown). Therefore, the production of free GFP fragments is likely due to insufficient blocking of GFP-LC3 cleavage. In contrast, CQ or BAF at a saturating concentration can completely block GFP-LC3 cleavage either in EBSS or regular full culture medium condition thus leading to increased LC3-II levels without the generation of free GFP fragments (Mode 4, ).
In summary, we found that GFP-LC3 is degraded in a stepwise fashion in which LC3 is degraded faster than GFP. The lysosomal acidity is an important regulating factor for the step-wise degradation of GFP-LC3, in which the free GFP fragments are accumulated only when the lysosomal acidity is moderate but are further degraded when the lysosomal acidity is high. The level of free GFP fragments varies depending on the stimuli, degradative capacity and acidity of the lysosomes. In order to fully understand the nature of free GFP generation, it is best to use lysosomal inhibitors at both unsaturating and saturating concentrations, which will render the assay more useful for autophagic flux analysis.
Materials and Methods
Cell culture.
MEF, HCT116 and HeLa cells stably expressing GFP-LC3 were established as described before.Citation28,Citation29 Atg5-/- MEFs were generously donated by Dr. N. Mizushima (Tokyo Medical and Dental University, Japan). MEF and HeLa cells were maintained in DMEM with 10% fetal bovine serum (GIBCO) supplemented with L-glutamine, and penicillin/streptomycin. Stable GFP-LC3 HCT116 Bax-deficient cells were maintained in McCoy's 5A with the routine supplements.Citation34 For starvation, cells were first washed with PBS three times and incubated in EBSS (Hyclone, SH30029), HBSS (Invitrogen, 14025-092) with 10 mM Hepes or DMEM-AA-Free medium.Citation20 All other cell culture materials were obtained from Invitrogen and all chemicals were obtained from Sigma-Aldrich.
Animal experiments.
GFP-LC3 transgenic mice were used in this study. All animals received humane care. All procedures were approved by the Institutional Animal Care and Use Committee of the University of Pittsburgh and The University of Kansas Medical Center. Mice were treated in two sets of experiments. In the first set, after 6 hrs of fasting, GFP-LC3 mice were either given saline (n = 3, i.p.) or CQ (60 mg/kg) (n = 4, i.p.). After the injection, the mice were free to access the food chow. All the mice were sacrificed 16 hrs later. In the second set, mice were either starved or fed for 24 hrs with or without an injection of CQ (60 mg/kg) 6 hrs before they were sacrificed. Total liver lysates were prepared using RIPA buffer (1% NP40, 0.5% sodium deoxycholate, 0.1% sodium dodecyl (lauryl) sulfate). Cryosection of GFP-LC3 transgenic livers were performed as previously described in reference Citation35.
Antibodies.
Antibodies used in the study were mouse anti-GFP (Santa Cruz Biotechnology, sc-9996), p62 (Abnova, H00008878-M01), β-actin (Sigma, a5541), GAPDH (Cell Signalling, 2118) and rabbit anti-Atg5 antibody (MBL, PM050). The rabbit polyclonal anti-LC3B antibody was made using a peptide representing the NH2-terminal 14 amino acids of human LC3B and an additional cysteine (PSE KTF KQR RTF EQC) as described before in reference 36. The secondary antibodies used in this study were HRP-conjugated goat anti-mouse (JacksonImmunoResearch, 115-035-062) or rabbit antibodies (JacksonImmunoResearch, 111-035-045).
Plasmids and fluorescence microscopy.
Cultured cells seeded in 12 well-plates with microscope cover glasses (Thermo Fisher Scientific) were transfected with mRFP-GFP-LC3 (a gift from Dr. T. Yoshimori from Osaka University, Osaka, Japan)Citation27 using Lipofectamine 2000 (Invitrogen) for 24 hrs. After designated treatments, cells were fixed with 4% paraformaldehyde (PFA) in PBS. All the cellular images were obtained using an inverted confocal microscope (Nikon) or a Nikon Eclipse 200 fluorescence microscope. For quantification of autophagic cells, GFP-LC3 and mRFP-LC3 punctated dots were determined from triplicates by counting a total of more than 30 cells.
Lysosomal pH assay.
Hela cells were cultured on 20 mm cover slips. After the designated treatments, LysoSensor Yellow/Blue DND-160 was added to yield a final concentration of 5 µM and the cells were incubated for 45 min at 37°C. The cells were then washed twice in HEPES solution (10 mM HEPES, 133.5 mM NaCl, 2.0 mM CaCl2, 4.0 mM KCl, 1.2 mM MgSO4, 1.2 mM NaH2PO4, 11 mM glucose; pH 7.4) and immediately imaged. Imaging was performed using a Nikon eclipse Ti PFS Quantitative Fluorescence Live-Cell and Multidimensional Imaging System equipped with a digital monochrome Coolsnap HQCitation2 camera (Roper Scientific, Tucson, AZ). Fluorescence images were collected using Metafluor software (Universal Imaging, Downingtown, PA). Data were recorded at excitation/emission wavelengths of 340/440 nm and 380/510 nm using a 410 nm dichroic. For each cell, a region of interest was delineated that encompassed the cytosolic space of the cell and excluded the nucleus. Ratio was calculated for each cell as R = (F1 − B1)/(F2 − B2) where F1 and F2 are the fluorescence intensities at 380/525 and 340/440 respectively and B1 and B2 are the corresponding background values determined from a region on the same images that was near the cell but did not contain a cell. Calibration of the relationship between R values and pH was performed using a free solution titration of LysoSensor DND-160 in a cell-free system on the microscope stage.
Cathepsin B activity assay.
HeLa cells were cultured in 10 mm microwells with glass cover slip bottoms. After designated treatments, cells were further loaded with Magic Red™ Cathepsin B reagent (Immunochemistry Technologies, LLC) for 1 hr and the cell nuclei were stained with Hoechst 33342 after which time, the cells were immediately imaged using a Nikon eclipse Ti PFS Quantitative Fluorescence Live-Cell and Multidimensional Imaging System. Fluorescence images were collected using Metafluor software. Data were recorded at excitation 560 nm and emission 607 nm. Single cell fluorescence intensity was quantified using Image J software (National Institutes of Health) in a total of more than 80 cells from three independent experiments.
Immunoblot assay.
Cells were washed in PBS and lysed in RIPA buffer. Twenty micrograms of protein was separated by SDS-PAGE and transferred to PVDF membranes. The membranes were stained with primary antibodies followed by secondary horseradish peroxidase-conjugated antibodies. The membranes were further developed with SuperSignal West Pico chemiluminescent substrate (Pierce).
Abbreviations
| BAF | = | bafilomycin A1 |
| CQ | = | chloroquine |
| DMEM-AA-Free | = | DMEM-amino acids-free |
| EBSS | = | Earle's balanced salt solution |
| HBSS | = | Hank's balanced salt solution |
| LC3 | = | microtubule-associated protein 1 light chain 3 |
| MEF | = | mouse embryonic fibroblasts |
| PFA | = | paraformaldehyde |
| PE | = | phosphatidylethanolamine |
Figures and Tables
Figure 1 Rap but not EBSS increases free GFP fragments from GFP-LC3. (A) Stable GFP-LC3 HeLa cells were treated with 0.25 Rap for 6 hrs. Live cell images were obtained by using a Nikon Eclipse 200 fluorescence microscope. A representative image from three independent experiments is shown. (B) GFP-LC3 HeLa cells were treated with the indicated concentrations of Rap for 6 hrs and the average number of GFP-LC3 dots per cell was quantified. Data (mean ± SD) are representative of at least three independent experiments. (C and D) GFP-LC3 HeLa cells were treated with increasing concentrations of Rap, as indicated, for 6 hrs (C) or with 10 uM Rap for the indicated time points (D). Total lysates were prepared and subjected to immunoblot analysis. (E) Stable GFP-LC3 HeLa cells were cultured in DMEM or in EBSS buffer for 6 hrs. Images were taken using a Nikon Eclipse 200 fluorescence microscope and representative images are shown. The number of GFP-LC3 dots per cell in each condition was quantified. Data (mean ± SD) are representative of at least three independent experiments. Stable GFP-LC3 HeLa (F) and MEF cells (G) were cultured in EBSS buffer for the designated time points. CQ (10 µM) was used to treat cells in culture medium for 24 hrs. Total lysates were prepared and subjected to immunoblot analysis.
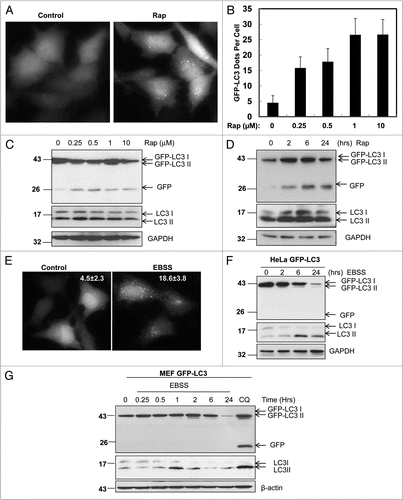
Figure 2A–D CQ increases free GFP fragment in various GFP-LC3 stable cell lines and GFP-LC3 transgenic mouse liver. (A) Stable GFP-LC3 HeLa cells were cultured in DMEM without or with CQ (10 µm), or in EBSS buffer in the absence or presence of CQ for 6 hrs. Images were taken using a Nikon Eclipse 200 fluorescence microscope and the number of GFP-LC3 dots per cell was quantified. Data (mean ± SD) are representative of at least three independent experiments. (B) Stable GFP-HeLa cells were treated as in (A) after which time total lysates were prepared and subjected to immunoblot analysis. (C) Stable GFP-LC3 HC T116, HepG2 and HeLa cells were treated with CQ (10 µM) for various time points (0, 2, 6 and 24 hrs). Total lysates were prepared and subjected to immunoblot analysis. (D) Stable GFP-LC3 HC T116 and HepG2 cells were treated with CQ (10 µM) for 6 hrs. Cells were fixed with 4% PFA followed by fluorescence microscopy. The number of GFP-LC3 dots per cell was quantified. Data (mean ± SD) are representative of at least three independent experiments.
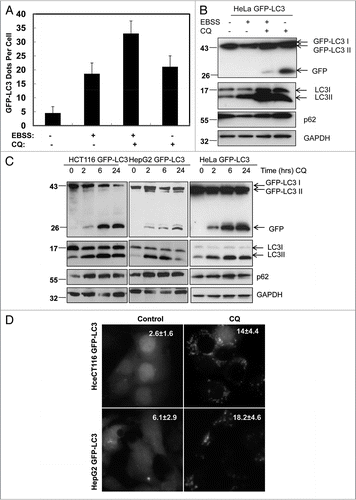
Figure 2E–G CQ increases free GFP fragment in various GFP-LC3 stable cell lines and GFP-LC3 transgenic mouse liver. (E) GFP-LC3 mice were starved for 6 hrs then treated with saline or CQ (60 mg/kg, i.p.) for another 16 hrs with free access to the food chow. Cryosections of GFP-LC3 transgenic livers were performed followed by confocal microscopy. Representative images are shown. a: saline, b: CQ and c: magnified image from the boxed area in b. The number of GFP-LC3 dots per cell in each condition was quantified. Data (mean ± SE ) are representative of 3 control mice and 4 CQ-treated mice from a total of more than 110 different cells. (F) After treatment with CQ as in (E), total liver lysates were prepared and subjected to immunoblot analysis. (G) GFP-LC3 mice were either starved or fed for 24 hrs with or without an injection of CQ (60 mg/kg) at the last 6 hrs before they were sacrificed. Total liver lysates were prepared and subjected to immunoblot analysis.
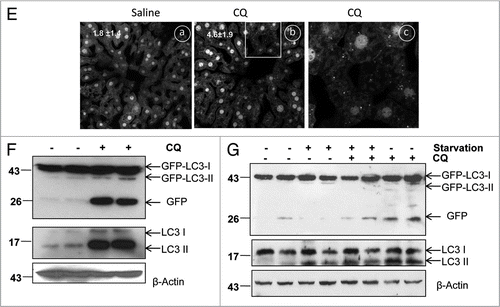
Figure 3A–E Differential role of unsaturating and saturating concentrations of lysosomal inhibitors on GFP-LC3 cleavage. (A) Stable GFP-LC3 HeLa cells were treated with various concentrations of CQ as indicated for 6 hrs. Total lysates were prepared and subjected to immunoblot analysis. (B) Stable GFP-LC3 HeLa cells were treated as in (A), fluorescence images were taken using a Nikon Eclipse 200 fluorescence microscope and the number of GFP-LC3 dots per cell was quantified. Data (mean ± SD) are representative of at least three independent experiments. (C) Stable GFP-LC3 HeLa cells were treated with various concentrations of BAF as indicated or E64D (10 µM) plus pepstatin (10 µM) for 6 hrs. Fluorescence images were taken using a Nikon Eclipse 200 fluorescence microscope and representative images are shown. The number of GFP-LC3 dots per cell was quantified. (D) Data (mean ± SD) are representative of at least three independent experiments. (E) Cells were treated as in (D) and total lysates were prepared and subjected to immunoblot analysis.
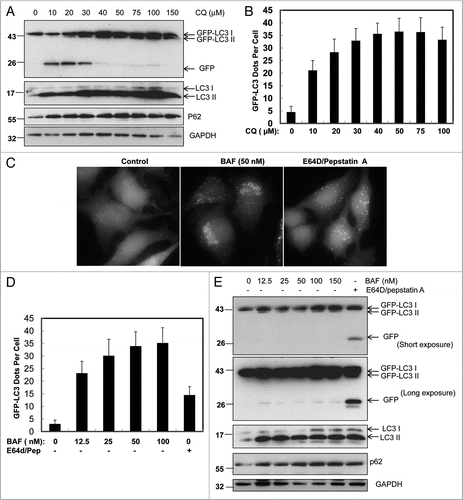
Figure 3F–H Differential role of unsaturating and saturating concentrations of lysosomal inhibitors on GFP-LC3 cleavage. (F) Stable GFP-LC3 HeLa cells were treated with various concentrations of BAF as indicated or CQ (10 µm) for 6 hrs and total lysates were prepared and subjected to immunoblot analysis. (G) HeLa cells were treated with CQ (10 and 50 µM) or BAF (50 nM) for 6 hrs. Cells were then loaded with Magic Red™ Cathepsin B reagent and immediately imaged. Representative images are shown. (H) Cells were treated as in (F) and the fluorescence intensity of each cell was quantified. Data (mean ± SD) are from at least 80 different cells of three independent experiments.
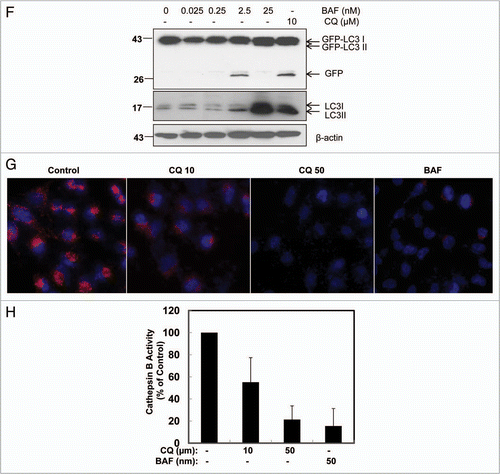
Figure 4 Differential role of unsaturating and saturating concentrations of lysosomal inhibitors on mRFP-GFP-LC3 analysis. (A) HeLa cells were transfected with the tandem mRFP-GFP-LC3 plasmids. Twenty-four hrs after the transfection the cells were either starved in EBSS buffer or treated with CQ (10 and 50 µM) or BAF (50 and 100 nM) for 6 hrs. Cells were then fixed with 4% PFA followed by confocal micrsocopy. The right parts are enlarged from the boxed areas in the left parts. Closed arrows denote yellow LC3 dots and open arrows denote red LC3 dots. (B) Cells were treated as in (A) or treated with E64D (10 µM) plus pepstatin A (10 µM) for 6 hrs and the number of yellow LC3 dots and red LC3 dots per cell in each condition was quantified. Total LC3 dots are the addition of the number of yellow LC3 dots with red LC3 dots. (C) Percentage of the red LC3 dots from the total LC3 dots from (B). More than 30 cells were counted in each condition and data (mean ± SD) are representative of two independent experiments.
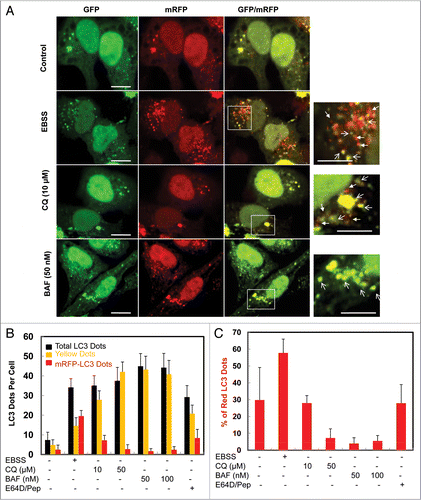
Figure 5 CQ induced free GFP fragments requires classical autophagy machinery. (A) Wild-type and Atg5-/- MEF cells were infected with adenovirus GFP-LC3 (100 viral particle per cell) for 24 hrs. The cells were then cultured in regular culture medium (control) with or without CQ (10 µM), or subjected to starvation in EBSS buffer in the absence or presence of CQ for 6 hrs. Live cell images were obtained using a Nikon Eclipse 200 fluorescence microscope. (B) Cells were treated as in (A) and the number of GFP-LC3 dots per cell was quantified. Data (mean ± SD) are representative of at least three independent experiments. (C) Cells were treated as in (A) and total lysates were prepared and subjected to immunoblot analysis.
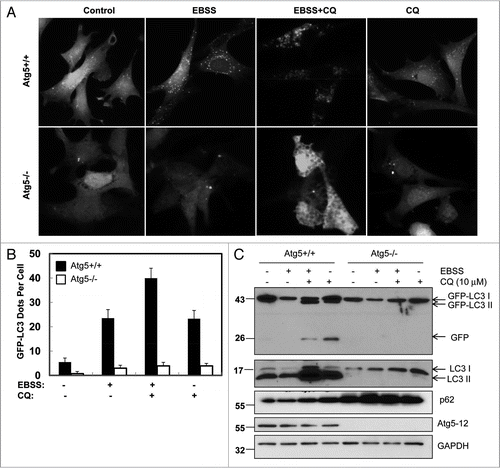
Figure 6 Differential effects of Rap and EBSS on lysosomal pH. (A) HeLa cells were cultured in control medium, EBSS , DMEMAA-Free or treated with culture medium + Rap (1 µM) or culture medium + CQ (10 µM) and EBSS + CQ (10 µM) for 6 hrs. The cells were then loaded with 5 uM LysoSensor Yellow/Blue DND-160 for 45 min and immediately imaged. Representative images from at least two experiments are shown. (B) Average pH change as in (A). Data (mean ± SD) are representative of at least 100 cells. (C) Stable GFP-LC3 HeLa cells were cultured in DMEM-AA-Free for 6 hrs. Live cell images were obtained using a Nikon Eclipse 200 fluorescence microscope. The number of GFP-LC3 dots per cell was quantified. Data (mean ± SD) are representative of at least three independent experiments. (D) Cells were cultured in DMEM-AA-Free for different time points or in the presence or absence of CQ for 6 hrs and total lysates were subjected to immunoblot analysis. Cells treated with CQ (10 µM) in culture medium for 6 hrs were used as a positive control for free GFP fragments. (E) GFP-LC3 HeLa cells were incubated with regular DMEM, EBSS , EBSS with 10 mm Hepes, HBSS , HBSS with 10 mm Hepes or HBSS in a CO2 free incubator for various time points. The medium pH values were measured using a pH meter and data (mean ± SD) are representative of three independent experiments.
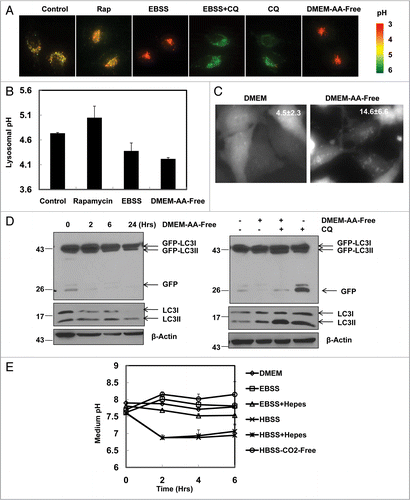
Figure 7 Modulation of GFP-LC3 cleavage using saturating and unsaturating lysosomal inhibitors. (A) GFP-LC3 stable HeLa cells were treated with Rap (1 µM) in the presence or absence of CQ (10 or 50 µM) or BAF (50 nM) for 6 hrs. Total lysates were prepared and subjected to immunoblot analysis. GFPLC3 stable HeLa cells were cultured in EBSS buffer (B) or in DMEM-AA-Free (C) in the presence or absence of CQ (10 or 50 µM) for 6 hrs. Total lysates were prepared and subjected to immunoblot analysis. Data is representative of two independent experiments.
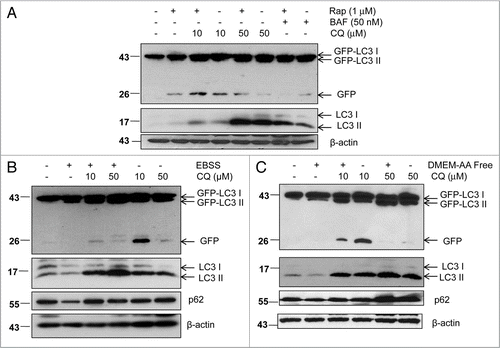
Figure 8 Schematic diagram of the different modes of GFP-LC3 cleavage within autolysosome. Autophagy is a dynamic process. It starts from a small crescent-shaped isolation membrane, which elongates and closes to form a double-membrane autophagosome. Autophagosomes fuse with lysosomes to form mature autolysosomes, where engulfed contents including proteins and damaged organelles are degraded. During this process, LC3 is conjugated with PE at its C terminus and recruited to both the outer and inner membrane of the autophagosome. After fusion with lysosomes, the inner membrane LC3-PE is degraded by the lysosomal enzymes whereas the outer membrane LC3-PE is de-lipidated by Atg4. It is believed that GFP-LC3 may follow the same route as the endogenous LC3. However, GFP is more resistant to lysosomal degradation than LC3 and thus the free GFP fragments generated from GFP-LC3 cleavage can serve as a marker for autophagic flux. The amount of free GFP fragments can be summarized by four different modes. In mode one (rapid), few or no free GFP fragments are detected whereas the levels of endogenous LC3-II and GFP-LC3-II may fluctuate depending on the time frame of the assay. This scenario may occur during EBSS or HBSS-CO2 free-induced starvation accompanied by a decrease in lysosomal pH. In mode two (slow), levels of free GFP fragments increase as do the levels of endogenous LC3-II and GFP-LC3-II. This scenario may occur by some autophagy inducers which do not affect or only slightly increase lysosomal pH such as rapamycin or cells cultured in EBSS CO2 free conditions. In mode three (slow), the levels of free GFP fragments, as well as the levels of endogenous LC3-II and GFP-LC3-II all increase. This scenario may occur for cells or animals treated with unsaturating concentrations of lysosomal inhibitors which increase lysosomal pH either in the presence or absence of starvation. In mode four (no degradation), no free GFP fragments are detected whereas the levels of endogenous LC3-II and GFP-LC3-II are increased. This scenario may occur when cells are treated with saturating concentrations of lysosomal inhibitors which dramatically increase lysosomal pH in the presence or absence of autophagy inducers.
Additional material
Download Zip (9.4 MB)Acknowledgements
We thank Dr. Mizushima (Tokyo Medical and Dental University, Japan) and Dr. Yoshimori (Research Institute for Microbial Disease; Osaka University, Japan) for providing reagents. This study was supported in part by the NIH funds R21 AA017421& P20 RR021940 & P20 RR016475 from the INBRE program of the National Center for Research Resources (W.X.D.). X.M.Y. was supported by NIH funds CA83817 and CA111456. A.L.W. was supported by NIEH funds T32-07254. S.W. was supported by NIAAA AA012863.
References
- Levine B, Klionsky DJ. Development by self-digestion: molecular mechanisms and biological functions of autophagy. Dev Cell 2004; 6:463 - 477
- Lum JJ, DeBerardinis RJ, Thompson CB. Autophagy in metazoans: cell survival in the land of plenty. Nat Rev Mol Cell Biol 2005; 6:439 - 448
- Kamada Y, Sekito T, Ohsumi Y. Autophagy in yeast: a TOR-mediated response to nutrient starvation. Curr Top Microbiol Immunol 2004; 279:73 - 84
- Kirkegaard K, Taylor MP, Jackson WT. Cellular autophagy: surrender, avoidance and subversion by microorganisms. Nat Rev Microbiol 2004; 2:301 - 314
- Singh R, Kaushik S, Wang Y, Xiang Y, Novak I, Komatsu M, et al. Autophagy regulates lipid metabolism. Nature 2009; 458:1131 - 1135
- Kanki T, Wang K, Cao Y, Baba M, Klionsky DJ. Atg32 is a mitochondrial protein that confers selectivity during mitophagy. Dev Cell 2009; 17:98 - 109
- Okamoto K, Kondo-Okamoto N, Ohsumi Y. Mitochondria-anchored receptor Atg32 mediates degradation of mitochondria via selective autophagy. Dev Cell 2009; 17:87 - 97
- Mizushima N, Levine B, Cuervo AM, Klionsky DJ. Autophagy fights disease through cellular self-digestion. Nature 2008; 451:1069 - 1075
- Levine B, Kroemer G. Autophagy in the pathogenesis of disease. Cell 2008; 132:27 - 42
- Suzuki K, Ohsumi Y. Current knowledge of the preautophagosomal structure (PAS). FEBS Lett 584:1280 - 1286
- Nakatogawa H, Ichimura Y, Ohsumi Y. Atg8, a ubiquitin-like protein required for autophagosome formation, mediates membrane tethering and hemifusion. Cell 2007; 130:165 - 178
- Kabeya Y, Mizushima N, Ueno T, Yamamoto A, Kirisako T, Noda T, et al. LC3, a mammalian homologue of yeast Apg8p, is localized in autophagosome membranes after processing. EMBO J 2000; 19:5720 - 5728
- Ohsumi Y,. Molecular dissection of autophagy: two ubiquitin-like systems. Nat Rev Mol Cell Biol 2001; 2:211 - 216
- Mizushima N, Yoshimori T, Levine B. Methods in mammalian autophagy research. Cell 140:313 - 326
- Rubinsztein DC, Cuervo AM, Ravikumar B, Sarkar S, Korolchuk V, Kaushik S, Klionsky DJ. In search of an “autophagomometer”. Autophagy 2009; 5:585 - 589
- Klionsky DJ, Abeliovich H, Agostinis P, Agrawal DK, Aliev G, Askew DS, et al. Guidelines for the use and interpretation of assays for monitoring autophagy in higher eukaryotes. Autophagy 2008; 4:151 - 175
- Galluzzi L, Aaronson SA, Abrams J, Alnemri ES, Andrews DW, Baehrecke EH, et al. Guidelines for the use and interpretation of assays for monitoring cell death in higher eukaryotes. Cell Death Differ 2009; 16:1093 - 1107
- Bjorkoy G, Lamark T, Brech A, Outzen H, Perander M, Overvatn A, et al. p62/SQSTM1 forms protein aggregates degraded by autophagy and has a protective effect on huntingtin-induced cell death. J Cell Biol 2005; 171:603 - 614
- Kirkin V, Lamark T, Sou YS, Bjorkoy G, Nunn JL, Bruun JA, et al. A role for NBR1 in autophagosomal degradation of ubiquitinated substrates. Mol Cell 2009; 33:505 - 516
- Hosokawa N, Hara Y, Mizushima N. Generation of cell lines with tetracycline-regulated autophagy and a role for autophagy in controlling cell size. FEBS Lett 2006; 580:2623 - 2629
- Shintani T, Klionsky DJ. Autophagy in health and disease: a double-edged sword. Science 2004; 306:990 - 995
- Poole B, Ohkuma S. Effect of weak bases on the intralysosomal pH in mouse peritoneal macrophages. J Cell Biol 1981; 90:665 - 669
- Amaravadi RK, Yu D, Lum JJ, Bui T, Christophorou MA, Evan GI, et al. Autophagy inhibition enhances therapy-induced apoptosis in a Myc-induced model of lymphoma. J Clin Invest 2007; 117:326 - 336
- Klionsky DJ, Elazar Z, Seglen PO, Rubinsztein DC. Does bafilomycin A1 block the fusion of autophagosomes with lysosomes?. Autophagy 2008; 4:849 - 950
- Shintani T, Klionsky DJ. Cargo proteins facilitate the formation of transport vesicles in the cytoplasm to vacuole targeting pathway. J Biol Chem 2004; 279:29889 - 29894
- Blommaart EF, Luiken JJ, Blommaart PJ, van Woerkom GM, Meijer AJ. Phosphorylation of ribosomal protein S6 is inhibitory for autophagy in isolated rat hepatocytes. J Biol Chem 1995; 270:2320 - 2326
- Kimura S, Noda T, Yoshimori T. Dissection of the autophagosome maturation process by a novel reporter protein, tandem fluorescent-tagged LC3. Autophagy 2007; 3:452 - 460
- Ding WX, Ni HM, Gao W, Yoshimori T, Stolz DB, Ron D, Yin XM. Linking of autophagy to ubiquitinproteasome system is important for the regulation of endoplasmic reticulum stress and cell viability. Am J Pathol 2007; 171:513 - 524
- Ding WX, Ni HM, Gao W, Hou YF, Melan MA, Chen X, et al. Differential effects of endoplasmic reticulum stress-induced autophagy on cell survival. J Biol Chem 2007; 282:4702 - 4710
- Gao W, Ding WX, Stolz DB, Yin XM. Induction of macroautophagy by exogenously introduced calcium. Autophagy 2008; 4:754 - 761
- Ding WX, Li M, Chen X, Ni HM, Lin CW, Gao W, et al. Autophagy reduces acute ethanol-induced hepatotoxicity and steatosis in mice. Gastroenterology 2010; 139:1740 - 1752
- Yoshimori T, Yamamoto A, Moriyama Y, Futai M, Tashiro Y. Bafilomycin A1, a specific inhibitor of vacuolar-type H(+)-ATPase, inhibits acidification and protein degradation in lysosomes of cultured cells. J Biol Chem 1991; 266:17707 - 17712
- Ohkuma S, Poole B. Fluorescence probe measurement of the intralysosomal pH in living cells and the perturbation of pH by various agents. Proc Natl Acad Sci USA 1978; 75:3327 - 3331
- Zhang L, Yu J, Park BH, Kinzler KW, Vogelstein B. Role of BAX in the apoptotic response to anticancer agents. Science 2000; 290:989 - 992
- Mizushima N, Yamamoto A, Matsui M, Yoshimori T, Ohsumi Y. In vivo analysis of autophagy in response to nutrient starvation using transgenic mice expressing a fluorescent autophagosome marker. Mol Biol Cell 2004; 15:1101 - 1111
- Ding WX, Ni HM, Gao W, Chen X, Kang JH, Stolz DB, et al. Oncogenic transformation confers a selective susceptibility to the combined suppression of the proteasome and autophagy. Mol Cancer Ther 2009; 8:2036 - 2045