 ?Mathematical formulae have been encoded as MathML and are displayed in this HTML version using MathJax in order to improve their display. Uncheck the box to turn MathJax off. This feature requires Javascript. Click on a formula to zoom.
Abstract
Unsuccessful cytotoxic anticancer treatments may contribute to tumor morphologic instability and consequent tissue invasion, promoting the selection of a more malignant phenotype. Indeed, morphological changes have been demonstrated to be more pronounced in strongly vs. weakly metastatic cells.
By means of normalized bending energy, we have previously quantitatively defined the link between cell shape modifications and the acquisition of a more malignant phenotype by 5-FU-resistant colon cancer cells (HCT-8FUres). Such changes were significantly correlated with an increase in motility speed. Herein, we propose a method to quantitatively analyze the shape of wild and chemoresistant HCT-8 migration front cells during wound healing assay. We evaluated the reliability of parameters (area/perimeter ratio [A/p], circularity, roundness, fractal dimension, and solidity) in describing the biological behavior of the two cell lines, enabling hence in distinguishing the chemoresistant line from the other one. We found solidity index the parameter that better described the difference between chemoresistant and wild cells. Moreover, solidity is able to capture the differences between chemoresistant and wild cells at each time point of the migration process. Indeed, motility speed was found to be inversely correlated with solidity, a quantitative index of cell deformability. Deformability is an outstanding hallmark of the process leading to metastatic spread; consequently, solidity may be considered a marker of acquired metastatic property.
Introduction
The colorectal cancer-specific mortality rate is nearly 33% in the developed world.Citation1 Despite many therapeutic opportunities, prognosis remains poor for patients with advanced, metastatic disease.Citation2 5-fluorouracil (5-FU) is a chemotherapeutic drug commonly used, alone or in association, in the treatment of metastatic colorectal cancer. Yet, despite improvement in protocol design and drug delivery, development of chemoresistance occurs in a high percentage of patients.Citation3,Citation4 Unsuccessful cytotoxic anticancer treatments may contribute to tumor morphologic instability, henceforth promoting the selection of a more malignant phenotype.Citation5,Citation6 Indeed, morphological changes have been demonstrated to be more pronounced in strongly vs. weakly metastatic cells.Citation7
Cell shape can be considered the spatial geometric configuration acquired as a result of the integrated set of cellular and environmental cues participating in biological functions control.Citation8 As a consequence, measurable parameters describing shape could be considered as “-omics” descriptors of the system constituted by cells and their microenvironment.Citation9 The specific configuration a cell acquires plays a fundamental role in modulating gene expression and complex biological functions, and it can be considered as “the most critical determinant of cell function.”Citation10 Thus, application of integrative mathematical techniques to perform a quantitative geometrical descriptionCitation11-Citation14 promises to formalize some of the underlying basic mechanisms underpinning the neoplastic transformation, providing, thereby, an integrated, “systems” framework.Citation15
In a previous study we have quantitatively defined the link between cell shape modifications and the acquisition of a more malignant phenotype by 5-FU-resistant colon cancer cells (HCT-8FUres), measuring a morphological, thermodynamically linked parameter of cell profile.Citation14 Moreover, we showed the acquisition of new functional skills by HCT-8FUres cells is significantly associated to concomitantly changes in cell shape. Briefly, chemoresistant cells didn’t undergo apoptosis and overcame cell cycle arrest after 5-FU treatment. Moreover, HCT-8FUres cells showed a significantly higher proliferation rate in respect to chemosensitive cells and migrated more rapidly. Cell migration is a critical feature of the metastatic process,Citation16 and methods to quantify it would be worth of investigation in assessing efficacy of clinical treatments.Citation17,Citation18
Herein, we investigate how the acquired more malignant, invasive phenotype could be monitored by means of quantitative shape features, able to recognize wild and chemoresistant HCT-8 migration front cells during wound healing assay. Particularly, we focused on solidity, hypothesizing it could be a good descriptor of cell deformability. Cellular biomechanics play an important role in metastasis, and it has been observed across multiple measurement platforms that cancer cell deformability correlates with increased metastatic potential.Citation19-Citation22 The solidity index is relatively simple to obtain using validated software such as ImageJ. Other parameters with biological meaning can be calculated similarly: area/perimeter ratio (A/p), circularity, roundness, and fractal dimension (FD). Hence, A/p, circularity, roundness, FD, and solidity have been considered for their ability to describe the biological behavior of the two cell lines, and eventually to distinguish the chemoresistant cell line from the other one.
Results
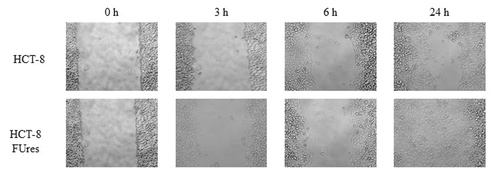
As expected, according to a previous work,Citation14 after 24 h HCT-8FUres cells closed the open area, while HCT-8 migration fronts are still well separated at that time ().We analyzed the four shape parameters at the earlier time points (0, 3, and 6 h), and at the final time point (24 h) of the wound healing experiments.
Figure 1. Representative images of wound healing assay. HCT-8 (upper lane) and HCT-8FUres (lower lane) acquired at 320 X magnification, at 0, 3, 6, and 24 h are shown.
Area/perimeter ratio
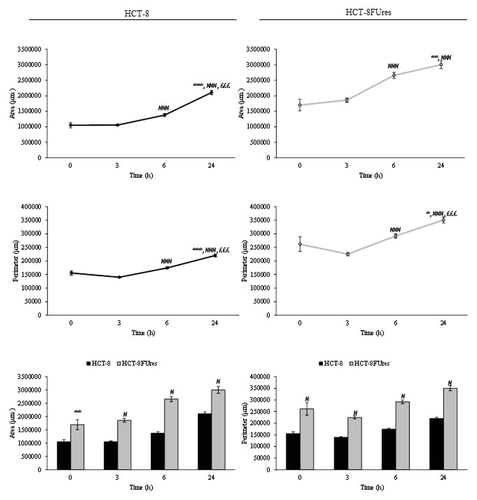
In HCT-8 and HCT-8FUres cells, area and perimeter increased both during migration (). However, HCT-8FUres cells showed significantly higher area and perimeter values in respect to HCT-8 cells, at each time point considered.
Figure 2. Area and perimeter values. Line graphs show area (upper panels) and perimeter (lower panels) mean value ± SE at each time point in HCT-8 and HCT-8FUres cells.*P < 0.05, **P < 0.01 ***P < 0.001 vs. 0 h; ###P < 0.001 vs. 3 h; £££P < 0.001 vs. 6 h by ANOVA followed by Bonferroni post-test. Histograms show Area (left panel) and perimeter (right panel) mean value ± S.E., comparing HCT-8 and HCT-8FUres cell lines at each time considered. **P < 0.01; #P < 0.0001 by unpaired two-tailed t-test.
In both cell lines, the area/perimeter ratio (A/p) increased with time and became significantly higher in respect to 0 h time point from 6 h of migration (). In HCT-8 cells, the highest A/p value was reached only after 24 h of migration, while in HCT-8FUres after 6 h.
Figure 3. A/p parameter. Line graphs show A/p mean value ± SE at each time point in HCT-8 and HCT-8FUres cells. *P < 0.05,**P < 0.01 *** P < 0.001 vs. 0 h;##P < 0.01,###P < 0.001 vs. 3 h; £££P < 0.001 vs. 6 h by ANOVA followed by Bonferroni post-test. Histogram shows A/p mean value ± S.E., comparing HCT-8 and HCT-8FUres cell lines at each time considered. ***P < 0.001; #P < 0.0001 by unpaired two-tailed t-test.
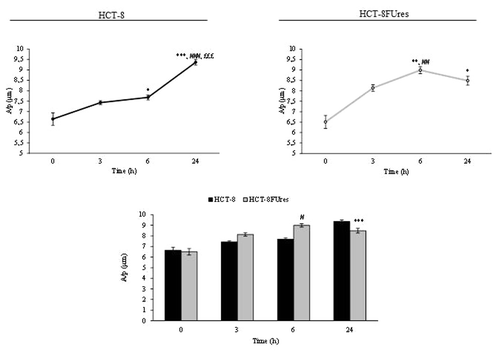
Comparing the two cell lines, HCT-8FUres migrating cells showed a significantly higher A/p in respect to HCT-8 cells after 6 h of migration and a significantly lower A/p after 24 h, after they closed the open area.
Circularity
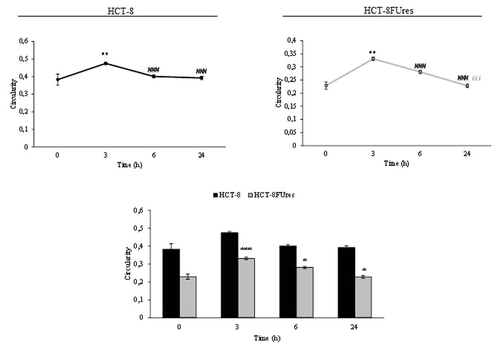
In both cell lines the circularity values evolves similarly in time, showing a significant change only after 3 h of migration (). At that time circularity value increases in both HCT-8 and HCT-8FUres cells, even if the latter remains significantly lower than the former. Thereafter, circularity decreased to eventually reach the basal value (0 h).
Figure 4. Circularity parameter. Line graphs show Circularity mean value ± SE at each time point in HCT-8 and HCT-8FUres cells. **P < 0.01 vs. 0 h; ###P < 0.001 vs. 3 h; £££P < 0.001 vs. 6 h by ANOVA followed by Bonferroni post-test. Histogram shows Circularity mean value ± S.E., comparing HCT-8 and HCT-8FUres cell lines at each time considered. *P < 0.05; ***P < 0.001 by unpaired two-tailed t-test.
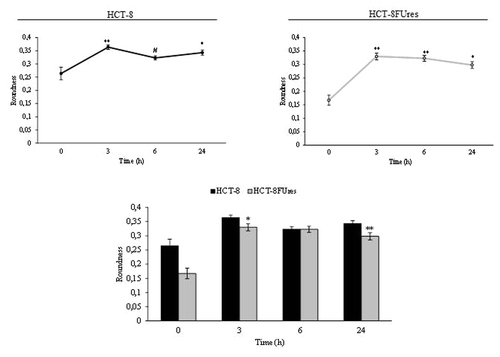
Roundness
Both cell lines showed a significant strong increase in roundness at 3 h post migration. In HCT-8FUres cells this increase is followed by a slightly (not statistically significant) decrease, given that roundness remains significantly higher in respect to 0 h time point. A similar behavior has been observed in HCT-8 cells, in which, roundness reach the highest value only after 6 h post-migration; after that time a mild decrease in roundness value occurs, even if values was always higher in respect to 0 h (). Overall, roundness is basically lower in chemoresistant cells, yet that difference reaches significance only after 3 and 24 h after migration.
Figure 5. Roundness parameter. Line graphs show roundness mean value ± SE at each time point in HCT-8 and HCT-8FUres cells. *P < 0.05, **P < 0.01 vs. 0 h; #P < 0.05 vs. 3 h by ANOVA followed by Bonferroni post-test. Histogram shows roundness mean value ± S.E., comparing HCT-8 and HCT-8FUres cell lines at each time considered. *P < 0.05; **P < 0.01 by unpaired two-tailed t-test.
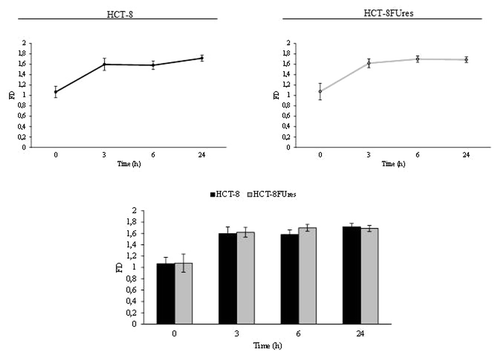
Fractal dimension
Given that FD has been seldom used in quantifying cell morphology, we calculated FD for membrane profile evaluation. Fractal values display a similar trend in both HCT-8 and HCT-8FUres migrating cells: FD increases at the earlier times (0, 3, and 6 h), and eventually decreases at 24 h (). Yet, even if values in HCT-8FUres are higher on average in respect to HCT-8 cells, differences in between the two experimental samples does not reach any statistical significance.
Figure 6. Fractal dimension. Line graphs show FD mean value ± SE at each time point in HCT-8 and HCT-8FUres cells. Significance was calculated by ANOVA followed by Bonferroni post-test. Histogram shows FD mean value ± SE, comparing HCT-8 and HCT-8FUres cell lines at each time considered. Significance was calculated by unpaired two-tailed t-test.
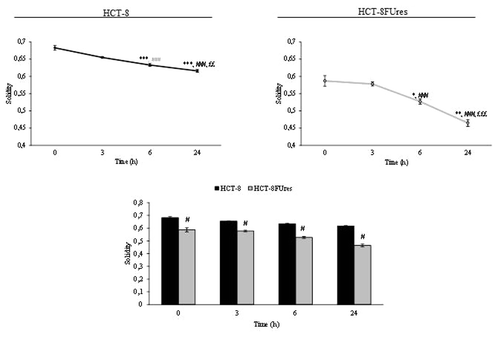
Solidity
During wound healing the solidity index decreased after 6 h of migration and reached its lowest level at 24 h in both cell lines (). However, in HCT-8FUres migrating cells the solidity index was significantly lower in respect to HCT-8 cells at each time point considered.
Figure 7. Solidity parameter. Line graphs show solidity mean value ± SE at each time point in HCT-8 and HCT-8FUres cells. *P < 0.05, **P < 0.01, ***P < 0.001 vs. 0 h; ###P < 0.001 vs. 3 h; ££P < 0.01, £££P < 0.001vs. 6 h by ANOVA followed by Bonferroni post-test. Histogram shows solidity mean value ± SE, comparing HCT-8 and HCT-8FUres cell lines at each time considered. #P < 0.0001 by unpaired two-tailed t-test.
Discussion
Migration is known to be involved in many physiological and pathological processes, such as development, immune surveillance, and cancer metastasis.Citation23 Migratory cancer cells undergo dramatic molecular and cellular changes by remodeling their cell-to-cell and cell–matrix adhesion, as well as their cytoskeleton.Citation16 Cell shape changes are translated into biochemical signals, which may modulate cell phenotype and biological properties.Citation24 Eventually, shape changes significantly influence cell behavior and evolution.Citation25-Citation28 Indeed, cell shape has been shown to regulate biological processes such as proliferation, differentiation, and stem cells commitment.Citation29-Citation32
As cell morphology analysis is often performed qualitatively, parameters which could provide a quantitative measure of shape changes are needed to closely associate those modifications to physiological or pathological state.Citation33,Citation34 As previously reported, 5-FU-resistant HCT-8 cells showed a significant difference in a shape quantitative parameter in respect to HCT-8 wild cells, and that finding is mirrored by the acquisition of higher motility by HCT-8FUres cells.Citation14 In agreement with those results, in the present study we have analyzed A/p, circularity, roundness, and solidity parameters of chemoresistant and wild migration front cells at the first hours of the migration process, and at 24 h, when HCT-8FUres cells closed the wound, while HCT-8 cells are still about half of the path.Citation14 The final goal was to describe the biological difference observed by means of simple quantitative morphological parameters.
The A/p parameter is a dimensionless one, and determines if a change in cell surface is really due to a modification in cell membrane dimension. Comparing the A/p with the separately considered area and perimeter data, we observed that both HCT-8 and HCT-8FUres migrating cells increased their surface regularly over time. When HCT-8FUres cells closed the open area (at 24 h), their A/p value became significantly lower in respect to HCT-8 cells. As shown in , this was due to a higher increase of the HCT-8FUres cells perimeter in respect to their area. It is likely that this turnaround mirrors the fact that cells closing the open area of wound healing assay are close enough to establish links with each other, stretching themselves and making their perimeter higher than their area.
Basically, the higher circularity values are, the higher the trend for a cell to assume a circular shape is. In both HCT-8 and HCT-8FUres migrating cells, circularity significantly increased after 3 h of migration and then decreased, returning to values similar to those at 0 h. This could be due to transient cytoskeletal rearrangement the cells require to protrude and migrate. In HCT-8FUres cells, circularity was significantly lower in respect to HCT-8 cells from 3 h post migration. Indeed, chemoresistant cells showed to be less rounded, spindle shaped, and protruding.
Roundness biological significance does not significantly differ from that of circularity, and indeed, both cell lines showed a significant strong increase in roundness at 3 h post migration. This parameter remains higher in respect to 0 h in both HCT-8 and HCT-8FUres cells, even if in HCT-8 cells a significant decrease at 6 h post-migration in respect to 3 h post-migration was noticed. This could be due to the introduction in the roundness formula of the major axes variable, which makes this parameter strongly influenced by cell dimension. Nonetheless, comparing the two cell lines HCT-8FUres showed to be less rounded, displaying so far a spindle-like profile.
FD often proved to be a useful parameter to characterize cell shape.Citation8,Citation9,Citation18,Citation35 The trend FD assumed characterized well the migration process. Indeed, at earlier times of migration FD increase markedly, although not significantly, in both cell lines. However, in our model FD was not able to describe differences between HCT-8 and HCT-8FUres cells.
Solidity describes in geometrical terms the stiffness and deformability of an object. Thus, the higher the solidity is, the lower the cell deformability. The decrease of solidity in both cell lines during the wound healing assay demonstrate that this index is able to describe the progression of migration process in which cells would be deformable enough to increase their motility and invasiveness. HCT-8FUres cells had significantly lower solidity values at every time considered in respect to HCT-8 wild cells. These data are reflective of a lower stiffness and higher deformability of HCT-8FUres cells. Taking into consideration that deformability represents a hallmark of cancer metastatic potential,Citation36 solidity change could be therefore a reliable indicator of the transition from a non-metastatic toward a metastatic, highly invasive phenotype.
Overall, such results indicate solidity as a more valuable parameter in describing not only the difference between chemoresistant and wild cells, but also the changes each cell line undergoes during migration. Furthermore, solidity is able to capture the differences between chemoresistant and wild cells at each time point of the migration process. Solidity is inversely correlated with deformability, and as such, it would be considered a measurable feature of a specific biological property. The increased deformability of cancer cells is accompanied by modified metastatic competence. For example, cancerous MCF 7 cells are more deformable than the normal MCF 10, and the metastatic Mod MCF 7 cells are even more deformable than MCF 7 cells.Citation37 Indeed, the solidity index is a useful parameter to describe in geometrical terms the stiffness and deformability of an object, and it is related to its spatial complexity.Citation38 Moreover, elastic deformability of epithelial cells is required in cancer metastasis to penetrate through the endothelial layer, and it has been suggested that significantly enhanced propensity of the cell to accommodate deformation facilitate rapid and reversible “squeezing through” and migration of epithelial gastrointestinal tumor cells through size limited pores.Citation39 Thus, measuring a cell’s solidity should be useful, and may be viewed as a new biological marker.Citation21 Namely, solidity index could be deemed a simple and reliable parameter in evaluating the malignant and metastatic potential of cancer cells.
Materials and Methods
Chemicals and drugs
5-Fluorouracil (5-FU), which was dissolved in Dulbecco’s modified Eagle’s medium (DMEM) (1 mg/ml) before use, was purchased from Teva Pharmaceutical Industries Ltd.
Cell culture
The human colon cancer cell line HCT-8 was obtained from the European Collection of Cell Cultures (ECACC). Cells were seeded into 25 cm2 flasks (Falcon; Becton Dickinson Labware) in Dulbecco’s modified Eagle’s medium (DMEM) supplemented with 10% fetal bovine serum (FBS) and antibiotics (penicillin 100 IU/ml, streptomycin 100 μg/ml). The cultures were kept at 37 °C in an atmosphere of 5% CO2 in air, and the medium was changed every third day. At confluence, the cells were subcultured after removal with 0.05% trypsin- 0.01% EDTA.
Induction of HCT-8 5-FU resistant line (HCT-8FUres)
HCT-8 cells were used to develop a 5-FU- resistant line, according to Pasqualato et al.Citation14 When the cells were in their exponential growth phase, they were treated with 5-FU at 0.1 μg/ml, and the surviving cells were cultured to confluence for three passages. The cells that survived were exposed to 0.5 μg/ml 5-FU and, after three passages, to 1.0 μg/ml 5-FU. Finally, the surviving cells were exposed to the clinically relevant plasma concentration of 2.0 μg/ml. The surviving resistant cells were named HCT-8FUres. These cells were continuously cultured in 2.0 μg/ml 5-FU, while wound healing assay was performed in DMEM 10% FBS.
Wound healing assay
The wound healing assay was performed using special double-well culture inserts (80209, ibidi GmbH), as previously described.Citation14 Each insert was placed in a well of a 6-well plate (Falcon; Becton Dickinson Labware). We use three insert for each condition (HCT-8, HCT-8FUres) and 70 μl of each cell suspension (prepared at the concentration of 5 × 10⁵ cells/ml) were placed into both well of each insert. After cells attachment, media were replaced with DMEM 1% FBS. After 24 h, the culture inserts were gently removed and cells were fed with DMEM 10% FBS, as stimulus to migration. Plates were then incubated at 37 °C in an atmosphere of 5% CO2 and migration front cells were photographed at 320X magnification with a Nikon DS-Fi1 (Nikon Corporation) camera, coupled with a Zeiss Axiovert 10 optical microscope, at 0, 3, 6, and 24 h, time at which HCT-8FUres are known to close the open area.Citation14
Image analysis
Image analysis was performed on 46 images for HCT-8 cells and 41 images for HCT-8FUres cells. As the analysis was performed blindly, the two image groups were classified as A (HCT-8FUres) and B (HCT-8). In each image, single randomly chosen cells were contoured with a fine black marker by different researchers, simply scanned and cataloged according to the time of study: 0, 3, 6, and 24 h ( and ). This method was chosen because pathologists use to correlate the shape the cells acquire with their malignancy by means of morphological, qualitative, and subjective observations. Thus, we decided to perform a semi-automatic analysis, coupling the expertise of researchers with a computerized parameterization method.
Figure 8. Schematization of the image analysis method. (A) Example of scanned images from group A (A, HCT-8FUres), and group B (B, HCT-8) after 6 h of migration. Single cells were contoured with a fine black marker. The second panel shows a group B (HCT-8) representative image after post-production by Photoshop taken after 6 h of migration. The third panel shows an example of sheet grouping cells analyzed of the same image. (B) Example of zoomed image of a single cell with an overlapped grid. The width of a single square side is 10 pixels, that is 4.96 µm.
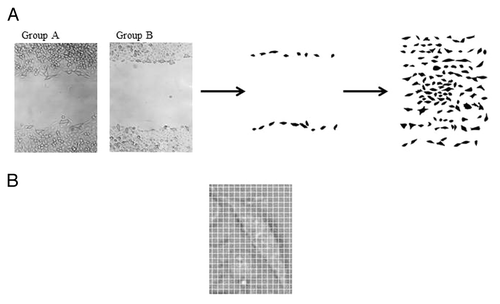
Table 1. Number of cells analyzed for each group and time point
All the images were processed by Adobe Photoshop CS4. All the pictures (i.e., all the sheets of group A and group B, for each time point) were resized at 2560 × 1920 pixels according to original scale of image acquisition. For each black contoured cell, edges were refined. Then cells were black filled and threshold was adjusted in order to exclude from the image other cells and background. For each time point a single sheet of all the cells considered was created ().
To obtain single cell shape parameters (area A, perimeter p, circularity, roundness, fractal dimension FD, solidity), ImageJ v1.47h software was used. To calibrate the software, the open area pixel size at 0 h point was used, because the wound healing insert allows the creation of an exact 500 µm cut (). As this cut showed to be 1008 pixels long, the pixel size was 0.496 µm.
Then, the software analyzed single cells, by the function “shape descriptor.” In addition to area A and perimeter p, were calculated:
Where A is the area of the cell, p is the perimeter of the cell, ma is the major axis, and CA is the convex area, namely the area of the convex hull of the region. The segment used to he convex hull of a region is the smallest region that satisfies two conditions: (1) it is convex (2) it contains the original region.
As for FD, it was obtained by means of box counting method using FracLac plugin:
Where C is the considered curve, L is the length of the curve C, and ε is the length of the segment used as unit to calculate L.
For each parameter a macro was created, and results were saved in Microsoft Excel format, to obtain area-perimeter ratio (4), and the mean and relative standard error.
Finally, single graphs about area/perimeter ratio (A/p), circularity, roundness, FD, and solidity were obtained for each set of images.
Statistical analysis
All data are expressed as mean values ± standard errors (S.E.) and statistical analysis was performed using unpaired two-tailed t-test, when HCT-8 and HCT-8FUresresults were compared. To show the evolution in time of each parameter in a single case (HCT-8 or HCT-8FUres cells), statistical analysis between values of each time point was performed using ANOVA, followed by Bonferroni post-test.
Differences were considered significant at the level of P < 0.05. Statistical analysis was performed by using Graph-Pad Instat software (GraphPad Software, Inc.).
Method’s reproducibility has been established by evaluating the statistical significance of differences emerging when different operators performed the same analysis (inter-variability difference). Indeed, differences in recorded in measuring the same parameters by different, skilled operators does not reach any statistically significant difference (data not shown), and were below the threshold limit of 5% of the average value.
Disclosure of Potential Conflicts of Interest
No potential conflicts of interest were disclosed.
References
- Cunningham D, Atkin W, Lenz HJ, Lynch HT, Minsky B, Nordlinger B, Starling N. Colorectal cancer. Lancet 2010; 375:1030 - 47; http://dx.doi.org/10.1016/S0140-6736(10)60353-4; PMID: 20304247
- Crea F, Nobili S, Paolicchi E, Perrone G, Napoli C, Landini I, Danesi R, Mini E. Epigenetics and chemoresistance in colorectal cancer: an opportunity for treatment tailoring and novel therapeutic strategies. Drug Resist Updat 2011; 14:280 - 96; http://dx.doi.org/10.1016/j.drup.2011.08.001; PMID: 21955833
- De Angelis PM, Svendsrud DH, Kravik KL, Stokke T. Cellular response to 5-fluorouracil (5-FU) in 5-FU-resistant colon cancer cell lines during treatment and recovery. Mol Cancer 2006; 5:20; http://dx.doi.org/10.1186/1476-4598-5-20; PMID: 16709241
- Dallas NA, Xia L, Fan F, Gray MJ, Gaur P, van Buren G 2nd, Samuel S, Kim MP, Lim SJ, Ellis LM. Chemoresistant colorectal cancer cells, the cancer stem cell phenotype, and increased sensitivity to insulin-like growth factor-I receptor inhibition. Cancer Res 2009; 69:1951 - 7; http://dx.doi.org/10.1158/0008-5472.CAN-08-2023; PMID: 19244128
- Cristini V, Frieboes HB, Gatenby R, Caserta S, Ferrari M, Sinek J. Morphologic instability and cancer invasion. Clin Cancer Res 2005; 11:6772 - 9; http://dx.doi.org/10.1158/1078-0432.CCR-05-0852; PMID: 16203763
- Ferreira SC Jr., Martins ML, Vilela MJ. Morphology transitions induced by chemotherapy in carcinomas in situ. Phys Rev E Stat Nonlin Soft Matter Phys 2003; 67:051914; http://dx.doi.org/10.1103/PhysRevE.67.051914; PMID: 12786185
- Heckman CA, Jamasbi RJ. Describing shape dynamics in transformed cells through latent factors. Exp Cell Res 1999; 246:69 - 82; http://dx.doi.org/10.1006/excr.1998.4242; PMID: 9882516
- Bizzarri M, Pasqualato A, Cucina A, Pasta V. Physical forces and non linear dynamics mould fractal cell shape: quantitative morphological parameters and cell phenotype. Histol Histopathol 2013; 28:155 - 74; PMID: 23275300
- Dinicola S, D’Anselmi F, Pasqualato A, Proietti S, Lisi E, Cucina A, Bizzarri M. A systems biology approach to cancer: fractals, attractors, and nonlinear dynamics. OMICS 2011; 15:93 - 104; http://dx.doi.org/10.1089/omi.2010.0091; PMID: 21319994
- Ingber DE. How cells (might) sense microgravity. FASEB J 1999; 13:Suppl S3 - 15; PMID: 10352140
- Heckman CA. Geometrical constraints on the shape of cultured cells. Cytometry 1990; 11:771 - 83; http://dx.doi.org/10.1002/cyto.990110703; PMID: 2272242
- Kamran SC, Reichman DE, Missmer SA, Correia KF, Karaca N, Romano A, Racowsky C. Day 3 embryo shape as a morphologic selection parameter in in vitro fertilization. J Assist Reprod Genet 2012; 29:1135 - 9; http://dx.doi.org/10.1007/s10815-012-9842-7; PMID: 22890423
- Ficsor L, Varga VS, Tagscherer A, Tulassay Z, Molnar B. Automated classification of inflammation in colon histological sections based on digital microscopy and advanced image analysis. Cytometry A 2008; 73:230 - 7; http://dx.doi.org/10.1002/cyto.a.20527; PMID: 18228558
- Pasqualato A, Palombo A, Cucina A, Mariggiò MA, Galli L, Passaro D, Dinicola S, Proietti S, D’Anselmi F, Coluccia P, et al. Quantitative shape analysis of chemoresistant colon cancer cells: correlation between morphotype and phenotype. Exp Cell Res 2012; 318:835 - 46; http://dx.doi.org/10.1016/j.yexcr.2012.01.022; PMID: 22342954
- Marshall WF. Origins of cellular geometry. BMC Biol 2011; 9:57 - 71; http://dx.doi.org/10.1186/1741-7007-9-57; PMID: 21880160
- Yilmaz M, Christofori G. Mechanisms of motility in metastasizing cells. Mol Cancer Res 2010; 8:629 - 42; http://dx.doi.org/10.1158/1541-7786.MCR-10-0139; PMID: 20460404
- Palmer TD, Ashby WJ, Lewis JD, Zijlstra A. Targeting tumor cell motility to prevent metastasis. Adv Drug Deliv Rev 2011; 63:568 - 81; http://dx.doi.org/10.1016/j.addr.2011.04.008; PMID: 21664937
- Sullivan R, Holden T, Tremberger G Jr., Cheung E, Branch C, Burrero J, Surpris G, Quintana S, Rameau A, Gadura N, et al. Fractal dimension of breast cancer cell migration in a wound healing assay. Int. J. Biol. Life Sci. 2011; 7:170 - 5
- Swaminathan V, Mythreye K, O’Brien ET, Berchuck A, Blobe GC, Superfine R. Mechanical stiffness grades metastatic potential in patient tumor cells and in cancer cell lines. Cancer Res 2011; 71:5075 - 80; http://dx.doi.org/10.1158/0008-5472.CAN-11-0247; PMID: 21642375
- Wirtz D, Konstantopoulos K, Searson PC. The physics of cancer: the role of physical interactions and mechanical forces in metastasis. Nat Rev Cancer 2011; 11:512 - 22; http://dx.doi.org/10.1038/nrc3080; PMID: 21701513
- Xu W, Mezencev R, Kim B, Wang L, McDonald J, Sulchek T. Cell stiffness is a biomarker of the metastatic potential of ovarian cancer cells. PLoS One 2012; 7:e46609; http://dx.doi.org/10.1371/journal.pone.0046609; PMID: 23056368
- Byun S, Son S, Amodei D, Cermak N, Shaw J, Kang JH, Hecht VC, Winslow MM, Jacks T, Mallick P, et al. Characterizing deformability and surface friction of cancer cells. Proc Natl Acad Sci U S A 2013; 110:7580 - 5; http://dx.doi.org/10.1073/pnas.1218806110; PMID: 23610435
- Friedl P, Gilmour D. Collective cell migration in morphogenesis, regeneration and cancer. Nat Rev Mol Cell Biol 2009; 10:445 - 57; http://dx.doi.org/10.1038/nrm2720; PMID: 19546857
- Huang S, Ingber DE. Shape-dependent control of cell growth, differentiation, and apoptosis: switching between attractors in cell regulatory networks. Exp Cell Res 2000; 261:91 - 103; http://dx.doi.org/10.1006/excr.2000.5044; PMID: 11082279
- Watson PA. Function follows form: generation of intracellular signals by cell deformation. FASEB J 1991; 5:2013 - 9; PMID: 1707019
- Jaasma MJ, Jackson WM, Keaveny TM. The effects of morphology, confluency, and phenotype on whole-cell mechanical behavior. Ann Biomed Eng 2006; 34:759 - 68; http://dx.doi.org/10.1007/s10439-005-9052-x; PMID: 16604293
- Ingber DE. Mechanical control of tissue growth: function follows form. Proc Natl Acad Sci U S A 2005; 102:11571 - 2; http://dx.doi.org/10.1073/pnas.0505939102; PMID: 16091458
- Jahnen-Dechent W, Simon U. Function follows form: shape complementarity and nanoparticle toxicity. Nanomedicine (Lond) 2008; 3:601 - 3; http://dx.doi.org/10.2217/17435889.3.5.601; PMID: 18817462
- Watt FM, Jordan PW, O’Neill CH. Cell shape controls terminal differentiation of human epidermal keratinocytes. Proc Natl Acad Sci U S A 1988; 85:5576 - 80; http://dx.doi.org/10.1073/pnas.85.15.5576; PMID: 2456572
- Roskelley CD, Desprez PY, Bissell MJ. Extracellular matrix-dependent tissue-specific gene expression in mammary epithelial cells requires both physical and biochemical signal transduction. Proc Natl Acad Sci U S A 1994; 91:12378 - 82; http://dx.doi.org/10.1073/pnas.91.26.12378; PMID: 7528920
- Chen CS, Mrksich M, Huang S, Whitesides GM, Ingber DE. Geometric control of cell life and death. Science 1997; 276:1425 - 8; http://dx.doi.org/10.1126/science.276.5317.1425; PMID: 9162012
- McBeath R, Pirone DM, Nelson CM, Bhadriraju K, Chen CS. Cell shape, cytoskeletal tension, and RhoA regulate stem cell lineage commitment. Dev Cell 2004; 6:483 - 95; http://dx.doi.org/10.1016/S1534-5807(04)00075-9; PMID: 15068789
- Cross SS. Fractals in pathology. J Pathol 1997; 182:1 - 8; http://dx.doi.org/10.1002/(SICI)1096-9896(199705)182:1<1::AID-PATH808>3.0.CO;2-B; PMID: 9227334
- Cesar RM Jr.. Application and assessment of multiscale bending energy for morphometric characterization of neural cells. Rev Sci Instrum 1997; 68:2177 - 86; http://dx.doi.org/10.1063/1.1148112
- Ferranti F, D’Anselmi F, Caruso M, Lei V, Dinicola S, Pasqualato A, Cucina A, Palombo A, Ricci G, Catizone A, et al. TCam-2 seminoma cells exposed to egg-derived microenvironment modify their shape, adhesive pattern and migratory behaviour: a molecular and morphometric analysis. PLoS One 2013; 8:e76192; http://dx.doi.org/10.1371/journal.pone.0076192; PMID: 24098438
- Agus DB, Alexander JF, Arap W, Ashili S, Aslan JE, Austin RH, Backman V, Bethel KJ, Bonneau R, Chen WC, et al, Physical Sciences - Oncology Centers Network. A physical sciences network characterization of non-tumorigenic and metastatic cells. Sci Rep 2013; 3:1449; http://dx.doi.org/10.1038/srep01449; PMID: 23618955
- Guck J, Schinkinger S, Lincoln B, Wottawah F, Ebert S, Romeyke M, Lenz D, Erickson HM, Ananthakrishnan R, Mitchell D, et al. Optical deformability as an inherent cell marker for testing malignant transformation and metastatic competence. Biophys J 2005; 88:3689 - 98; http://dx.doi.org/10.1529/biophysj.104.045476; PMID: 15722433
- Sołtys Z, Ziaja M, Pawlínski R, Setkowicz Z, Janeczko K. Morphology of reactive microglia in the injured cerebral cortex. Fractal analysis and complementary quantitative methods. J Neurosci Res 2001; 63:90 - 7; http://dx.doi.org/10.1002/1097-4547(20010101)63:1<90::AID-JNR11>3.0.CO;2-9; PMID: 11169618
- Suresh S, Spatz J, Mills JP, Micoulet A, Dao M, Lim CT, Beil M, Seufferlein T. Connections between single-cell biomechanics and human disease states: gastrointestinal cancer and malaria. Acta Biomater 2005; 1:15 - 30; http://dx.doi.org/10.1016/j.actbio.2004.09.001; PMID: 16701777