Abstract
RON (MST1R) is one of two members of the MET receptor tyrosine kinase family, along with parent receptor MET. RON has a putative role in several cancers, but its expression and function is poorly characterized in gastroesophageal adenocarcinoma. A recognized functional role of MET tyrosine kinase in gastroesophageal cancer has led to early phase clinical trials using MET inhibitors, with unimpressive results. Therefore, the role of RON in gastroesophageal cancer, as well as its role in cooperative signaling with MET and as a mechanism of resistance to MET inhibition, was studied in gastroesophageal tissues and cell lines. By IHC, RON was highly over-expressed in 74% of gastroesophageal samples (n=94), and over-expression was prognostic of poor survival (p=0.008); RON and MET co-expression occurred in 43% of samples and was prognostic of worst survival (p=0.03). High MST1R gene copy number by quantitative polymerase chain reaction, and confirmed by fluorescence in situ hybridization and/or array comparative genomic hybridization, was seen in 35.5% (16/45) of cases. High MST1R gene copy number correlated with poor survival (p=0.01), and was associated with high MET and ERBB2 gene copy number. A novel somatic MST1R juxtamembrane mutation R1018G was found in 11% of samples. RON signaling was functional in cell lines, activating downstream effector STAT3, and resulted in increased viability over controls. RON and MET co-stimulation assays led to enhanced malignant phenotypes over stimulation of either receptor alone. Growth inhibition as evidenced by viability and apoptosis assays was optimal using novel blocking monoclonal antibodies to both RON and MET, versus either alone. SU11274, a classic MET small molecule tyrosine kinase inhibitor, blocked signaling of both receptors, and proved synergistic when combined with STAT3 inhibition (combination index <1). These preclinical studies define RON as an important novel prognostic marker and therapeutic target for gastroesophageal cancer warranting further investigation.
Introduction
Gastroesophageal adenocarcinoma (GEC) remains a challenging problem in oncology. Gastric cancer (GC) is the fourth most common malignancy worldwide. In 2010, there were 21,000 new cases of GC and 10,570 deaths in the US.Citation1 The incidence of proximal GC and gastroesophageal junction adenocarcinomas (GEJ) is rising in the USA, while the endemic form, associated with H. pylori infection in the distal stomach is declining.Citation2 Esophageal cancer, of which distal/GEJ accounts for around 60%, is also a lethal malignancy, with 16,640 cases diagnosed and 14,500 deaths in 2010; there is an estimated 350% increase in the US in the last three decades for unclear reasons. Because it is often difficult to differentiate GEJ adenocarcinomas originating from the gastric cardia versus distal esophagusCitation3 and due to their similar aggressive behavior, these tumors are treated equally in the metastatic setting.Citation4,Citation5 Overall 5-year survival is poor (<20% for all patients) and tumors treated with curative resection have a high risk of metastatic recurrence despite neoadjuvant and/or adjuvant treatment strategies.Citation6 Patients with metastatic disease have a median overall survival on the order of 9 to 11 months. Clearly, more efficacious therapies are desperately needed to improve these outcomes. Recently, novel targeted biologic agents have resulted in improved outcomes in a number of cancers, including gastroesophageal cancers. Because HER2 (ERBB2) is amplified in approximately 10–20% of GEC, traztuzumab antibody treatment was evaluated in a large randomized phase III trial (ToGA) in combination with chemotherapy, and was reported to have a modest improvement in overall median survival versus chemotherapy alone (13.8 vs. 11.1 months, respectively) in a select ERBB2 amplified subgroup of GC and GEJ patients.Citation7 Aside from HER2, it is believed that the MET receptor tyrosine kinase (RTK) plays an important role in GEC.
Upregulation of MET and its ligand, hepatocyte growth factor (HGF), are correlated with the development and metastasis of cancers, including GC and GEJ.Citation8,Citation9 MET gene clustered amplification occurs in approximately 5–10% of GEC and rendered cell lines with this amplification sensitive to targeted MET inhibition in preclinical models.Citation10–Citation12 Interim results of the phase II trial of GSK089, a combined MET/VEGFR2 inhibitor, for chemorefractory metastatic GEC cancer reported stable disease in 15% (6/41) of patients, but paradoxically these patients were not those with MET gene amplification (3/41) (Jhawer et al. J Clin Oncol 26: 2008 [May 20 suppl; abstr 4572]).
RON (MST1R, recepteur d'origine nantais), the other member of the MET family, is a RTK for the ligand macrophage-stimulating protein (MSP, MST1), which is associated with in vitro and in vivo cell dissociation, motility and matrix invasion—all of which are surrogate markers of an aggressive cancer phenotype with metastatic potential.Citation13–Citation16 MST1R has 60% homology to MET in the kinase domain.Citation17 Both proteins are translated to precursor proteins, that undergo proteolytic cleavage to α and β subunits linked by disulfide bonds.Citation13 RON immunoreactivity, although found in the fetus, was not observed in adult gastric mucosa except in incidental intestinal metaplastic cells in adult autopsies.Citation18 Immunohistochemistry (IHC) of various tumor types revealed RON overexpression, including GEC.Citation19,Citation20 RON mediates oncogenic phenotypes in lung, thyroid, pancreas, prostate, colon and breast cancer cellsCitation21–Citation29 and predicts a poor prognosis in human breast cancer.Citation30 RON promotes similar, but not identical, MSP-independent and MSP-dependent phenotypes in breast cancer cells.Citation31 Co-expression of RON with MET and the induction of RON expression by HGF-MET signaling have both been described in hepatocellular carcinoma.Citation32 The MET and RON receptors may cross-talk.Citation33 Co-expression of MET and RON portends a worse prognosis in ovary, breast and bladder cancers.Citation34–Citation36 However, current MET inhibitors, namely anti-HGF and anti-MET antibodies, in early clinical trials are specific to the HGF/MET axis.Citation37,Citation38,Citation86,Citation87 Small molecule MET inhibitors currently evaluated in clinical trials, such as PHA-665752, GSK089 and PF-2341066, inhibit RON and other kinases only at several fold higher levels above the MET inhibitory concentrations.Citation39–Citation41 Given RON and MET signaling redundancy, it is possible that resistance to MET inhibition is mediated by RON signaling.
Based on this background, we have characterized the expression and activation of the RON and MET receptors, including their ligands, MSP and HGF, and downstream proliferative and anti-apoptotic transcription factor, STAT3, in GEC tissues and cell lines. We also describe MST1R gene alteration (copy number changes and mutation) in these same samples. Further, given the homology of RON and MET and their redundant downstream activation pathways, with similar cellular phenotypes, we hypothesized that (i) RON may have an independent prognostic and/or functional role in GEC, (ii) RON and MET cooperative signaling may result in more aggressive phenotypes, (iii) and/or RON signaling may render resistance to MET inhibition (and vice versa). Here we show that RON is indeed highly expressed, and that MSP, RON, HGF and MET co-expression and co-activation is frequent and prognostic of survival in our GEC patient cohort. To our knowledge, this is the first report of MST1R increased gene copy number (high polysomy correlating with increased expression levels), and a novel juxta-membrane mutation from tissue samples. In vitro, we demonstrate that RON is a therapeutic target using novel monoclonal extracellular blocking antibodies, and with small molecule kinase inhibition, as well as two independent proof-of-concept siRNA and shRNA protein knockdown models. We show that RON expression and gene copy number is indeed an important prognostic marker in our GEC cohort. RON specific inhibitors abrogated oncogenic phenotypes, and our results support the notion that future inhibition strategies for the MET receptor family may require dual inhibition of both receptors to circumvent signaling synergy and redundancy as a mechanism of resistance.
Results
RON-MSP and MET-HGF expression in GEC tissues and cell lines.
RON expression correlated with histologic progression and overall survival. To characterize RON and activated phospho-RON (p-RON) expression in GC and GEJ carcinogenesis, we examined primary human tissues (n = 94, 35 US and 59 Korean cohorts) obtained from curative-intent resection by IHC [ (A and B), and ]. RON and p-RON expression was minimal (low-none) in normal mucosa; there was a universal increase in staining intensity from preneoplastic lesions to invasive adenocarcinoma (). Cellular location of staining in tumor cells was seen as combinations of membranous, cytoplasmic and/or nuclear for both RON and p-RON; the invasive front of tumors in general exhibited intense expression (). RON was highly and diffusely expressed in 74% of tumors (), and the remainder of cases showed low/moderate diffuse staining, whereas no cases were completely negative. These data indicate that the expression of RON and p-RON are upregulated upon progression from normal mucosa to metaplasia and through to invasive adenocarcinoma.
To validate the IHC sample sets, tumor stage was correlated with median overall survival (OS) (). RON high expression was independently prognostic of worse OS (median 30 vs. >72 months, Cox p = 0.0079 HR 2.489, stage adjusted Cox p = 0.0187, HR 11.6) (). These data suggest that tumors highly expressing RON may have a worse prognosis than those with low expression, independent of their stage.
RON and MET co-expression in GEC tissue. To characterize the co-incidence of RON and MET expression, serial sections of tissue blocks were evaluated (n = 35), showing 43% of cases with high RON and MET co-expression. Normal mucosa stained negative for MET. MET staining (both high and low) was diffusely expressed in the tumor in 29% (10/35) of cases, focally intense patchy 37% (13/35) or predominantly in the stromal compartment 17% (6/35), whereas 8.6% (3/35) had a mix of MET diffusely in the tumor and in the stroma, and 8.6% (3/35) had patchy MET tumor staining together with stromal staining. RON staining (both high and low) was observed diffusely throughout the tumor in all cases (, top row). RONhigh-METhigh staining was associated with worse OS compared to RONlow-METlow staining (median 30 vs. >80 months, Cox p = 0.027); RONhigh-METlow also showed worse survival over RONlow-METlow staining (median 14 vs. >80 months, p = 0.031) (). There were no cases with RONlow-METhigh. Activated p-RON and p-MET mirrored RON and MET co-staining frequency, showing membranous, cytoplasmic (stippled) and/or nuclear staining patterns [ (bottom rows) and]. Thus, co-expression of RON, MET and their activated forms supports the possibility of signaling co-activation and cooperation with consequent aggressive phenotypes, manifesting in poor patient prognosis.
MSP and HGF expression in GEC tissue. To evaluate the role of an autocrine loop of RON-MET activation via GEC production of the ligands, tissues were stained with anti-MSP and anti-HGF. There was minimal expression of these growth factors in normal mucosa (low levels occasionally seen in the basal region), but expression increased from gastritis and metaplasia to dysplasia and adenocarcinoma. Both MSP and HGF showed strong membranous and diffuse cytoplasmic staining (, bottom rows). These data support the possibility of MET family receptor autocrine signaling in GEC. Interestingly, 25% of samples revealed HGF overexpression solely in the stromal compartment (, last column lanes 2 and 3), similar to MET, suggesting unique roles of MSP-RON and HGF-MET axes in the tumor versus stroma, respectively, in these cases.
Downstream mediator of proliferation, activated STAT3, expression in GEC. Because p-STAT3 was recently shown to be a poor prognostic indicator for GCCitation42–Citation44 its expression was evaluated in malignant versus normal tissues to determine its association with RON expression and activation. p-STAT3 extensity and intensity progressively increased from preneoplastic to neoplastic tissues; it was not present in adjacent normal tissues, but was associated with RON and MET high expression ( and ). STAT3 was highly expressed in 30/35 (86%) and p-STAT3 in 26/35 (74%), directly correlating with RON and p-RON expression. These data support the hypothesis that STAT3 is an important downstream mediator of RON and MET in GEC.
RON, MET, MSP and HGF expression in GEC cell lines. Expression of RON, MSP, MET and HGF were analyzed by immunoblotting (IB) in gastric and esophageal cancer cell lines ( and ). Only one gastric cell line, Snu-1, did not highly express either RON, MET or both. RON and MET membranous expression was also determined by FACS analysis ( and B) and immunofluorescence (IF) ( and ), and results correlated with overall IB expression. AXL tyrosine kinase, of close homology to the MET family kinases, was not expressed in any of the GC lines by IB except Hs746t (). Cell line cDNA (obtained from the starved state) revealed expression of both MSP and HGF transcripts, and correlated with IB expression ( and C). Interestingly Snu-1, which had no RON or MET expression, expressed both ligands at high levels. Collectively, these results indicate high RON and MET expression along with an autocrine and/or paracrine production of MSP and HGF by GEC cell lines.
MST1R gene alteration.
Since MET and ERBB2 gene amplification and mutations have been described in GEC and other cancers, and to explore the mechanisms underlying the high protein expression of RON that we observed in GEC, we screened 19 GEC cell lines and a cohort of 45 tissue samples for gene copy number (GCN) and mutations in MST1R.
MST1R gene copy number in GEC cell lines and tissues. Since high EGFR, MET and IGF1R gene copy number (GCN), including high polysomy and clustered gene amplification, has been described to be prognostic of clinical outcomes and predictive of response to targeted inhibition in cancers,Citation45–Citation47MST1R GCN was evaluated by qPCR in 19 GEC lines, and then results were validated in selected cell lines, ( and ), by FISH (Cappuzzo methodCitation45), and array Comparative Genomic Hybridization (aCGH, 1X1M Agilent).
GCN in cell lines by qPCR.
High MET, ERBB2 and FGFR2 GCN was confirmed in positive control cell lines, (MET: MKN-45, SNU-5 and Hs746t; ERBB2: NCI-N87; FGFR2: KATO-III and SNU-16), consistent with previous reports of known clustered amplification determined by FISHCitation12 (). GCN of all three genes by qPCR in GC cell lines was validated with aCGH in NCI-N87 (), and by FISH (see below) in NCI-N87, AGS, MKN-45 and Hs746t ( and ). Protein expression as evaluated by IB correlated with GCN; however, decreased MST1R and MET copy numbers of 1 in NCI-N87 did not correlate with protein expression, which was high (). Comparison of FISH and qPCR methods of GCN detection were 92% concordant for all three genes (11/12) in the four cell lines evaluated (qPCR did not identify balanced polysomy of MST1R seen by FISH in Hs746t), and aCGH done in NCI-N87 was 100% concordant with FISH and qPCR results ().
GCN alterations of MET, MST1R and HER2 in four GEC cell lines by FISH.
Alterations in MET gene. Probe hybridization efficiency was confirmed by performing FISH on normal lymphocyte metaphase chromosomes and interphase nuclei using BAC clone RP11-163C9; 7q31.2 (). The mean number of each signal per cell was 2.04. The mean MET:CEP7 ratio was 1.0; 92% of cells showed two copies of each signal. The scoring efficiency was confirmed by performing FISH on gastric cancer cell lines with known MET amplification status detected previously using various methods.Citation12,Citation48,Citation49
The results of our analysis are presented in . As expected,Citation12 MKN-45 cells were amplified for MET (mean MET per cell = 25.7, ratio = 4.5) and polysomic for chromosome 7 (mean CEP7 per cell was 5.7) (, top left). In addition, further analysis of metaphase preparations revealed the occurrence of numerous copies of derivatives of chromosome 7 with either loss of MET signals or MET duplications and translocations on different chromosomes, similar to as described for the clonal line derived from MKN-45 called GTL-16.Citation50,Citation51
We also confirmed that the NCI-87 cell line is MET-non-amplified and is disomic for chromosome 7,Citation12 (, top right). Moreover, we detect MET:CEP7 ratio 0.53 as a result of loss of one MET signal as part of the deletion of the chromosomal segment on 7q leading to the chromosome 7 derivative.
As expected, AGS cells were MET-non-amplified with a normal two copies of each signal per cell and normal 1.02 ratio of MET:CEP7 (, bottom left). Previously, using qPCR, SNP and FISH arraysCitation12,Citation48,Citation52 the gastric cancer cell line Hs746t was described as having MET amplification, while detailed FISH scoring results and images were not presented. Here we showed, however, that this cell line does not carry true MET amplification (mean MET/cell = 3.63; mean CEP7/cell = 2.92; MET:CEP7 ratio = 1.24). Yet, because approximately 57% of cells showed four and more copies of MET per cell (high polysomy), we classified Hs746T cells as FISH+.
Alterations in MST1R (RON) gene by FISH. To detect the MST1R gene, the size of which is only 16.9 kb, we used two overlapping fosmids WI2-1337B15 and WI2-1244I5 combination of which contains the full-length of MST1R DNA (). Visualization of the FISH probe made for this small gene is a challenge, particularly when performed on FFPE tissue sections. Therefore, in addition to fosmids, we labeled DNA from BAC clone RP11-915H6 as a control probe for MST1R FISH. Since RP11-915H6 and all other most appropriate and available BAC clones spanning this region cover a significant number of neighboring genes around the MST1R locus as compared to WI2-1337B15 and WI2-1244I5 fosmids, and because the probe generated from the combination of these two fosmids gave adequate bright signals, results of RP11-915H6 FISH were omitted here and will be presented elsewhere. Efficiency of the dual probe hybridization was confirmed by FISH on normal lymphocyte metaphase chromosomes and interphase nuclei (). The mean number of MST1R and CEP3 signals per cell was 2.07 and 2.06 respectively. The mean MST1R:CEP3 ratio was 1.0, and 94% of cells showed two copies of each signal.
In MKN-45 cells, both MST1R and CEP3 signals show classical examples of balanced trisomy in 82% of cells. The mean number of MST1R and CEP3 signals per cell was 3.09 and 3.10 respectively; the mean MST1R:CEP3 ratio was 1.0. Strikingly, the pattern of MST1R copy number alterations in the other three cell lines, NCI-N87, AGS and Hs746t, was similar to those of MET alterations in these cells described above. In particular, NCI-87 cells were MST1R FISH− and disomic for chromosome 7 with MST1R:CEP3 ratio of 0.52 because of deletion of one copy of MST1R gene (). MST1R FISH in AGS cells revealed two presumably normal copies of each signal in 89% of cells (balanced disomy). Finally, as was observed for MET, no true amplification was detected (MST1R/cell = 3.5, CEP3/cell = 3.85, MST1R:CEP3 = 0.91), but Hs746t cells were classified as MST1R FISH+ because of high polysomy (balanced tetrasomy) present for both MST1R and chromosome 3 in more then 45% of cells ( and Hs746t insert). In addition, we detected 3MST1R to 4CEP3 in 29% of cells due to loss of one copy of MST1R and formation of chromosome 3 derivative, probably, as a secondary event to the tetrasomy event. Thus, for both MET and MST1R genes, Hs746t cells were classified as FISH+. Complex genomic heterogeneity and aberrations detected in Hs746t cells were matched to the description of this cell line by ATCC (HTB-135; www.atcc.org).
Alterations in HER2 (ERBB2) gene by FISH. HER2:CEP17 FISH conducted here confirmed findings of other investigators that NCI-N87cells were highly HER2-amplified, and MKN-45 and AGS cells were HER2 non-amplifiedCitation53,Citation54 (). However, here for the first time, we described HER2:CEP17 FISH in Hs746t cells. We found that while Hs746t cells were non-amplified, they represent a classical example of cells with trisomy for HER2 and chromosome 17 (balanced trisomy). Three HER2 and three CEP17 signals were detected in the majority of cells (87%) and resulted in the mean HER2:CEP17 ratio of 1.01 (mean HER2/cell = 3.17; mean CEP17/cell = 3.15).
In summary, MET was FISH+ in MKN-45 and Hs746t cells (amplified and highly polysomic, respectively) and FISH− in NCI-N87 and AGS cells, whereas MST1R was FISH+ in Hs746t cells (highly polysomic) and FISH− in three other cell lines (balanced trisomy in MKN-45) (). The detected similarity in GCN alterations in NCI-N87, AGS and Hs746T gastric cancer cell lines analyzed here may suggest non-incidental occurrence in aberrations of MET and MST1R genes, in contrast to HER2 GCN alterations. HER2 was FISH+ (amplified) only in NCI-N87 cells. Copy number of all three genes and corresponding chromosomes in AGS cells showed comparable to normal pattern, matching to the near-diploid description of this cell line by ATCC (CRL-1739; www.atcc.org).
GCN alterations of MST1R, MET and HER2 in three FFPE GEC tissues by FISH.
To verify the efficiency of home-brewed MET and MST1R probes in formalin fixed and paraffin embedded (FFPE) human gastric cancer sections and to compare GCN FISH results with those of quantitative polymerase chain reaction (qPCR) and array comparative genomic hybridization (aCGH) assays, we performed a pilot FISH study of three randomly selected gastric cancer cases from the cohort of tumors with defined status of GCN detected by these two methods. Results are presented in . All three tumors showed MET copy number gain and were classified as MET FISH positive (FISH+). Of them, one tumor had high amplification with mean MET:CEP7 ratio of 14.93, and immunohistochemistry confirmed high expression [ (lane 1, #1 MET) and (lane 2, #2 p-MET)]. The other two tumors were categorized as having high polysomy. The proportion of cells with ≥4 MET copies was 87 and 45% in these cases.
Interestingly, similar to MET, GCN alterations were found in the MST1R gene. In particular, all three cases showed MST1R copy number gain, and two of three cases were classified as FISH+ as a result of MST1R high polysomy detected in more then 40% of cells. According to the HER2 FISH classification system, none of these three cases were HER2-amplified, thus were FISH−.
These results were compared with qPCR results in these three tissues. FISH ( and ) and aCGH ( and H) both confirmed high GCN in tissue samples with 67% (4/6) concordance between qPCR and FISH for MST1R and MET () where neither qPCR nor aCGH identified balanced polysomy of MET seen by FISH in p44; and a gain of MST1R seen by qPCR was not detected by aCGH or FISH in p44. For MST1R, none of the three tissue samples evaluated by FISH showed clustered gene amplification or a gene/CEP ratio >1.8, but rather the high GCN was reflective of high polysomy (≥ four copies of the gene in ≥40% cells, ). ERBB2 FISH was subjected to standard scoring methods, which considers high polysomy (four to six mean copies/cell) to be FISH equivocal, and therefore results were less consistent with qPCR results. When ERBB2 was scored in a similar manner to MST1R and MET, results became more concordant between the three modalities.
GCN of human tumors by qPCR.
Given the relative concordance with FISH data and qPCR in the three samples, DNA from GEC human tissue samples and adjacent grossly normal tissue and paraneoplastic tissue was then evaluated by highthroughput qPCR ( and ). Of 45 cancer tissues available for analysis, high GCN was as follows: MST1R 36% (16/45), ERBB2 29% (13/45), MET 6.7% (3/45), FGFR2 6.7% (3/45) and GCN co-elevation was frequent ( and N = 53; 45 tissue + 8 GC cell lines). IHC protein expression of RON, MET and their phosphorylated forms correlated with MST1R and MET GCN status by qPCR ( and ). Next we analyzed the association between MST1R and MET GCN alteration detected by qPCR with patient outcome. MST1R and MET GCN co-elevation was associated with worse OS compared to MST1R and MET normal copy number (median 6 vs. >70 months, p = 0.009) ().
SMAD4, which is frequently deleted in cancer and associated with increased RON expression,Citation55 had a GCN by qPCR of 1.35 or less in 26% of samples (14/53; five cell lines and nine tissues); decreased SMAD4 copy number did not occur in the setting of high MST1R GCN (). As in the cell lines, we observed that the pattern of copy number alterations in MST1R was frequently parallel to those detected for MET.
Together, these data reveal that high MST1R GCN is frequent in GEC and is due, based on our analysis to date, to polysomy as determined by FISH. High GCN correlated with high protein expression by IHC and IB ( and ). MST1R was often co-elevated with MET and/or ERBB2 and, importantly, MST1R GCN was prognostic of OS in our GEC cohort.
MST1R mutational analysis in GEC.
To screen for gene mutations, DNA from fresh frozen tissue was extracted from nine tumors and their adjacent grossly normal tissue (; and F). Complete DNA gene sequencing of these nine tumor samples for MST1R and MET revealed one sample [ (patient 1, left) and (A and C)] with a novel heterozygous missense change (R1018G) in MST1R exon 13 juxtamembrane (JM) domain, which was also found in the paired adjacent grossly normal but histologically metaplastic tissue. Although unclear if this change in the patient was somatic or germline (completely histologically normal tissue was unavailable for this case), the novelty of this undocumented heterozygous change in the normal HAPMAP database (see Materials and Methods) led to targeted sequencing of the remainder of FFPE tumor tissues, which exhibited 11% (6/53; 1/9 frozen, 5/36 FFPE, 0/8 cell lines) of samples containing this heterozygous change [ (patient 2, right) and ]. In one patient, the primary tumor and metastatic lymph node samples revealed wild-type sequence A/A, whereas the liver metastasis had the somatic mutation A/G (, patient 2, right). To further evaluate implications of this mutation, examination using ProphylerER revealed that this position was a highly conserved DpYR motif across a number of receptors and species (). Additionally, previous reports in the homologous position of MET (R1004) demonstrated this motif as being critical for membrane receptor binding and degradation by CBL ubiquitination—and site-directed mutagenesis led to increased MET expression.Citation56 Furthermore, using CanPredict, this change resulted in a SIFT score of 0 (intolerant) and GOSS score of 11.16 (consistent with cancer variant), in silico (see Materials & Methods).
To evaluate the incidence of mutant Kras in our sample set, Kras codon 12/13 mutations were confirmed in previously described mutant GEC and lung cancer cell lines (AGS, Snu-1, A549) but no mutations (codon 12/13 or 61) were found in any of the tumor samples. No MET mutations were found in this cohort analysis. These data suggest that Kras and MET mutations are infrequent in GEC, while a novel MST1R JM mutation at the conserved binding site of c-CBL occurs in approximately 10% of cases, posing a likely mechanism for RON overexpression in this subset of tumors. A larger cohort of samples is being screened for this mutation and confirmatory functional analyses are ongoing.
MST1R germline SNPs that are more prevalent in normal Asians are more frequently observed in “European” tumor samples than in European Hapmap normal samples. To evaluate single nucleotide polymorphism (SNP) frequency differences across normal ethnic populations, we previously performed a comprehensive computational analysis to identify kinases and their ligands containing SNPs with significant differential ethnic frequencies (eSNPs) in the human kinome across the three normal HAPMAP populations (JPT/CHB, CEU and YRI).Citation57 exhibits the MST1R, MET, MST1 (MSP) and HGF eSNPs from that study. MST1 did not have any eSNPs. One HGF eSNP, rs5745635 (EXON 3 synonymous), was seen in the YRI African population. MET and MST1R both had eSNPs among YRI/CEU (European/Caucasian) and JPT/CHB (Asian) populations. MET had three exonic eSNPs: rs41736 (EXON 20 synonymous), rs2023748 (EXON 21 synonymous) and rs41737 (EXON 21 synonymous); 27 MET eSNPs were intronic (n = 19) and within 10 kb of the gene (n = 8). MST1R had two exonic eSNPs: rs2230590 (EXON 4 missense A/G Gln/Arg, GOSS 11.16, SIFT 0.41) and rs1062633 (EXON 20 missense A/G Gln/Arg, GOSS 11.16, SIFT 0.06); three other eSNPs were identified in introns (n = 1, rs7627864) and within 10 kb of the gene (n = 2).
Given the higher GEC incidences in Asians as compared to Europeans/North Americans, we sought to determine if MST1R eSNP alleles/genotypes that are more prevalent in Asians are associated with GEC incidence. We therefore hypothesized that Asian eSNP alleles/genotypes may be more prevalent in Caucasian tumors than in Caucasian normals. We analyzed the two exonic MST1R missense eSNPs (rs2230590, rs1062633) and one intronic eSNP (rs7627864) across 36 tumor tissues and eight cell lines (). This revealed a discordant frequency (genotype and allele) in the Caucasian cancer cohort as compared to Caucasian normal HAPMAP frequencies (p < 0.03), particularly the exon 20 rs1062633 (p = 0.01) ( and ). These preliminary findings suggest that a prevalence of Asian eSNPs in European GEC patients may exist and that these germline eSNPs may predispose this cohort to GEC.
RON and MET function, signaling and inhibition.
RON-mediated aggressive phenotypes were enhanced with MET co-activation; aggressive phenotypes were abrogated optimally when RON blocking antibodies were combined with MET blocking antibodies. To understand potential cross-talk and synergy between the RON and MET pathways, GEC cell lines were exposed to various growth factor conditions with or without RON and/or MET blocking antibodies to evaluate the effect on cell cycle and apoptosis ( and ) and viability (, and ). When AGS, having high RON and moderate MET expression () and normal gene copy numbers () was exposed to combined MSP and HGF, a higher percentage of cells were seen in S and G2 phases and less in sub-G1 in comparison to either growth factor alone ( and ). Apoptosis was optimal when combining both RON and MET blocking antibodies versus either alone, by cell cycle analysis (sub-G1) and independent evaluation by Annexin-V assay (, B and ). phospho-Tyrosine (p-Tyr) IB revealed a time-dependent response to MSP exposure in GEC lines () and also a dose-dependent response (data not shown). Global p-Tyr and RON, MET and STAT3 phosphorylation was strongest as detected by densitometry when exposed to both MSP and HGF combined (, D and ). Biochemical evidence of MSP-RON signaling disruption in AGS was observed, completely abrogating p-RON and downstream p-AKT in the presence of novel extracellular RON blocking antibodies (, bottom left). Similar trends were seen in MKN-45, showing optimal inhibition of viability with both RON and MET blocking antibodies (). Transwell migration assay showed a decreased motogenic response of cells optimally in the presence of both inhibiting antibodies, versus either antibody alone (). Taken together, these data suggest that maximal pro-tumorigenic signaling is achieved when both pathways are engaged, and that therapeutic blocking of both RON and MET pathways in GEC achieved optimal anti-tumorigenic effect.
SU11274 abrogated cancer phenotypes, inhibiting both RON and MET signaling. To evaluate the effect on viability, cells were treated with the small molecule MET kinase inhibitor SU11274.Citation41 SU11274 decreased viability of GEC cell lines ( and ). MET amplified MKN-45 () exhibited a lower IC50 than the other non-MET amplified lines. Biochemical evidence of MKN-45 cell lysates revealed that even at low doses (0.2 uM), both HGF-MET and MSP-RON signaling axes were inhibited (, left). In contrast ERBB2 amplified NCI-N87 showed an IC50 of 17.5 uM and did not have a significant decrease in p-RON or p-MET with SU11274 at 2 uM (, middle). These data revealed, first, that although MET amplified tumors have constitutive activation due to MET overexpression, they are still responsive to growth factor stimulation with either HGF or MSP, and optimally in the presence of both. Second, in addition to known abrogation of HGF-MET signaling, SU11274 inhibited the observed MSP induced RON signaling in MKN-45 cells [ (right) and D (left)]. This suggests that SU11274 inhibits both MET signaling (both constitutive signaling due to MET overexpression from gene amplification, and HGF induced signaling) and MSP induced RON signaling at similar nanomolar dose levels in MKN-45.
Combination of SU11274 and pimozide synergistically abrogated viability. STAT3 was activated upon RON and/or MET stimulation ( and D). Treatment with the STAT3/5 inhibitor, pimozide,Citation58 led to decreased viability of cell lines, notably AGS; the combination of SU11274 with pimozide was synergistic in MKN-45 and NCI-N87 as indicated in isobolograms with combination indices at ED50 and ED75 <1 [ (left) and ]. Biochemical evidence revealed decreased p-STAT3 in NCI-N87 cells treated with pimozide over controls (, right).
Combined chemotherapy and SU11274 synergistically inhibited viability. To evaluate the effect of RON and MET inhibition combined with chemotherapy, GEC cells were treated with SU11274 (given our findings of dual inhibition of both RON and MET receptors with this drug) and/or oxaliplatin chemotherapy, resulting in a synergistic decrease in viability as indicated in isobolograms and combination indices at ED50 and ED75 <1 [, (right) and ]. Our in vitro study suggests that enhanced cell kill can be achieved in GEC cells more effectively by using the RON and MET inhibitor SU11274 combined with oxaliplatin chemotherapy, versus either inhibition strategy alone.
Combined siRNA knockdown of RON and MET inhibited signaling feedback loops and led to optimal anti-tumorigenic effect. To directly address the role of redundancy and resistance between RON and MET signaling axes in cell lines, we assessed the effect of siRNA knockdown of RON, MET or both ( and ). In AGS cells (Kras mutant, adherent) wound migration was inhibited with RON or MET protein knockdown alone (not significant), but was optimal with knockdown of both proteins simultaneously p = 0.0042 (). Similarly, apoptosis was highest in the setting of dual MET and RON protein knockdown with 28.05% of cells in early and late apoptosis (bottom right and top right, respectively), versus either alone (MET-19.58%; RON-25.76%) () although the apoptotic effect appeared to be a predominantly RON-mediated event which is consistent with previous reports in reference Citation59. Negative control, Snu-1, did not show any difference in viability or apoptosis (negative for RON and MET expression) with siRNA RON and MET assays compared to scrambled siRNA control (data not shown). Baseline levels of RTKs and STAT3 were evaluated by IB in various GEC and lung cancer lines (, top left); MET and RON expression levels appear slightly different due to difference in exposure time compared to for cell lines that are present in both blots, however relative expression patterns persisted. Biochemical analysis of AGS from days 3–6 post-siRNA transfection revealed a feedback loop upon knockdown of either RON or MET alone that resulted in a reciprocal increase in expression of the other receptor, most evident with MET knockdown and resulting increased RON expression (, bottom left). With dual siRNA knockdown however, expression of both receptors was significantly and optimally decreased. Kras mutated A549 (lung) and ERBB2 amplified NCI-N87 lines showed similar results (), again most evident with increased RON expression in the setting of MET knockdown in A549. Expression of other receptor tyrosine kinases, including HER2, was not affected in this feedback loop in GEC. EGFR expression was increased upon knockdown of MET and/or RON in the lung cancer cell line A549. These data provide proof of concept that for GEC, RON and MET redundant signaling and functional reciprocity can adjust for, in a matter of days, removal of the other receptor through a negative feedback loop, but that this phenomenon can be overcome with simultaneous neutralization of both receptors, without effect on unrelated receptors like HER2.
To evaluate the effect of RON knockdown with an alternate gene silencing strategy, an AGS inducible shRNA line was generated in which the shRNA is controlled by a doxycycline responsive promoter. We observed that this cell line formed fewer colonies in soft agar and showed decreased proliferation as compared with the scrambled shRNA control line; however, colony formation was not dependent on the presence of MSP, suggesting RON was signaling in a ligand-independent manner to promote growth ( and E). RT-qPCR and IB confirmed decreased mRNA and protein expression of RON upon shRNA activation in this model, respectively, as compared to control ( and G). MET expression increased upon knockdown of RON with transient siRNA RON infection in wild-type AGS and in the AGS RON shRNA line ().
Immunofluorescent detection of RON, MET, p-RON and p-MET, E-cadherin and vimentin in AGS cells under varying growth and inhibitory conditions. To determine cellular spatial expression of RON, MET, p-RON and p-MET in AGS cells upon exposure to growth factors and inhibitors, proteins were labeled by IF and were analyzed by confocal microscopy immunofluorescence (IF) along with total internal reflection fluorescence (TIRF) and high resolution stimulated emission depletion (STED) imaging (–). RON (red) and MET (green) were both distributed diffusely at the membrane, cytoplasm and nucleus of AGS cells, as evaluated by C-terminal antibodies; RON and MET co-expression was evident in the merged image (yellow) (, and ). The extracellular N-terminal RON antibody (Biogen, green) revealed membranous expression in a reticular pattern (, and ) that was confined to the cell membrane as detected by XZY axis STED imaging (). Activated p-RON (red) revealed focal membranous and stippled cytoplasmic staining as well as diffuse nuclear staining (, D, and ), consistent with staining patterns visualized by IHC (), and was particularly intense in multinucleate dividing cells ( and E) and at the cell membrane as visualized by TIRF (). p-RON (red) was optimally inhibited with both RON and MET blocking antibodies versus either alone after exposure to both MSP and HGF () with the appearance of more apoptotic bodies than with either antibody alone or versus corresponding controls (). This suggests that HGF induced MET activation resulted in trans-phosphorylation of RON, leading to RON blocking antibody resistance when used alone, but that this was overcome with simultaneous MET blocking antibody inhibition.
To evaluate protein expression patterns in the AGS inducible RON shRNA line and the scrambled shRNA control, we evaluated IF after 9 days of doxycycline exposure in 10% FBS (). RON expression clearly decreased to <50% in the RON shRNA line, both using the RON beta intracellular antibody (red) and the extracellular antibody (green). Similarly, p-RON and p-STAT3 (red) were decreased in the RON shRNA line. Conversely, MET expression (green) was increased to greater than 50% in the RON shRNA line. p-MET expression was increased over the scrambled shRNA control. Finally, to determine the effect on epithelial-mesenchymal transition (EMT), E-cadherin and vimentin expression was evaluated (), revealing a striking increase in E-Cadherin >100% and a decrease in vimentin expression >76% in the RON shRNA line over control. Collectively, these IF data corroborate our findings that RON and MET are co-expressed at the membrane, cytoplasm and nucleus, and that their activation by growth factors is optimally abrogated by dual RON and MET inhibition. RON protein knockdown results in a mesenchymal to epithelial conversion, but also a reactive reciprocal increase in MET expression.
Discussion
In this report, we have characterized the expression, gene alteration and inhibition of the RON and MET signaling axes in GEC cell lines and human GEC tissues that had curative intent surgery. These studies revealed that expression of these proteins is minimal in normal GEC mucosa. In contrast, both receptors and their ligands are expressed at higher levels in precursor lesions of metaplasia and Barrett's esophagus, with increasing expression upon progression to invasive adenocarcinoma. RON highly expressing tumors (74%) and particularly those with both RON and MET (43%), had a worse overall survival, irrespective of tumor stage. This result is similar to the recent observation that RON expression was an independent predictor of decreased survival and early relapses in node-negative breast cancer patients.Citation35 Overall, these findings suggest that in addition to advanced tumor stage, early stage tumors with high RON and/or MET expression do poorly. One may speculate that these patients would benefit from a more aggressive therapeutic approach, either with chemotherapy in early stage disease where it is not routinely used, or, by adding RON-MET targeted inhibition to standard neoadjuvant and/or adjuvant perioperative care. A limitation to these exploratory analyses is the patient cohort heterogeneity with respect to their perioperative treatment, which included chemotherapy or chemoradiotherapy before and/or after surgery, or surgery alone. Thus, the prognostic implications derived from our patient cohort should be evaluated further in a prospective manner in a uniformly treated and adequately powered patient population.
The autocrine and paracrine secretion of MSP and HGF has been defined in tumors and mesenchymal tissues,Citation60–Citation62 and we evaluated MSP for the first time to our knowledge in tissue samples by IHC. Both MSP and HGF were overexpressed in GEC tumor compared to normal, and we confirmed mRNA production and protein expression in GEC cell lines. Snu-1, having minimal RON or MET expression, had high mRNA and protein levels of both MSP and HGF. One hypothesis is that this cell line, derived from ascites fluid, may have been involved in a tumor-stroma co-existence, secreting MSP/HGF in a paracrine fashion to nearby stromal components such as macrophages or fibroblasts that expressed RON and MET. The other cell lines expressed both receptors, suggesting an autocrine loop in these cases.
The mechanism of RON receptor overexpression in GEC remains to be fully elucidated; there are several proposed mechanisms of RON overexpression. For example, activation of the HGF-MET axis leads to subsequent increases in RON expression.Citation32 This may explain our findings for MET gene amplified cell lines MKN-45, SNU-5 and H1993 (which have MET overexpression and constitutive activation) that MET siRNA knockdown led to decreased RON expression (data not shown), rather than increased RON expression as observed for non-MET amplified lines. Additionally, it has been reported that loss of tumor suppressor SMAD4 expression contributes to aberrant increases in RON expression.Citation55 We showed frequent SMAD4 copy loss in GEC (28%), which provides a mechanistic explanation for RON overexpression observed in those tumors. Also, RON upregulation as a result of Kras mutation has been suggested in pancreatic cancer;Citation25 however, no Kras mutations were detected in our samples, suggesting that this mechanism is rare in GEC, consistent with previous reports in reference Citation63. Other regulators of RON expression potentially include microRNA, which may play a role in fine tuning RON protein expression, as was shown with MET and miR-34b, miR-34c and miR-199a*, although this has yet to be demonstrated.Citation64 Alternate mRNA splicing and alternate transcription have been described, adding yet another layer of complexity to RON regulation and function.Citation65–Citation67 Furthermore, “gene dosage” or increased MST1R gene copy number (GCN) may correlate with protein expression.
Clustered gene amplification of MET occurs in approximately 5–10% of GEC,Citation10–Citation12 and of ERBB2 in 10–20%.Citation7 However, this is the first report showing increased MST1R copy number in any cancer. Approximately 33% of samples had high MST1R GCN by qPCR, while adjacent normal tissue was significantly lower by qPCR, although not normal in most cases. This may be explained by the limitations of the qPCR technique, which averages the GCN across all cells from the adjacent “normal” sample, and therefore may include contaminating tumor and pre-neoplastic cells within the normal mucosa, potentially leading to an overall slightly increased copy number.
MST1R GCN was co-elevated with ERBB2, MET and/or FGFR2 in approximately half of the high GCN cases (n = 11/21), which may be explained by a global genomic chromosomal instability that leads to selection of a number of amplifications/deletions throughout the genome that contribute to the overall oncogenicity of the cell.Citation68 In support of this phenomenon, evaluation of the whole genome by aCGH of NCI-N87 demonstrated several deletions and gains. It should be noted, however, that MST1R and MET copy numbers are both only 1 in NCI-N87 (confirmed by FISH, qPCR and aCGH), while protein expression is high and functional. Therefore, whereas an increased GCN (both gene amplification and polysomy) tended to predict higher expression patterns (particularly amplification), decreased copy number of one did not alone predict low expression levels, suggesting caution should be used in bioinformatics models that make this assumption based on aCGH genome-wide studies. In addition to aCGH, FISH also demonstrated chromosomal instability in samples. For example, in MKN-45, it was demonstrated to have high polysomy of MST1R and MET as well as clustered amplification of MET. However, we could not confirm that the cell line Hs746t is MET amplified as in Smolen et al. but rather increased GCN by qPCR was due to polysomy when assessed by FISH. Analysis by FISH highlights the limitations of qPCR and aCGH in differentiating elevated GCN due to polysomy versus gene amplification. As such, it should be noted that an elevated GCN for MST1R and MET by qPCR in the three FFPE tissue samples assessed by FISH were actually due to polysomy, except for p9 which had true MET amplification that was heterogeneous and patchy within the tumor specimen. Also, as has been previously described, qPCR often overestimates GCN compared to FISH,Citation46,Citation69,Citation70 and this was seen for MST1R for sample p44. Potential reasons for the discrepancies we observed between qPCR, aCGH and FISH results, include the aforementioned “DNA averaging” and heterogeneity of cells in the sample (heterogeneous tumor, dysplasia, metaplasia and stroma-fibroblasts, leukocytes, etc.) which can significantly influence qPCR and aCGH results. Another includes DNA quality, particularly of FFPE DNA. Additionally, the choice of the control qPCR gene, as well as the control DNA used for competitive hybridization for aCGH may affect results. Any or all of these explanations can account for the increased rate of discordancy between the three modalities that we observed in heterogenous FFPE tissue samples in comparison to relatively homogenous cell lines. Accordingly, of the three FFPE cases with high MST1R and MET GCN by qPCR analyzed by FISH thus far, all had at least MET polysomy but only one case, p9, showed clustered MET gene amplification; of the same three cases showing gain of MST1R by qPCR, two showed high polysomy by FISH. On the other hand, while FISH is most accurate in identifying the true gene copy within the tumor pathohistological architecture, it is laborious and costly. qPCR is a quick method to screen a large number of tumors for copy number aberrations with a potentially acceptable concordancy rate with FISH results.Citation71
Tumor samples confirmed to have high MET and MST1R GCN by FISH revealed that the adjacent histologically normal mucosa were disomic by FISH, supporting the notion that chromosomal instability and the development of polysomy is associated with histologic progression of disease.Citation72 The correlation of histologic tumor progression that we observed with increasing GCN of MST1R and MET through polysomy is consistent with a previous report correlating histologic progression and worse outcome of patients with nonrandom chromosome 3 gain in GEC.Citation72 Tissue p9 showed patchy areas of MET gene amplification that correlated with very high protein expression by IHC in the primary tumor (particularly the invasive front), whereas other areas of tumor only showed high polysomy and lower MET expression levels. Moreover, the metastatic lymph node for this same patient showed MET amplification in all of the tumor cells when evaluated by FISH, again supporting the notion of clonal evolution and selection for metastatic capability. Given the aforementioned tumor heterogeneity resulting in gene amplified and non-gene amplified tumor clones, this must be considered when evaluating MST1R and MET so as to not miss true amplification by FISH in the primary tumor, as previously reported for ERBB2.Citation73,Citation74 In advanced disease, it may be higher yield to evaluate a metastatic lesion(s) to assess for gene amplification of MET and MST1R, as these are the relevant lesions which will ultimately determine clinical outcomes.Citation71 This concept needs further investigation.
Another mechanism for increased protein expression includes the ubiquitin ligase Cbl, which mediates proteasome degradation. Alteration of this molecule's ability to bind to membrane proteins plays a role in the stability and activation of various RTKs, including RON.Citation75 We describe here a novel R1018G mutation, to our knowledge not reported in any normal or malignant tissues to date, in the MST1R exon 13 juxtamembrane (JM) domain containing the conserved Cbl DpYR binding motif that occurred in 6 of 54 samples (11%)—none were observed in cell lines. A previous report defined this conserved motif, through artificial mutation, as a critical binding domain of Cbl initiated degradation of MET.Citation56 This suggests a mechanism for RON upregulation and overexpression in these samples. In one case, the mutation was observed in metaplastic tissue, whereas in another it was observed only in the liver metastasis. Further evaluation is required to determine if this mutation plays a role and is sufficient for tumor initiation and/or if it is more important for tumor progression. Affect of this mutation on inhibition strategies as compared to wild-type MST1R is currently being evaluated.
Multiple RTKs are co-activated in tumors and redundant inputs drive and maintain downstream signaling, thereby limiting the efficacy of therapies targeting single RTKs.Citation76 Combined inhibition of multiple key targets may become an effective strategy to overcome this phenomenon. We observed that MST1R and MET GCN were often co-elevated in patient tissues corresponding with expression by IHC, and that RON and MET co-expression portended a very poor prognosis. We then showed in vitro that co-activation of RON and MET resulted in cooperation, both phenotypically and biochemically in GEC cell lines. Although RON or MET targeted inhibition alone led to decreased aggressive phenotypes over controls, dual receptor inhibition resulted in optimal results particularly when both receptors were engaged. This was observed using combination RON and MET siRNA protein knockdown, or with small molecule tyrosine kinase inhibition with SU11274, or with MET and novel RON specific extracellular blocking antibodies. We have shown that in GEC lines, RON and MET redundant signaling can adjust for, in a matter of days, removal of the other receptor through a feedback loop, but this can be overcome with simultaneous neutralization of both receptors. We observed enhanced protein knockdown of both RON and MET at the same siRNA concentration of 50 nM when combined together versus either alone (with 50 nM of scrambled siRNA). This occurred without effect on the levels of unrelated RTKs such as HER2 and FGFR2. The observed synergy of RON and MET inhibition using SU11274 with concurrent chemotherapy or the STAT3 inhibitor pimozide suggests that future clinical approaches to GEC trial design should consider these combinations to optimize outcomes. In vivo murine models are ongoing to further evaluate these inhibition strategies.
GEC is a lethal malignancy with poor clinical outcomes due to early metastasis and high recurrence rates after curative intent surgery—even in early stage disease.Citation1,Citation6 MET, HER2 and EGFR inhibition is currently being evaluated in early phase clinical trials with modest benefit.Citation5,Citation77 The data presented here reveal that RON is an independently important prognostic marker and therapeutic target in GEC given its strong expression, high GCN and activating JM mutation. Moreover, RON and MET co-expression, redundant cooperative signaling, and functional reciprocity suggest that combined inhibition of RON and MET is paramount to overcome resistance signaling networks of this receptor tyrosine kinase family. Future inhibition strategies will require dual inhibition of both pathways to circumvent signaling synergy and redundancy.
Materials and Methods
Patient tissues, tissue processing, tissue microarray (TMA) construction.
Human gastric and gastroesophageal junction tissue samples were obtained in accordance with the University of Chicago Institutional Review Board-approved protocols (). Overall survival was determined by obtaining the date of death in the social security death index registry in accordance with the protocols, www.ssdi.rootsweb.ancestry.com/, using the patient's full name and last four numbers of their social security for confirmation, and the documented date of diagnosis in the hospital records. A total of 35 formalin fixed paraffin embedded (FFPE) GC tissue samples for immunohistochemistry (36 for gene alteration analyses) were obtained from the University of Chicago (referred to as US cohort) pathology archives from between 2002–2008. When available, lymph node metastases were used from these same patients (n = 17) and liver metastasis in one case. A GEJ TMA prepared at the University of Chicago contained a total of 23 cases, with 176 cores from various areas of these tissues containing 44 Barrett metaplasia, 38 low grade dysplasia, 76 high grade dysplasia and 16 invasive adenocarcinoma. This TMA had eight control tissues (liver 2, placenta 2, kidney 2 and colon 2). Additionally, a set of fresh frozen (OCT) clinically unlinked samples was analyzed for full gene screening of MST1R and MET mutation (nine paired gastric cancer/paraneoplastic normal, four normal gastric samples from patients without a diagnosed cancer and four chronic gastritis samples without cancer). Finally, a Korean TMA containing 59 GEC samples with linked clinical information and a separate TMA with their 59 adjacent paraneoplastic tissues were obtained courtesy of Dr. Yung-Jue Bang from the Seoul National University Hospital, constructed using Super Bio Chips.
Ethics statement.
All research involving human tissue samples was approved by the University of Chicago Institutional Review Board (IRB) and conducted in accordance with the protocols. Informed consent was obtained in accordance with the tissue procurement protocols.
Immunohistochemistry (IHC).
IHC staining was performed using HRP-labeled dextrose-based polymer complex bound to secondary antibody (DAKO Cytomation, Carpinteria, CA) as previously described in references Citation61 and Citation78. Then, five micron tissue sections were incubated for 1 h at room temperature with the rabbit polyclonal antibodies against c-Met (Zymed, 1:100), p-Met Y1230/4/5 (Biosource, 1:25), RON (Santa Cruz, 1:100), p-RON (Santa Cruz, 1:100), Stat3 (Santa Cruz, 1:100) and rabbit monoclonal antibody against p-Stat3tyr705 #9131 (Cell Signaling, 1:25 dilution). Mouse monoclonal antibody against MSP beta chain (R&D, 1:100 dilution) and goat antibody against HGF (R&D, 1:25 dilution). This step was followed by 30 min incubation with goat anti-rabbit IgG conjugated to a horseradish peroxidase (HRP)-labeled polymer (Envision™+ System, DakoCytomation, Carpinteria, CA). Negative controls were performed by substituting the primary antibody step with non-immune mouse immunoglobulins, as well as RON and p-RON blocking peptide for the RON C20 and p-RON antibodies. A TMA consisting of several tumor types was used as positive control for all antibodies ().
Scoring was performed by an experienced pathologist based on intensity (0 none, 1 low, 2 intermediate, 3 high), blinded to the clinical data, determined based on previous studies and the pathologist's expertise.Citation78 Descriptive patterns such as extensity of tumor (e.g., diffuse versus patchy/focal), cellular localization of staining (membranous, cytoplasmic and nuclear) and tissue localization (invasive front versus central) were documented.
Cell culture and reagents.
The human GC cell lines Hs-746t, KATO-III, NCI-N87, AGS, Snu-1, Snu-5, Snu-16 and esophageal cancer cell lines SKG4, SKG5, T12, TE1, TE3, TE8, Flo, Kyse 110, Kyse 140, Kyse 220, Kyse 520, Kyse 550, HT1080, A549 and H1993 were obtained from the American Type Culture Collection and grown in the recommended media with FBS and standard humidified incubator at 37°C and 5% CO2, unless otherwise noted. MKN-45 was obtained from the DSMZ—The German Collection of Cell Cultures.
Immunoblotting.
Cell lysate preparation, SDS-PAGE and immunoblot analysis was performed as previously described in references Citation61 and Citation78. Immunoblot membranes were probed with antibodies to mouse antiphosphotyrosine 4G10 antibody (1:1,000, Upstate Biotechnology), rabbit anti-pRON pY1238/1239 (1:1,000; Santa Cruz Biotechnology), rabbit antipMET pY1230/1234/1235 (1:1,000; Biosource International), rabbit anti-pSTAT3 pY705 #9131 (1:1,000, Cell Signaling), rabbit anti-pEGFR (1:1,000, Cell Signaling), rabbit anti-RON Beta-chain c-20 (1:1,000, Santa Cruz Biotechnology), rabbit anti-MET c-12 (1:1,000, Santa Cruz Biotechnology), rabbit anti-Axl c-20 (1:500, Santa Cruz Biotechnology) and rabbit anti-STAT3 H190 (1:1,000, Santa Cruz Biotechnology). Detection of β-actin (1:10,000, Sigma) served as loading control.
Assays to detect gene copy number (GCN) alterations.
Quantitative real-time polymerase chain reaction (qPCR). Genomic DNA was obtained from 8 GC and 11 eosphageal cell lines, and 45 GEC tissues (36 FFPE and nine frozen tumor) along with nine paired frozen gastric cancer/paraneoplastic normal, four normal gastric and four chronic gastritis samples from patients without a diagnosed cancer) with the Qiagen (DNeasy) kit. Gene copy number was determined using qPCR, using the ABI 7700 system (Applied Biosystems, Foster City, CA) and the iQ SYBR green PCR kit (Bio-Rad Laboratories) as previously described in reference Citation69. Gene copy was considered increased with at copy number of ≥ seven as previously described in reference Citation12.
Primer sequences were as follows: MET forward 5′-TGC TGA GCC ATG TTG ACT TC-3′, reverse 3′-CTT GTG GGG AGA CTG GAA AA-5′; HGF forward 5′-TTT GCT GCT CTG GGA AGT TT-3′ reverse 3′-GTC TCC ATC TGG GCA TTT GT-5′; MST1R forward 5′-ATC TTG GTC CCT GCT CAC AG-3′ reverse 3′-ATC TTG GTC CCT GCT CAC AG; MSP forward 5′-GGC CTG GGA GGG TAC CTG-3′ and reverse 3′-CGA GAG CTG AGA TCC CTC TG-5′; ERBB2 forward 5′-AAG AGC AAG GGT GTT TGT CC and reverse 3′-TTA GTT GGG TCC CCT TTG TG; FGFR2 forward 5′-CTG GAGCTGGAATGAAAAGC and reverse 3′ TGCCTAGAAACAACCCATCC; SMAD4 forward 5′-CAATGGGCAGAATAGACTGG and reverse 3′-CGC TCA AGC AAT CCT CCT AC. Confirmatory MST1R pairs included forward 5′-GGA AGT CTC AAA GCC TGT GC and reverse 3′-TCC CAT TCC TTG GTC CAA TC and forward 5′-CTT CCA TTT CCA GCT GAA GG and reverse 3′-AGC ACA CCA AAT GAC CAC TG.
Array comparative genomic hybridization (aCGH). Genomic DNA was obtained from the cell line NCI-N87 and formalin fixed paraffin embedded (FFPE) tissues, p9 and p44. As references, normal pooled human lymphocyte DNA (Promega) was used for cell lines and adjacent grossly normal tissue DNA was used for FFPE samples (p9 with p69; p44 with p72; . DNA was labeled according to the respective protocols provided by the manufacturer (Agilent technologies) and co-hybridized to Agilent 1 × 1 M CGH arrays at Argonne Ntl. Lab, Illinois. Slides were scanned and images quantified using Feature Extraction software v10.5 to extract background corrected intensity values. Copy number segments were derived by subsequent analysis with Partek Genomic Suite v6.5.
Fluorescence in situ hybridization (FISH). Dual-color FISH assays were conducted using following probes: MET/CEP7 probe mixture containing homebrewed MET DNA (BAC clone RP11-163C9; 7q31.2) labeled with SpectrumOrange and the SpectrumGreen CEP7 (centromere enumeration probe for chromosome 7); MST1R/CEP3 probe mixture containing homebrewed MST1R (RON) DNA (combination of fosmids WI2-1337B15 and WI2-1244I5 or BAC clone RP11-915H6; 3p21.31) labeled with SpectrumGreen and the SpectrunOrange CEP3; HER2/CEP17 probe mixture and centromere enumeration probes CEP7 and CEP3 were provided by Vysis/Abbott Molecular (Des Plaines, IL). Homebrewed probes were directly labeled using Nick Translation Kit (Vysis/Abbott Molecular) according to manufacturer instructions. Chromosomal mapping and hybridization efficiency for each probe mixture were verified in metaphase spreads of normal peripheral blood lymphocytes. Metaphase cell preparations from normal peripheral blood lymphocytes and from gastric cell lines MKN-45, NCI-N87, AGS and Hs746t were done according to routine protocols.Citation79 For amplified MET, MKN-45 and Hs746t cell lines were used as positive controls and NCI-N87 and AGS cells were used as negative controls.Citation12,Citation48,Citation49,Citation52 For HER2 amplification, NCI-N87 cells were used as positive control and MKN-45 and AGS cells were used as negative control.Citation53,Citation54 In a pilot study of MET, MST1R and HER2 FISH in human GEC, tissue sections from three patients mounted on conventional slides were processed according to Vysis/Abbott Molecular pretreatment protocol for formalin-fixed paraffin-embedded specimens adjusted for gastric epithelia. In all FISH experiments, the hybridization procedure and post-hybridization washes were done as described by Vysis/Abbott Molecular.
FISH results interpretation.
In each specimen, an average of 80 (range, 30–100) well-defined malignant nuclei were scored. The absolute number of each signal, the mean copy number of signal per cell, the ratios MET:CEP7, MST1R:CEP3 and HER:CEP17, and the percentage of cells with given copy number of each signal per cell were calculated. Analysis of GCN alterations in MST1R and MET were performed and cut-off points were applied as previously described for MET, EGFR and IGF1R genes.Citation45,Citation47,Citation80 Interpretation of HER2/CEP17 FISH was performed as previously described for GEC.Citation7,Citation73 To our knowledge, the cut off points for MET FISH-positivity has not yet been standardized; FISH studies of MST1R have not yet being reported. We did not exclude the possibility that in addition to true amplification, increased gene copy number by polysomy (balanced and unbalanced) may be one possible mechanism underlying the protein overexpression of MET and RON. Briefly, tumors (or cell lines) with a MET:CEP7 (or MST1R:CEP3) signal ratio <2 were considered non-amplified, whereas those with a ratio of 2 or greater (or ≥15 copies of MET or MST1R per cells in ≥10% of cells) were considered amplified. The alterations in number of gene signals due to alterations in number of the corresponding chromosome were classified as following: disomy, ≤ two gene copies in more than 90% of cells; trisomy, three gene copies in ≥10% of cells; low polysomy, ≥ four gene copies in ≥10% but less than 40%; high polysomy, ≥four gene copies in ≥40%. FISH positivity (FISH+) was defined by the high number of the copies of MET or MST1R (amplification or high polysomy). Interpretation of HER2:CEP17 FISH was performed according to ASCO-CAP guidelines for breast cancerCitation81 adapted for gastric cancer (Janjigian et al. J Clin Oncol 2010; 28:15), where tumors with HER2:CEP17 signal ratio of >2.2 were considered FISH+ (amplified), those with a ratio <1.8 were FISH− (non-amplified) and tumors with ratios 1.8–2.2 were equivocal for HER2 amplification. Standard criterion for HER2-positivity in GEC (HER2:CEP17 ratio ≥2) was also assessed.Citation73
DNA sequencing and mutational/eSNP analysis.
Eleven PCR primer pairs spanning the entire coding region of MST1R were used to sequence nine OCT frozen GC tissues (). The adjacent “normal” tissues of the surgically resected tumor specimens were identified histopathologically and RON was sequenced as well to differentiate somatic versus germline changes. All mutations/SNPs were confirmed by sequencing in both directions. Exon 13 R1018G was found in one of nine samples and in its adjacent metaplasia; therefore, targeted sequencing of the remaining FFPE tissues was done using the following primer pair: forward 5′-CTT CCT CCC AAC CTG AAT GA and reverse 3′-GTG GTG GAA TCC AGA CCA TC. For eSNP genotyping (see Sup. Materials for details), the following pairs were used: rs1062633 forward 5′-CTT GGG TGG AAA TTG CCT TA reverse 3′-TGG ACG CAC ATT CAT CTC AT; rs7627864 forward 5′-TGC CTT GGG TTT GCT CTT AC and reverse 3′-CTG GCC TGT TGG TCT CAA; rs2230590 forward 5′-ACC CTA GCC TAC TGT GTA CCG and reverse 3′-GAG CCA GGA CAC TCC TTC TG. Mutational in silico analysis was performed at www.cgl.ucsf.edu/Research/genentech/canpredict/index.html for SIFT (Sorts Intolerant From Tolerant) and GOSS Gene Ontology Similarity Score (GOSS) score acquisition of mutations and eSNPs, as well as www.prophyler.org/for amino acid position conservation analysis. Determination of the frequency of the novel R1018G mutation (mRNA 3316A>AG) and eSNP polymorphisms in normal HAPMAP populations was performed at www.ncbi.nlm.nih.gov/SNP/snp_ref.cgi?locusId = 4486.
Growth factor stimulation and signal blocking assay.
To determine the effect of MSP (R&D systems) and/or human recombinant HGF (Calbiochem) stimulation on cell biochemistry, cells were starved overnight then washed with PBS twice. The growth factors were added at varying doses as low as 50 ng/ml (MSP) and 20 ng/ml (HGF). Cell lines were treated for various time periods (0–60 mins) with MSP, HGF or both, and then lysates were obtained. Cells were incubated with anti-RON monoclonal blocking antibodies (Biogen; R&D systems mouse anti human-RON) with or without mouse anti-human HGFR (MET) monoclonal antibody (R&D systems, Abcam AB10681) (10 ug/ml) for 15–30 minutes prior to stimulation with growth factors. Similarly, cells were incubated with the small molecule MET specific inhibitor SU11274 (Pfizer) for varying times (30 min to 24 h) and at varying concentrations prior to stimulation with growth factors.
Odyssey infrared blots were incubated with 1:5,000 fluorescent secondary antibody in the dark in 0.1% Tween-20 in blocking solution: IRDye 800 anti-mouse Molecular Probes (Rockland Immunochemicals, PA) and Alexa Fluor 700 anti-rabbit (Molecular Probes, OR). The molecular marker was SM0671 (Fermentas International Inc., Canada). Images were acquired with the Odyssey infrared imaging system and analyzed by the software program as specified in the Odyssey software manual.
Gene silencing assays.
Small interfering RNA (siRNA) gene silencing studies were performed as previously described in reference Citation78. Four pooled siRNA oligonucleotides targeting RON and MET mRNA were obtained from Dharmacon, Inc., and used according to the instructions of the manufacturer. Scrambled siRNA was used as a control. All studies used a total of 100 nM of siRNA, [e.g., RON (50) + scrambled (50) or MET (50) + RON (50) or scrambled (100)].
AGS RON shRNA knockout (KO) targeting exon 12 and scrambled control lines were generated by transduction with a TRIPZ lentiviral inducible shRNAmir vector using plasmid VSV-G packaging into HEK293T cells. The vector was replication competent only in the HEK293 cells. The constructs were transduced into the AGS cell line and selected with puromycin. Induction of shRNA was achieved with doxycycline 1.5 ug/mL. mRNA knockdown was confirmed by qPCR and protein knockdown by IB ( and G), in the AGS KO line versus the AGS scrambled control line and wild-type AGS line.
Soft agar, transwell and wound migration assays. Soft Agar, Transwell and Wound migration assays were performed as previously described in reference Citation82.
Viability and apoptotic assays. Viability, proliferation and apoptosis by annexinV were determined as previously described in references Citation61 and Citation82.
Flow cytometry. Cell cycle and annexin apoptotic studies were performed as previously described in reference Citation41.
Immunofluorescence.
Immunofluorescence was performed as previously described in reference Citation78. All images were background subtracted and normalized to negative controls using the AF Lite Leica Imaging Software. Total internal reflection fluorescence (TIRF) was performed on the Leica AM TIRF MC and Stimulated Emission Depletion (STED) performed on the Lieca TCS STED CW per the manufacturer's instructions.Citation83,Citation84
Statistical analysis.
Data are expressed as the mean ± SE. For comparison between two groups, Student's t-test (continuous variables) or chi square test (categorical data) was used. For comparing means between > two groups, one-way ANOVA was performed. Spearman's rank-based procedure was used to evaluate correlations. Unless otherwise stated, representative figures reflect the findings in a minimum of n = 3 evaluations. Survival curves were estimated using the Kaplan-Meier method and comparisons of survival rates were performed using a log-rank test as previously described in referemce Citation85. For detailed statistics regarding the association study of MST1R and MET eSNPs, see Supplemental Materials.
Financial Support
This work was supported by a NIH K12 award, an ASCO 2009 Young Investigator Award, Cancer Research Foundation 2010 Young Investigator Award “The Role of RON (MST1R) Receptor Tyrosine Kinase in Gastroesophageal Cancers as a Therapeutic Target,” Amgen Hematology and Oncology Research Fellowship Grant Award 2008 “The Role of RON (MST1R) in gastroesophageal malignancies,” and a CTSA-ITM Core Subsidies Fellow Grant 2009 (to D.V.T.C.); US National Institute of Health grants (5R01CA100750-07, 5R01CA125541-04, 5R01CA129501-03, 3R01CA129501-02S1, 3R01CA125541-03S1 to R.S., 1R21CA140003-01, to R.S., H.L.K., D.V.T.C.); an ACS Professorship Grant and a Basic Research Training Grant in Medical Oncology (NIH/NCI T32 CA009566 to O.O.); an ASCO Translational Research Professorship Award (to E.V.).
Figures and Tables
Figure 1 Expression of MET family receptors and growth factors correlated with histologic progression and overall survival. (A) Representative images showing RON (top) and p-RON (bottom) increasing from minimal to high expression upon progression from normal mucosa to invasive adenocarcinoma. Tumors of both diffuse and intestinal histology are represented. (B) Top row, RON and MET co-expression, shown in three representative samples. Sample #1, (p9, ) demonstrates focal staining of MET compared to RON that occurred in 46% (16/35) of cases. Sample #2 is representative of 37% (13/35) of cases showing diffuse co-staining of both RON and MET. Sample #3 demonstrates MET overexpression in the stromal compartment occurring in 34% of cases (12/35). (B) Bottom rows, representative co-expression of RON, MET, p-RON, p-STAT3, MSP and HGF are demonstrated in two different lymph node (LN) samples, #1 signet ring (SR) and #2 intestinal (Int). LN #1 shows MET and HGF expression in the stromal compartment, while LN #2 reveals MET and HGF expression within the tumor. (C) Clinical correlation of RON (left), MET (middle) or both (right), proteins detected by IHC with overall survival (months) in the American (US) patient cohort, N = 35.
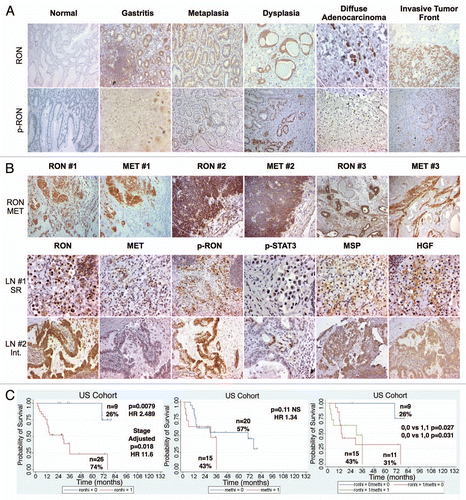
Figure 2 Tissue immunohistochemistry controls. Tissue microarray (TMA) of various tumors were used as controls at 10X unless otherwise indicated. Top row (left to right): RON positive TMA control (+ve Ctrl), RON negative TMA control (−ve Ctrl) with RON blocking peptide 1:1, RON positive control of gastric cancer sample, RON negative control with RON blocking peptide 1:1; second row: p-RON positive control, p-RON negative control with blocking peptide 1:1, p-STAT3, p-STAT3 40X; third row: MET, p-MET, MSP, HGF; bottom row: RON normal liver, RON normal kidney, p-RON normal liver, p-RON normal kidney.
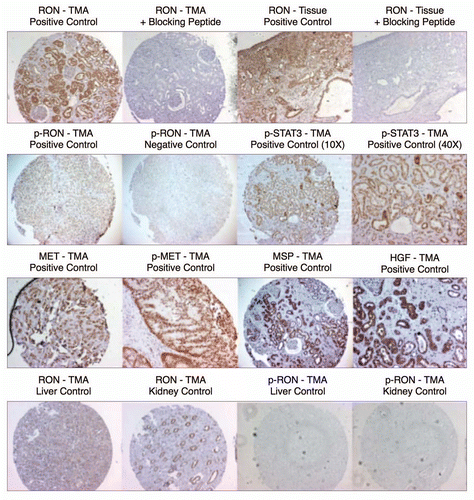
Figure 3 Patient sample clinical correlates. (A) Overall survival by tumor pathological stage (94: 35 American, 59 Korean) that were evaluated by immunohistochemistry and gene copy number. (B) Overall survival by ethnicity.
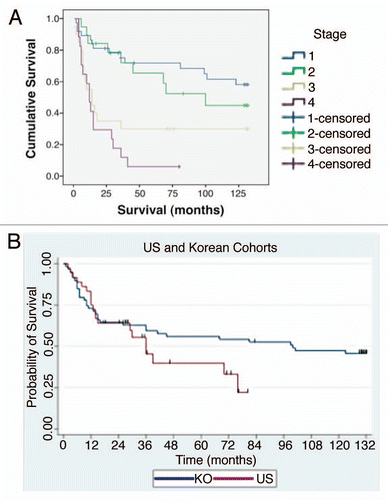
Figure 4 RON, MET, MSP, HGF expression in gastric cancer cell lines. (A) Representative immunoblot (IB) of the eight gastric cancer cell lines for RON, MET, AXL, STAT3 and Paxillin relative to β-Actin loading control. (B) Representative IB of MSP expression. β-Actin loading control (top two rows). RT-PCR of MSP mRNA extracted from the gastric cell lines. RT-PCR of GAPDH mRNA is shown as a loading control (bottom two rows). (C) HGF IB expression and β-Actin loading control (top two rows) and RTPCR of HGF mRNA with GAPDH as loading control (bottom two rows).
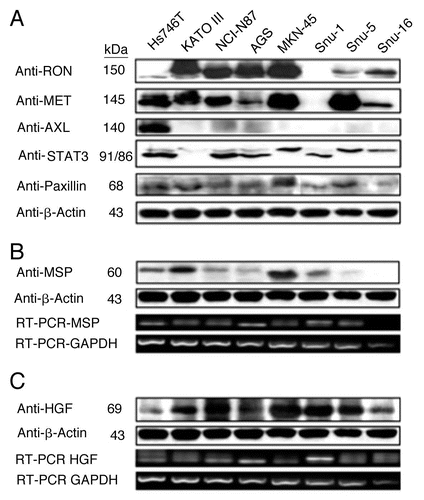
Figure 5 Expression of RON and MET on gastric cancer cell lines. (A) RON membranous expression of Hs-746t, NCI-N87, AGS, Snu-1, Snu-5 and Snu-16 by FACS is in accordance with gastric cancer immunoblot expression shown in . RON specific antibody biogen 101 (blue), control mouse IgG (red). Expression of RON and MET on GEC cell lines. (B) RON membranous expression in cell lines MKN-45, KATO-III and AGS with HT1080 positive control breast cancer line, with starved and 10% FBS conditions. Blue and red, mouse and goat control Ig; orange, MET; green, RON. MET expression is decreased in KATO-III serum compared to starved, while FBS conditions do not have any effect on expression in the other cells. (C) Expression of MET and RON in esophageal cancer cell lines. β-Actin loading control.
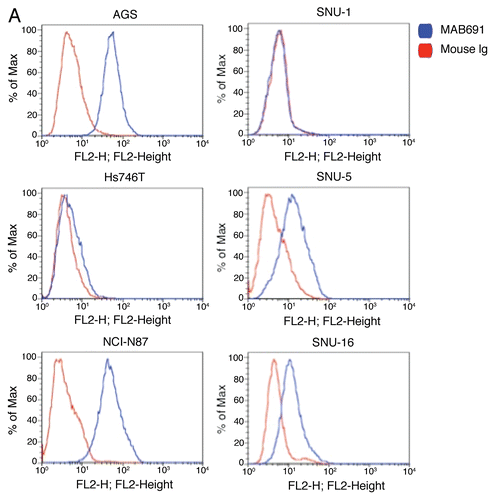
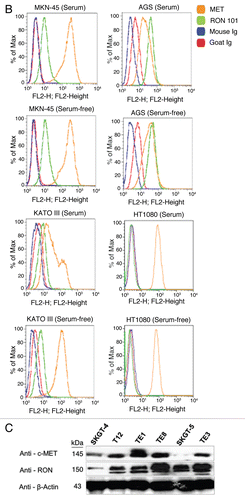
Figure 6 Alterations in gene copy number of MET, MST1R and HER2 in MKN-45, NCI-N87, AGS and Hs746t GEC cell lines detected by FISH (A–E) and aCGH (F–H). (A) Genomic position of BAC RP11-163C9 clone selected for homebrewed MET FISH probe (top) and representative photomicrograph of MET:CEP7 FISH in control cells from normal human lymphocytes (bottom) in metaphase and interphase (insert) are shown. Here and in (B), the MET gene is localized by red fluorescent signals and chromosome 7 centromere (CEP7) is localized by green fluorescent signals. The cells were counterstained with DAPI (blue). Two signals for each probe can be detected on chromosome 7 as a normal pattern. (B) Images of MET:CEP7 FISH in GEC cell lines in metaphase and interphase (inserts) are presented. MKN-45 cells show multiple red signals representing highly amplified and translocated MET copies on three nonhomologous chromosomes (arrow). Five copies of derivative chromosome 7 (der7) with one der7 carrying MET gene are visible. One copy of chromosome 7 with presumably normal MET signal was also detected (arrowhead). In NCI-N87 cells (top right part), one copy of MET and two copies of CEP7 are visible. MET was deleted in 87% of cells. FISH image of AGS cell line (bottom left) depicts two copies of presumably normal MET and CEP7 signals that were detected in 90% of cells. Three copies of chromosome 7 and four copies of MET (one copy translocated to nonhomologous chromosome) represent Hs746t cells (bottom right). (C) Genomic position of BAC RP11-915H6 clone and two fosmid clones WI2-1337B15 and WI2-1244I15 selected for homebrewed MST1R FISH probe are shown (top). Images of MST1R:CEP3 FISH in control normal human lymphocytes in metaphase and interphase (insert) are presented (bottom). The MST1R gene is detected by green fluorescent signals and chromosome 3 centromere (CEP3) is detected by red fluorescent signals. The combination of fosmid clones (bottom left) gave optimal probe size that was specific to MST1R DNA, and gave bright FISH signals comparable to BAC probe signals (bottom right). Normal pattern of two signals for each, MST1R and CEP3 probes can be detected on chromosome 3. (D) Images of MST1R:CEP7 FISH in GEC cell lines in metaphase and interphase (inserts) are presented. MKN-45 cells show three copies of each, MST1R and CEP3 (balanced trisomy; top left). One copy of MST1R and two copies of CEP3 are visible in NCI-N87 cells (top right part). MST1R was deleted in 83% of these cells. AGS cell line carries two copies of each presumably normal MST1R and CEP3 signals (bottom left). Hs746t cells revealed heterogeneous pattern of alterations of MST1R and chromosome 3 signals (bottom right). Image of Hs476t shows cell with balanced tetrasomy for both signals and partial metaphase spread in insert with three MST1R and four CEP3 signals. (E) Images of HER2:CEP17 FISH in GEC cell lines in metaphase and interphase (including inserts in top left and bottom right) are presented. The HER2 gene is localized by red fluorescent signals and chromosome 17 centromere CEP17 is localized by green fluorescent signals. MKN-45 HER2-nonamplified cells show balanced tetrasomy for both signals (top left). NCI-N87 show classical example of true gene amplification forming intact amplicon on one chromosome 17; another, presumably normal chromosome 17, carries one copy of HER2 (top right). On the bottom left, FISH image of AGS cell line depicts two copies of presumably normal HER2 and CEP17 signals. Hs746t cells were HER2 FISH− and show three copies of each HER2 and chromosome 17 (balanced trisomy; bottom right). Correlation of qPCR and aCGH (Agilent 1M array normalized to pooled normal lymphocyte DNA) gene copy number results for NCI-N87. Gene copy number by qPCR are indicated (F). aCGH copy number (blue, deletion; red, gain) See in text for details. (G) Evaluation of genome copy number by aCGH; chromosome 7 results are shown from tumor sample (p9) competitively hybridized with adjacent grossly normal tissue sample (p69) revealing increased MET copy number in the tumor. (H) Evaluation of genome copy number by aCGH; chromosome 3 results are shown of tumor sample (p44) competitively hybridized with adjacent grossly normal tissue sample (p72) revealing increased RON copy number (trisomy) in the tumor, adjacent to a large deleted region.
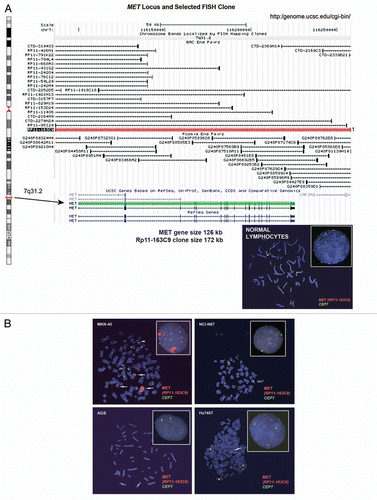
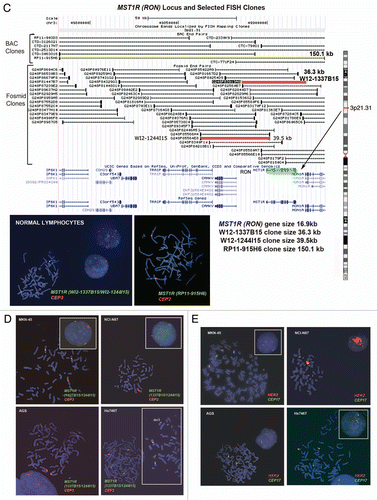
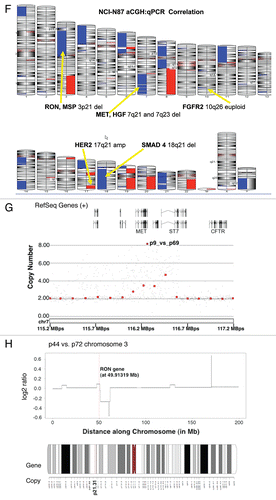
Figure 7 MST1R (RON) gene alteration and correlation with clinical outcome. (A) Venn diagram of qPCR high gene copy number (GCN) of MST1R, MET, ERBB2 (HER2) results for 53 samples (45 GEC tissue and 8 GEC cell lines). (B) Images of three selected samples demonstrating the correlation of protein expression detected by immunohistochemistry (IHC) with GCN alterations detected by qPCR. Sample #1: MST1R high GCN (GCN+) and MET not high (GCN−) (top left); total RON, MET and STAT (top) and phosphorylated (phospho) (bottom). Sample #2 (p9, see ): representative images of MST1R and MET high GCN (top right); p-RON (top) and p-MET (bottom). Sample #3: representative images of MST1R not high GCN paraneoplastic tissue and primary tumor (bottom left), and MST1R high GCN in the metastatic lymph node (LN) (bottom right). (C) Correlation of GCN alterations in MST1R (left), MET (middle), or both (right), with overall survival (months) in the American (US) patient cohort, N = 36. (D) Representative MST1R:CEP3 fluorescence in situ hybridization (FISH) from a selected gastric tumor tissue sample (p26, ), that had showed high MST1R GCN by qPCR (left). Mean MST1R copies per cell was 6.22, mean CEP3 copies per cell was 4.03, the MST1R to CEP3 ratio was 1.54. Tumor showed more than five copies of the MST1R gene (green signal) in more than 40% of tumor cells and was classified as FISH+ due to MST1R high polysomy. The nuclei shown possessed nine copies of MST1R and nine copies of CEP3. RON protein high expression, (right) by immunohistochemistry (40x) correlated with the polysomic FISH scored region (100×). (E) MST1R gene structure with identified R1018G juxtamembrane (JM) domain Exon 13 mutation and the 3 eSNPs (rs2230590, Exon 4; rs1062633, Exon 20; and rs7627864; Intron 19). (F) Patient 1, left: samples that revealed heterozygous R1018G in both paraneoplastic metaplasia (left) and tumor (right). Images showing H&E and RON/P-RON immunohistochemical expression. Patient 2, right: Chromatograms demonstrating the novel MST1R heterozygous R1018G in the exon 13 JM domain. Example of liver metastasis demonstrating a somatic change (A/G) compared to primary tumor and metastatic lymph node (LN) (A/A). (G) Association of MST1R eSNP rs1062633 genotype and allele frequency with European normal versus European tumor samples. HAPMAP normal (nl) genotype N = 90, AA n = 13, AG n = 38, GG n = 39; cancer genotype N = 20, AA n = 8, AG n = 7, GG n = 5. Pearson chi2 = 7.18, p = 0.028. HAPMAP nl allele N = 180, A n = 64, G n = 116; cancer allele N = 40, A n = 23, G n = 17. Pearson Chi2 6.59, p = 0.01. Trend analysis for proportions p > chi2 = 0.0164.
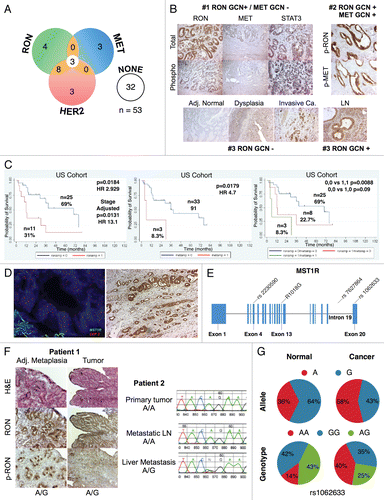
Figure 8 Somatic heterozygous juxtamembrane domain mutation at mRNA position A3316AG, amino acid position R1018G. (A) Mutation position is displayed on exon 13 mRNA position 3,316 (red downward arrow). Indicated change is in the first position of codon AGA (R) to GGA (G) (blue boxes). (B) DYR motif amino acid positions 1,016–1,018 are conserved as depicted here (taken from prophylER analysis). (C) Chromatogram of frozen tissue gastric cancer sample (F6) at genomic position A8415AG, translating into the missense R1018G change.
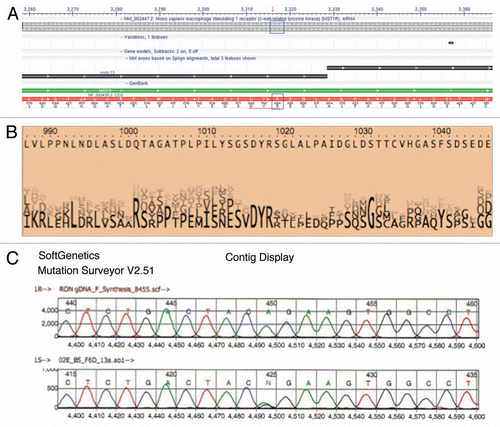
Figure 9 RON function, signaling and inhibition. (A) Left, cell cycle of AGS under selected growth factor and blocking monoclonal antibody combinations. Gated events = 10,000. Right, apoptosis by annexin V (abscissa) and propidium iodide (PI, ordinate) in AGS with selected growth factor and blocking monoclonal antibody combinations. Gated cells = 20,000. (B) Top, immunoblot showing p-Tyr 4G10 and p-RON, p-MET, p-STAT3 relative to loading control with exposure to varying growth factor conditions over time. C, control. Bottom, effect on p-RON and p-AKT (odyssey blot) of pre-incubation with novel extracellular monoclonal RON blocking antibody (R Ab) at varying concentration and MSP exposure versus controls. p-AKT = red, total AKT = green. (C) Top left, viability of GEC lines with SU11274 (black), pimozide (grey) or combination (red). Bottom left, isobolograms demonstrating combination indices at ED50 (red) and ED75 (green). Top right, viability of GEC lines with SU11274 (black), oxaliplatin (grey) or combination (red). Bottom right, isobolograms demonstrating combination indices at ED50 (red) and ED75 (green). (D) Effect of SU11274 inhibition on GEC lines with growth factor combinations (1 minute exposure) on global phosphorylation (p-Tyr 4G10) and p-RON, p-MET, p-STAT3 and p-EGFR relative to loading control for MKN-45 [left, SU11274(0.2 uM)] and NCI-N87 (middle, SU11274 [2 uM]). M, MSP; H, HGF. Right, effect on global phosphorylation (p-Tyr 4G10) and p-STAT3 of treatment with MSP with or without pimozide (12 uM) over time.
![Figure 9 RON function, signaling and inhibition. (A) Left, cell cycle of AGS under selected growth factor and blocking monoclonal antibody combinations. Gated events = 10,000. Right, apoptosis by annexin V (abscissa) and propidium iodide (PI, ordinate) in AGS with selected growth factor and blocking monoclonal antibody combinations. Gated cells = 20,000. (B) Top, immunoblot showing p-Tyr 4G10 and p-RON, p-MET, p-STAT3 relative to loading control with exposure to varying growth factor conditions over time. C, control. Bottom, effect on p-RON and p-AKT (odyssey blot) of pre-incubation with novel extracellular monoclonal RON blocking antibody (R Ab) at varying concentration and MSP exposure versus controls. p-AKT = red, total AKT = green. (C) Top left, viability of GEC lines with SU11274 (black), pimozide (grey) or combination (red). Bottom left, isobolograms demonstrating combination indices at ED50 (red) and ED75 (green). Top right, viability of GEC lines with SU11274 (black), oxaliplatin (grey) or combination (red). Bottom right, isobolograms demonstrating combination indices at ED50 (red) and ED75 (green). (D) Effect of SU11274 inhibition on GEC lines with growth factor combinations (1 minute exposure) on global phosphorylation (p-Tyr 4G10) and p-RON, p-MET, p-STAT3 and p-EGFR relative to loading control for MKN-45 [left, SU11274(0.2 uM)] and NCI-N87 (middle, SU11274 [2 uM]). M, MSP; H, HGF. Right, effect on global phosphorylation (p-Tyr 4G10) and p-STAT3 of treatment with MSP with or without pimozide (12 uM) over time.](/cms/asset/eebc5143-506c-4538-b914-186cb6d187ef/kcbt_a_10915747_f0012.gif)
Figure 10 Cell cycle and apoptosis in AGS wild-type cells. (A and B) Cell cycle as evaluated by flow cytometry (FC) of AGS cells under varying growth factor and blocking antibody combinations are shown. RON102, RON extracellular blocking antibody; MET Ab, MET extracellular blocking antibody; M, MSP; H, HGF. (C and D) Apoptosis was evaluated in AGS cells treated with SU11274 by FC (C) and immonfluorescence (IF) confocal microscopy (D) using Annexin-VFITC and PI near red channels. FC show 30,000 events per condition. Representative IF images are shown at 10×.
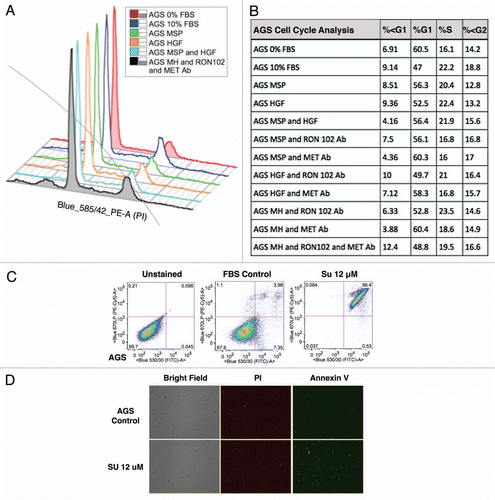
Figure 11 KATO-III p-Tyr immunoblot of stimulation and inhibition. p-Tyr immunblot of KATO-III. (A) p-Tyr immunoblot and RON and MET phospho-antibodies relative to actin loading control upon stimulation with MSP (M), HGF (H) or both at 1 minute, versus starved control (C). MSP 50 ng/mL, HGF 20 ng/mL. (B) p-Tyr immunoblot relative to actin loading control seen after exposure to FBS for 6 hours versus starved control (last lane), under varying inhibitor pre-treatment conditions. Su, Su11274; Met Ab, Met extracellular blocking antibody, 5 ug/mL; RON Ab, RON extracellular blocking antibody 5 ug/mL.
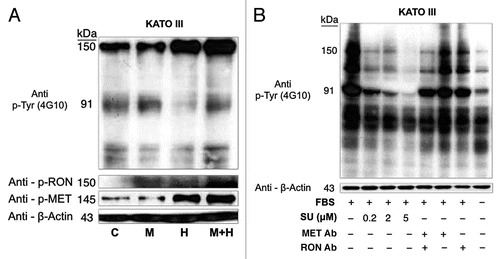
Figure 12 Effect of with growth factors and blocking antibodies on MKN-45 viability. MSP (M 50 ng/ml) and HGF (H, 20 ng/ml) combination resulted in synergistic increase in viability (left group). Preincubation with MET and RON blocking antibodies (MET R&D Ab, RON R&D Ab) together led to optimal abrogation of viability (right group, red) over either blocking antibody alone (second and third groups).
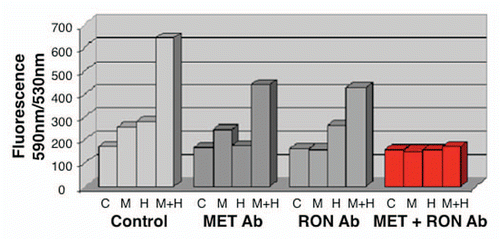
Figure 13 Transwell migration with inhibiting antibodies. Transwell migration is optimally inhibited by the combination of RON and MET blocking antibodies. RON blocking antibody (Biogen Idec) and MET blocking antibody (R&D) combination inhibited AGS transwell migration optimally versus either antibody alone.
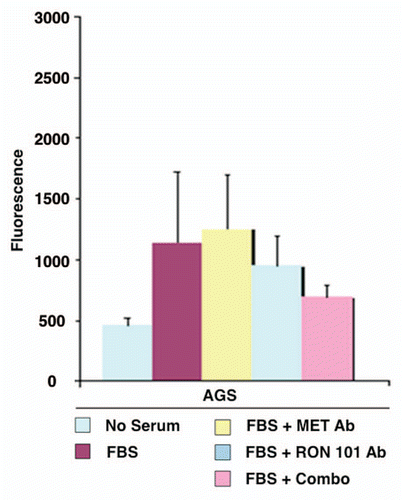
Figure 14 Gastric cancer cell line IC50 tables for in vitro drug viability studies. IC50 (umol/L) of individual drugs and combinations are indicated for AGS, MKN-45 and NCI-N87 for SU11274 and pimozide (A) and SU11274 and oxaliplatin (B). SU, SU11274.
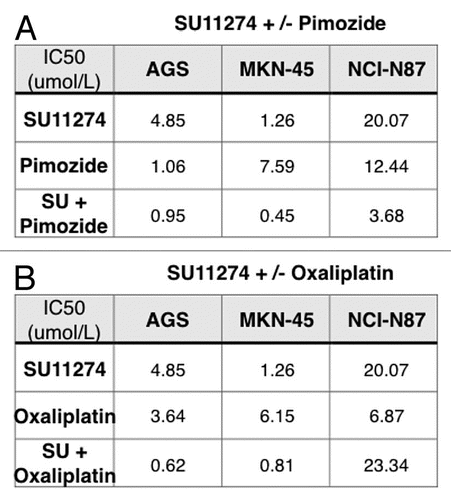
Figure 15 RON siRNA knockdown abrogates malignant phenotypes in GEC optimally with combined MET knockdown. (A) Wound healing assay under siRNA RON, MET or both versus scrambled siRNA control. *p = 0.0042. C = scrambled siRNA control, AGS = wild-type line (B) apoptosis by annexin V (abscissa) and propidium iodide (PI, ordinate) in AGS cells (30,000 events) under siRNA RON, MET or both. (C) Top left, immunblot of cell lines showing HER2, EGFR, RON, MET, FGFR2 and STAT3 expression relative to loading control. Remaining immunoblots show expression of RON, MET, EGFR and HER2 relative to loading control, in the presence of siRNA RON, siRNA MET or siRNA RON and MET combined relative to scrambled siRNA control (Scr) from lysates obtained on days 3 to 5 after siRNA transfection. (D) Soft agar colony formation assay (*p = 0.089, **p = 0.0166, ***p = 0.178) and (E) proliferation, evaluation of an AGS inducible RON knockdown (shRON) line over scrambled shRNA control (shC) line with or without MSP. (p = 0.022 shRON versus shC). (F) Confirmatory mRNA decrease by RT-qPCR of the shRON AGS line over scrambled shRNA (shC) control and AGS wild-type (wt) lines. (G) Representative immunblot showing RON expression of the inducible shRON AGS line after induction with doxycycline and lysates obtained after 9 days and reciprocal increase in MET expression, compared to the inducible scrambled shRNA (shC) control and compared to the wild-type AGS line with no siRNA control (C), scrambled siRNA control (Scr) and siRNA RON (siRON). Significance determined by Student's t-test.
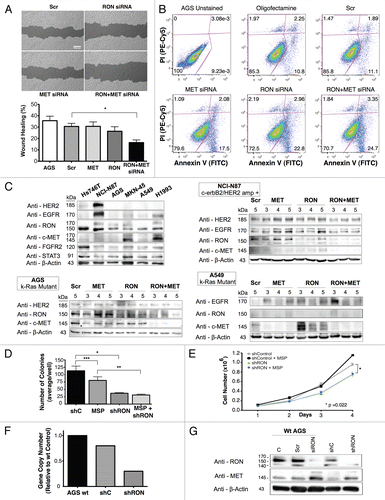
Figure 16 MKN-45 viability siRNA and growth factor studies. Dual RON and MET protein knockdown achieved optimal inhibition of viability and total cellular phophorylation. (A) Growth factor (GF): Control viability ratio of MKN-45 versus siRNA condition. Optimal inhibition is achieved with dual siRNA protein knockdown of both RON and MET over either alone, especially in the presence of both growth factors MSP and HGF. siRNA condition: (1) control, (2) siRNA scrambeled control, (3) siRNA RON, (4) siRNA MET, (5) siRNA RON + MET. siRNA for RON or MET was 50 nMol in each condition. Total concentration was 100 nMol siRNA in each condition (e.g., 3. siRNA RON 50 nmol + scrambled siRNA 50 nmol). (B) p-Tyr immunoblot of MKN-45 lysates under varing siRNA conditions and growth factor combinations (exposure 1 minute). (C) -R, -M, -RM: control, siRNA RON, MET, both, respectively.
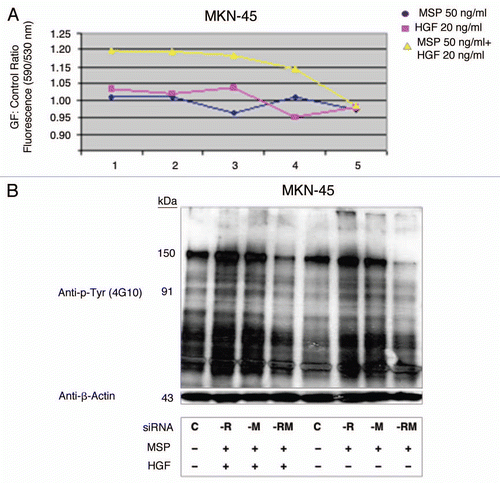
Figure 17 RON, p-RON, MET, p-MET, E-Cadherin and Vimentin immunofluorescence (IF). (A) Wild-type AGS RON (red, c-terminal β-chain) and MET (green, c-terminal β-chain) expression and merged image (yellow). (B) Representative immunohistochemistry images (10× left, 20× right) from two separate gastric cancer tissues displaying stippled p-RON cytoplasmic staining, similar to that seen by IF in 6c. (C) Representative images displaying wild-type AGS with p-RON (red) under varying growth factor and inhibitor combinations. Negative control with secondary rabbit antibody without primary antibody. R Ab, RON blocking antibody; M Ab, MET blocking antibody; SU, SU11274. (D) Inducible shRNA RON knockdown AGS (shRON) and scrambled shRNA control line (shControl) immunofluorescence. First row, intracellular c-terminal RON (red) and c-terminal MET (green). Second row, p-STAT3 (red) and extracellular RON102 (green). Third row, p-RON (red) and p-MET (green). Fourth row, E-cadherin (red) and vimentin (green). All IF fields at 60×, DAPI (blue) and phyloidin (grey).
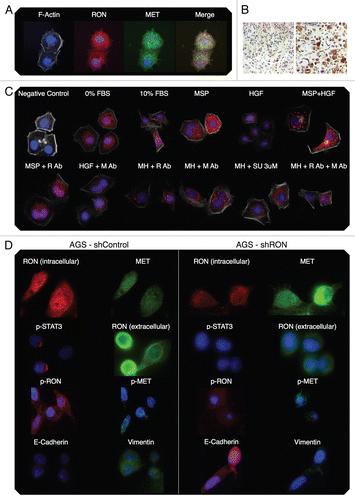
Figure 18 RON, MET, p-RON immunofluorescence and co-localization in wild-type AGS cells in 10% FBS. (A) Representative negative controls with secondary rabbit (red) and mouse (green) alone. (B) MET (green) and RON (RED, c-terminal) and merged image; (C–E) RON (green, extracellular) and p-RON (red) and merged image. (F) RON-MET co-localization indicated in yellow. (G) RON-MET co-localization of image in . (H and I) RON-pRON co-localization indicated in yellow.
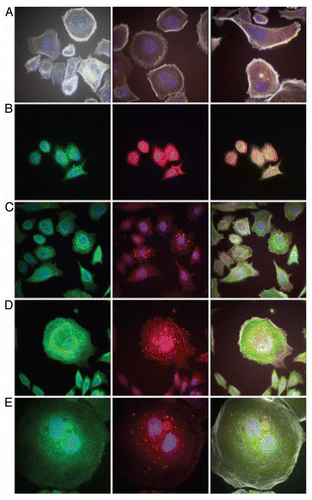
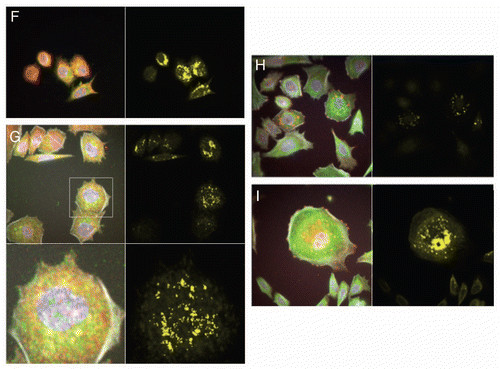
Figure 19 RON, MET, p-RON TIRF and STED imaging. (A and B) XY view (A) of MET (green) and RON (RED, c-terminal) with merged image and (B) cross-sectional XZY view of MET (green) and RON (RED, c-terminal) with merged image below showing diffuse membranous, cytoplasmic and nuclear staining of both receptors. (C and D) XY view, (C) RON (green, extracellular) and p-RON (red) with merged image. Top right, STED image of RON (green) and (D) cross-sectional XZY view of RON extracellular (green) and p-RON (RED, c-terminal) with merged image below, showing the extracellular RON epitope as only membranous staining, while p-RON is diffusely staining in the membrane, cytoplasm and nucleus. (E) Cell in the XY and XZY view F-Actin (green) and p-RON (RED, c-terminal) with merged image. (F) Represnetative images of cells pretreated with RON and MET blocking antibodies combined and then exposed to MSP and HGF with apoptotic bodies (green p-MET, red p-RON, yellow F-Actin). (G) TIRF imaging at 150 nm depth of extracellular RON (green) and p-RON (red) with DAPI (blue), with larger images of RON and p-RON below of cells in 10% FBS. (H) Representative TIRF image of a multinucleate cell in 10% FBS at varying depths (110 nm top, 150 nm middle, 200 nm top); and (I) RON (green, extracellular), p-RON (red) and DAPI (blue) of this cell at 250 nm depth. (J) Representative TIRF image of a multinucleate cell exposed to MSP and HGF and larger merged image below. F-Actin (green), p-RON (red) and DAPI (blue). All cells in 10% FBS except where indicated in (F and J).
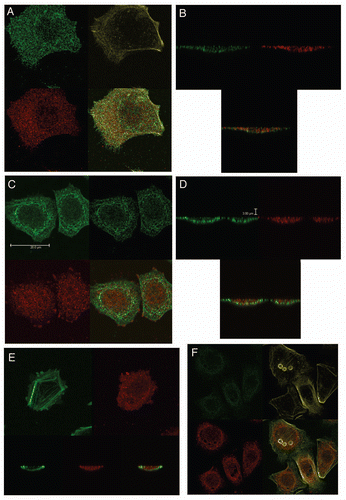
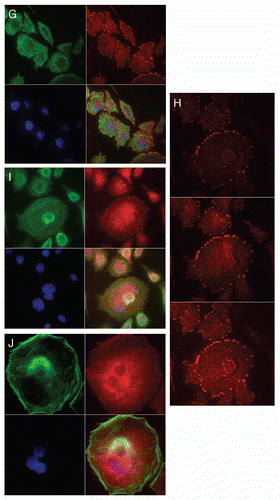
Table 1 Catalog of tissues used for immunhistochemistry studies
Table 2 Gene copy number (GCN) alterations of MET, MST1R, HER2 in GEC cell lines and FFPE GEC tissues detected by qPCR, aCGH and FISH
Table 3 Gene copy number by qPCR
Table 4 RON/MET/MSP/HGF HAPMAP eSNPs, frequencies and tumor eSNP frequency by ethnicity
Additional material
Download Zip (231.8 KB)Acknowledgments
We thank H. Golomb for continued support of this work; V. Bindokas (Microscope Core Facility), S. Nandi, E. Posadas, B. Ferguson, R. Jagadeeswaran, S. Longanathan, L. Faoro, A. Noffsinger, A. Salama, T. Gangadhar, H. Ahsan, M. Ratain, M. Allen, V. Natarajan, M. Rushe, B. Browning, O. Orozco, M. Zhang, C. Hession and V. Bailly for technical assistance and valuable discussions. We also thank C. Huppenbauer (W. Nuhsbaum Inc./Leica Microscopes).
References
- Kris MG, Benowitz SI, Adams S, Diller L, Ganz P, Kahlenberg MS, et al. Clinical cancer advances 2010: annual report on progress against cancer from the American Society of Clinical Oncology. J Clin Oncol 2010; 28:5327 - 5347
- Devesa SS, Blot WJ, Fraumeni J Jr.. Changing patterns in the incidence of esophageal and gastric carcinoma in the United States. Cancer 1998; 83:2049 - 2053
- Marsman WA, Tytgat GN, ten Kate FJ, van Lanschot JJ. Differences and similarities of adenocarcinomas of the esophagus and esophagogastric junction. J Surg Oncol 2005; 92:160 - 168
- Catenacci DV, Cohen E, Villaflor VM. Thomas Jobe H. Pricinples of Multimodality Therapy. Gastroesophageal Tumors: Principles and Practice 2009; 33:Demos Medical Publishing 229 - 242
- Van Cutsem E, Van de Velde C, Roth A, Lordick F, Kohne CH, Cascinu S, et al. Expert opinion on management of gastric and gastro-oesophageal junction adenocarcinoma on behalf of the European Organisation for Research and Treatment of Cancer (EORTC)-gastrointestinal cancer group. Eur J Cancer 2008; 44:182 - 194
- Cunningham D, Oliveira J. Gastric cancer: ESMO clinical recommendations for diagnosis, treatment and follow-up. Ann Oncol 2008; 19:23 - 24
- Bang YJ, Van Cutsem E, Feyereislova A, Chung HC, Shen L, Sawaki A, et al. Trastuzumab in combination with chemotherapy versus chemotherapy alone for treatment of HER2-positive advanced gastric or gastro-oesophageal junction cancer (ToGA): a phase 3, open-label, randomised controlled trial. Lancet 2010; 376:687 - 697
- Herrera LJ, El-Hefnawy T, Queiroz de Oliveira PE, Raja S, Finkelstein S, Gooding W, et al. The HGF receptor c-Met is overexpressed in esophageal adenocarcinoma. Neoplasia 2005; 7:75 - 84
- Lee KH, Choi EY, Hyun MS, Jang BI, Kim TN, Kim SW, et al. Hepatocyte growth factor/c-met signaling in regulating urokinase plasminogen activator in human stomach cancer: A potential therapeutic target for human stomach cancer. Korean J Intern Med 2006; 21:20 - 27
- Houldsworth J, Cordon-Cardo C, Ladanyi M, Kelsen DP, Chaganti RS. Gene amplification in gastric and esophageal adenocarcinomas. Cancer Res 1990; 50:6417 - 6422
- Kuniyasu H, Yasui W, Kitadai Y, Yokozaki H, Ito H, Tahara E. Frequent amplification of the c-met gene in scirrhous type stomach cancer. Biochem Biophys Res Commun 1992; 189:227 - 232
- Smolen GA, Sordella R, Muir B, Mohapatra G, Barmettler A, Archibald H, et al. Amplification of MET may identify a subset of cancers with extreme sensitivity to the selective tyrosine kinase inhibitor PHA-665752. Proc Natl Acad Sci USA 2006; 103:2316 - 2321
- Ronsin C, Muscatelli F, Mattei MG, Breathnach R. A novel putative receptor protein tyrosine kinase of the met family. Oncogene 1993; 8:1195 - 1202
- Wang MH, Ronsin C, Gesnel MC, Coupey L, Skeel A, Leonard EJ, et al. Identification of the ron gene product as the receptor for the human macrophage stimulating protein. Science 1994; 266:117 - 119
- Gaudino G, Follenzi A, Naldini L, Collesi C, Santoro M, Gallo KA, et al. RON is a heterodimeric tyrosine kinase receptor activated by the HGF homologue MSP. EMBO J 1994; 13:3524 - 3532
- Wang MH, Wang D, Chen YQ. Oncogenic and invasive potentials of human macrophage-stimulating protein receptor, the RON receptor tyrosine kinase. Carcinogenesis 2003; 24:1291 - 1300
- Maestrini E, Tamagnone L, Longati P, Cremona O, Gulisano M, Bione S, et al. A family of transmembrane proteins with homology to the MET-hepatocyte growth factor receptor. Proc Natl Acad Sci USA 1996; 93:674 - 678
- Okino T, Egami H, Ohmachi H, Takai E, Tamori Y, Nakagawa A, et al. Immunohistochemical analysis of distribution of RON receptor tyrosine kinase in human digestive organs. Dig Dis Sci 2001; 46:424 - 429
- Wang MH, Lee W, Luo YL, Weis MT, Yao HP. Altered expression of the RON receptor tyrosine kinase in various epithelial cancers and its contribution to tumourigenic phenotypes in thyroid cancer cells. J Pathol 2007; 213:402 - 411
- Zhou D, Pan G, Zheng C, Zheng J, Yian L, Teng X. Expression of the RON receptor tyrosine kinase and its association with gastric carcinoma versus normal gastric tissues. BMC Cancer 2008; 8:353
- Wagh PK, Peace BE, Waltz SE. Met-related receptor tyrosine kinase Ron in tumor growth and metastasis. Adv Cancer Res 2008; 100:1 - 33
- Santoro MM, Penengo L, Minetto M, Orecchia S, Cilli M, Gaudino G. Point mutations in the tyrosine kinase domain release the oncogenic and metastatic potential of the Ron receptor. Oncogene 1998; 17:741 - 749
- Angeloni D, Danilkovitch-Miagkova A, Ivanov SV, Breathnach R, Johnson BE, Leonard EJ, et al. Gene structure of the human receptor tyrosine kinase RON and mutation analysis in lung cancer samples. Genes Chromosomes Cancer 2000; 29:147 - 156
- Peace BE, Hughes MJ, Degen SJ, Waltz SE. Point mutations and overexpression of Ron induce transformation, tumor formation and metastasis. Oncogene 2001; 20:6142 - 6151
- Thomas RM, Toney K, Fenoglio-Preiser C, Revelo-Penafiel MP, Hingorani SR, Tuveson DA, et al. The RON receptor tyrosine kinase mediates oncogenic phenotypes in pancreatic cancer cells and is increasingly expressed during pancreatic cancer progression. Cancer Res 2007; 67:6075 - 6082
- Thobe MN, Gurusamy D, Pathrose P, Waltz SE. The Ron receptor tyrosine kinase positively regulates angiogenic chemokine production in prostate cancer cells. Oncogene 2010; 29:214 - 226
- Wang J, Rajput A, Kan JL, Rose R, Liu XQ, Kuropatwinski K, et al. Knockdown of Ron kinase inhibits mutant phosphatidylinositol-3-kinase and reduces metastasis in human colon carcinoma. J Biol Chem 2009; 284:10912 - 10922
- Welm AL, Sneddon JB, Taylor C, Nuyten DS, van de Vijver MJ, Hasegawa BH, et al. The macrophagestimulating protein pathway promotes metastasis in a mouse model for breast cancer and predicts poor prognosis in humans. Proc Natl Acad Sci USA 2007; 104:7570 - 7575
- Kretschmann KL, Eyob H, Buys SS, Welm AL. The macrophage stimulating protein/Ron pathway as a potential therapeutic target to impede multiple mechanisms involved in breast cancer progression. Curr Drug Targets 2010; 11:1157 - 1168
- Thangasamy A, Rogge J, Ammanamanchi S. Regulation of RON tyrosine kinase-mediated invasion of breast cancer cells. J Biol Chem 2008; 283:5335 - 5343
- Feres KJ, Ischenko I, Hayman MJ. The RON receptor tyrosine kinase promotes MSP-independent cell spreading and survival in breast epithelial cells. Oncogene 2009; 28:279 - 288
- Chen Q, Seol DW, Carr B, Zarnegar R. Co-expression and regulation of Met and Ron proto-oncogenes in human hepatocellular carcinoma tissues and cell lines. Hepatology 1997; 26:59 - 66
- Follenzi A, Bakovic S, Gual P, Stella MC, Longati P, Comoglio PM. Cross-talk between the proto-oncogenes Met and Ron. Oncogene 2000; 19:3041 - 3049
- Maggiora P, Lorenzato A, Fracchioli S, Costa B, Castagnaro M, Arisio R, et al. The RON and MET oncogenes are co-expressed in human ovarian carcinomas and cooperate in activating invasiveness. Exp Cell Res 2003; 288:382 - 389
- Lee WY, Chen HH, Chow NH, Su WC, Lin PW, Guo HR. Prognostic significance of co-expression of RON and MET receptors in node-negative breast cancer patients. Clin Cancer Res 2005; 11:2222 - 2228
- Cheng HL, Liu HS, Lin YJ, Chen HH, Hsu PY, Chang TY, et al. Co-expression of RON and MET is a prognostic indicator for patients with transitional-cell carcinoma of the bladder. Br J Cancer 2005; 92:1906 - 1914
- Date K, Matsumoto K, Shimura H, Tanaka M, Nakamura T. HGF/NK4 is a specific antagonist for pleiotrophic actions of hepatocyte growth factor. FEBS Lett 1997; 420:1 - 6
- Jin H, Yang R, Zheng Z, Romero M, Ross J, Bou-Reslan H, et al. MetMAb, the one-armed 5D5 anti-c-Met antibody, inhibits orthotopic pancreatic tumor growth and improves survival. Cancer Res 2008; 68:4360 - 4368
- Dussault I, Bellon SF. From concept to reality: the long road to c-Met and RON receptor tyrosine kinase inhibitors for the treatment of cancer. Anticancer Agents Med Chem 2009; 9:221 - 229
- Christensen JG, Schreck R, Burrows J, Kuruganti P, Chan E, Le P, et al. A selective small molecule inhibitor of c-Met kinase inhibits c-Met-dependent phenotypes in vitro and exhibits cytoreductive antitumor activity in vivo. Cancer Res 2003; 63:7345 - 7355
- Sattler M, Pride YB, Ma P, Gramlich JL, Chu SC, Quinnan LA, et al. A novel small molecule met inhibitor induces apoptosis in cells transformed by the oncogenic TPR-MET tyrosine kinase. Cancer Res 2003; 63:5462 - 5469
- Lee J, Kang WK, Park JO, Park SH, Park YS, Lim HY, et al. Expression of activated signal transducer and activator of transcription 3 predicts poor clinical outcome in gastric adenocarcinoma. APMIS 2009; 117:598 - 606
- Kim DY, Cha ST, Ahn DH, Kang HY, Kwon CI, Ko KH, et al. STAT3 expression in gastric cancer indicates a poor prognosis. J Gastroenterol Hepatol 2009; 24:646 - 651
- Deng JY, Sun D, Liu XY, Pan Y, Liang H. STAT-3 correlates with lymph node metastasis and cell survival in gastric cancer. World J Gastroenterol 2010; 16:5380 - 5387
- Cappuzzo F, Marchetti A, Skokan M, Rossi E, Gajapathy S, Felicioni L, et al. Increased MET gene copy number negatively affects survival of surgically resected non-small-cell lung cancer patients. J Clin Oncol 2009; 27:1667 - 1674
- Moroni M, Sartore-Bianchi A, Veronese S, Siena S. EGFR FISH in colorectal cancer: what is the current reality?. Lancet Oncol 2008; 9:402 - 403
- Pitts TM, Tan AC, Kulikowski GN, Tentler JJ, Brown AM, Flanigan SA, et al. Development of an integrated genomic classifier for a novel agent in colorectal cancer: approach to individualized therapy in early development. Clin Cancer Res 2010; 16:3193 - 3204
- McDermott U, Sharma SV, Dowell L, Greninger P, Montagut C, Lamb J, et al. Identification of genotype-correlated sensitivity to selective kinase inhibitors by using high-throughput tumor cell line profiling. Proc Natl Acad Sci USA 2007; 104:19936 - 19941
- Rege-Cambrin G, Scaravaglio P, Carozzi F, Giordano S, Ponzetto C, Comoglio PM, et al. Karyotypic analysis of gastric carcinoma cell lines carrying an amplified c-met oncogene. Cancer Genet Cytogenet 1992; 64:170 - 173
- Hellman A, Zlotorynski E, Scherer SW, Cheung J, Vincent JB, Smith DI, et al. A role for common fragile site induction in amplification of human oncogenes. Cancer Cell 2002; 1:89 - 97
- Cepero V, Sierra JR, Corso S, Ghiso E, Casorzo L, Perera T, et al. MET and KRAS gene amplification mediates acquired resistance to MET tyrosine kinase inhibitors. Cancer Res 2010; 70:7580 - 7590
- Asaoka Y, Tada M, Ikenoue T, Seto M, Imai M, Miyabayashi K, et al. Gastric cancer cell line Hs746T harbors a splice site mutation of c-Met causing juxtamembrane domain deletion. Biochem Biophys Res Commun 2010; 394:1042 - 1046
- Fujimoto-Ouchi K, Sekiguchi F, Yasuno H, Moriya Y, Mori K, Tanaka Y. Antitumor activity of trastuzumab in combination with chemotherapy in human gastric cancer xenograft models. Cancer Chemother Pharmacol 2007; 59:795 - 805
- Rusnak DW, Alligood KJ, Mullin RJ, Spehar GM, Arenas-Elliott C, Martin AM, et al. Assessment of epidermal growth factor receptor (EGFR, ErbB1) and HER2 (ErbB2) protein expression levels and response to lapatinib (Tykerb, GW572016) in an expanded part of human normal and tumour cell lines. Cell Prolif 2007; 40:580 - 594
- Zhao S, Ammanamanchi S, Brattain M, Cao L, Thangasamy A, Wang J, et al. Smad4-dependent TGFbeta signaling suppresses RON receptor tyrosine kinase-dependent motility and invasion of pancreatic cancer cells. J Biol Chem 2008; 283:11293 - 11301
- Peschard P, Ishiyama N, Lin T, Lipkowitz S, Park M. A conserved DpYR motif in the juxtamembrane domain of the Met receptor family forms an atypical c-Cbl/Cbl-b tyrosine kinase binding domain binding site required for suppression of oncogenic activation. J Biol Chem 2004; 279:29565 - 29571
- Zhang W, Catenacci DV, Duan S, Ratain MJ. A survey of the population genetic variation in the human kinome. J Hum Genet 2009; 54:488 - 492
- Germain D, Frank DA. Targeting the cytoplasmic and nuclear functions of signal transducers and activators of transcription 3 for cancer therapy. Clin Cancer Res 2007; 13:5665 - 5669
- Park JS, Park JH, Lee S, Joo YE, Jung YD. Small interfering RNA targeting of Recepteur d'Origine Nantais induces apoptosis via modulation of nuclear factorkappaB and Bcl-2 family in gastric cancer cells. Oncol Rep 2010; 24:709 - 714
- Ferracini R, Di Renzo MF, Scotlandi K, Baldini N, Olivero M, Lollini P, et al. The Met/HGF receptor is overexpressed in human osteosarcomas and is activated by either a paracrine or an autocrine circuit. Oncogene 1995; 10:739 - 749
- Maulik G, Kijima T, Ma PC, Ghosh SK, Lin J, Shapiro GI, et al. Modulation of the c-Met/hepatocyte growth factor pathway in small cell lung cancer. Clin Cancer Res 2002; 8:620 - 627
- Cheng N, Bhowmick NA, Chytil A, Gorksa AE, Brown KA, Muraoka R, et al. Loss of TGFbeta type II receptor in fibroblasts promotes mammary carcinoma growth and invasion through upregulation of TGFalpha-, MSP- and HGF-mediated signaling networks. Oncogene 2005; 24:5053 - 5068
- Lee SH, Lee JW, Soung YH, Kim HS, Park WS, Kim SY, et al. BRAF and KRAS mutations in stomach cancer. Oncogene 2003; 22:6942 - 6945
- Migliore C, Petrelli A, Ghiso E, Corso S, Capparuccia L, Eramo A, et al. MicroRNAs impair MET-mediated invasive growth. Cancer Res 2008; 68:10128 - 10136
- Lu Y, Yao HP, Wang MH. Multiple variants of the RON receptor tyrosine kinase: biochemical properties, tumorigenic activities and potential drug targets. Cancer Lett 2007; 257:157 - 164
- Collesi C, Santoro MM, Gaudino G, Comoglio PM. A splicing variant of the RON transcript induces constitutive tyrosine kinase activity and an invasive phenotype. Mol Cell Biol 1996; 16:5518 - 5526
- Ghigna C, Giordano S, Shen H, Benvenuto F, Castiglioni F, Comoglio PM, et al. Cell motility is controlled by SF2/ASF through alternative splicing of the Ron protooncogene. Mol Cell 2005; 20:881 - 890
- Schvartzman JM, Sotillo R, Benezra R. Mitotic chromosomal instability and cancer: mouse modelling of the human disease. Nat Rev Cancer 2010; 10:102 - 115
- Kanteti R, Yala S, Ferguson MK, Salgia R. MET HGF, EGFR and PXN gene copy number in lung cancer using DNA extracts from FFPE archival samples and prognostic significance. J Environ Pathol Toxicol Oncol 2009; 8:89 - 98
- Bustin SA, Benes V, Garson JA, Hellemans J, Huggett J, Kubista M, et al. The MIQE guidelines: minimum information for publication of quantitative real-time PCR experiments. Clin Chem 2009; 55:611 - 622
- Stricker T, Catenacci DV, Seiwert TY. Molecular profiling of cancer-the future of personalized cancer medicine: a primer on cancer biology and the tools necessary to bring molecular testing to the clinic. Semin Oncol 2011; 38:173 - 185
- Tsujimoto H, Sugihara H, Hagiwara A, Hattori T. Amplification of growth factor receptor genes and DNA ploidy pattern in the progression of gastric cancer. Virchows Arch 1997; 31:383 - 389
- Hofmann M, Stoss O, Shi D, Buttner R, van de Vijver M, Kim W, et al. Assessment of a HER2 scoring system for gastric cancer: results from a validation study. Histopathology 2008; 52:797 - 805
- Moelans CB, van Diest PJ, Milne AN, Offerhaus GJ. Her-2/neu testing and therapy in gastroesophageal adenocarcinoma. Patholog Res Int 2011; 2011:674182
- Penengo L, Rubin C, Yarden Y, Gaudino G. c-Cbl is a critical modulator of the Ron tyrosine kinase receptor. Oncogene 2003; 22:3669 - 3679
- Stommel JM, Kimmelman AC, Ying H, Nabioullin R, Ponugoti AH, Wiedemeyer R, et al. Coactivation of receptor tyrosine kinases affects the response of tumor cells to targeted therapies. Science 2007; 318:287 - 290
- Kim JG, Chung HY, Yu W. Recent advances in chemotherapy for advanced gastric cancer. World J Gastrointest Oncol 2010; 2:287 - 294
- Jagadeeswaran R, Surawska H, Krishnaswamy S, Janamanchi V, Mackinnon AC, Seiwert TY, et al. Paxillin is a target for somatic mutations in lung cancer: implications for cell growth and invasion. Cancer Res 2008; 68:132 - 142
- The AGT Cytogenetics Laboratory Manual 1997; 3 Lippincott & Raven
- Varella-Garcia M, Diebold J, Eberhard DA, Geenen K, Hirschmann A, Kockx M, et al. EGFR fluorescence in situ hybridisation assay: guidelines for application to non-small-cell lung cancer. J Clin Pathol 2009; 62:970 - 977
- Wolff AC, Hammond ME, Schwartz JN, Hagerty KL, Allred DC, Cote RJ, et al. American Society of Clinical Oncology/College of American Pathologists guideline recommendations for human epidermal growth factor receptor 2 testing in breast cancer. J Clin Oncol 2007; 25:118 - 145
- Sattler M, Quackenbush E, Salgia R. Cell motility, adhesion, homing and migration assays in the studies of tyrosine kinases. Methods Mol Med 2003; 85:87 - 105
- Wang Y, Shyy JY, Chien S. Fluorescence proteins, live-cell imaging and mechanobiology: seeing is believing. Annu Rev Biomed Eng 2008; 10:1 - 38
- Groves JT, Parthasarathy R, Forstner MB. Fluorescence imaging of membrane dynamics. Annu Rev Biomed Eng 2008; 10:311 - 338
- Faoro L, Hutto JY, Salgia R, El-Zayaty SA, Ferguson MK, Cheney RT, et al. Lymphatic vessel density is not associated with lymph node metastasis in non-small cell lung carcinoma. Arch Pathol Lab Med 2008; 132:1882 - 1888
- Munshi N, Jeay S, Li Y, Chen CR, France DS, Ashwell MA, et al. ARQ 197, a novel and selective inhibitor of the human c-Met receptor tyrosine kinase with antitumor activity. Mol Cancer Ther 2010; 9:1544 - 1553
- Eathiraj S, Palma R, Volckova E, Hirschi M, France DS, Ashwell MA, et al. Discovery of a novel mode of protein kinase inhibition characterized by the mechanism of inhibition of human mesenchymal-epithelial transition factor (c-MET) autophosphorylation by ARQ 197. J Biol Chem 2011; 286:20666 - 20676