Abstract
Tissue factor (TF) is a significant risk factor for hepatic metastasis in patients with colorectal cancer (CRC). However, the mechanism by which TF promotes hepatic metastasis in CRC remains elusive. In this study, we first confirmed that TF expression was significantly correlated with lymph node metastasis, hepatic metastasis and TNM staging in clinical CRC samples, and found that TF expression in colon cancer cell lines was correlated with the invasion ability. Next, by employing TF-overexpressing LOVO cell line as a model we demonstrated that lentivirus mediated knockdown of TF suppressed the migration and invasion of LOVO cells in vitro, and hepatic metastasis of colorectal cancer in nude mice orthotopic model. Mechanistically, we found that TF knockdown decreases colony formation ability and induced autophagy and apoptosis of LOVO cells, and this was at least partly mediated by the activation of unfolded protein response/PERK signaling. In conclusion, our data provide new insight into hepatic metastasis of CRC. Agents targeting TF should be developed as adjuvant therapeutics for CRC metastasis.
Introduction
Colorectal cancer (CRC) is one of the most lethal malignancies. It is estimated that 400,000 patients died of CRC in 2006. It is the second most common malignancy in the United States and the fourth in China. Despite recent advances in primary prevention, combined therapy with operation,Citation1 radiotherapy and drug treatment,Citation2 the long-term survival rate of CRC patients has not been substantially improved. Hepatic metastasis is one of the most important characteristics of CRC, especially in advanced stage, accounting for the low survival rate of the patients.
Cancer invasion and metastasis is a complex process, among which the proteolytic degradation of extracellular matrix (ECM) is an essential step. Matrix metalloproteinases (MMPs), serine proteases, and other proteases produced by many kinds of tumors including colorectal carcinoma, function to degrade the ECM and promote tumor invasion and metastasis.Citation3 Interestingly, emerging evidence suggests that autophagy, a tightly regulated lysosomal degradation pathway, could promote or inhibit cancer metatstasis in a context dependent manner.Citation4 Genetic screens in yeast have identified more than 30 autophagy-related genes (ATGs),Citation5 many of which have homologs in mammalian cells.Citation6 These include the ATG8 and its mammalian homolog microtubule-associated protein 1 light chain 3 (MAP1LC3B).Citation7 During autophagy, MAP1LC3B is cleaved by ATG4 into a cytosolic form referred to as MAP1LC3B-I, which is then conjugated to the lipid phosphatidylethanolamine (referred to as MAP1LC3B-II), and inserted into both inner and outer membranes of the growing autophagic vesicle. Consequently, autophagy can be followed in cells by monitoring the distribution and processing of MAP1LC3B.
The principal initiator of coagulation, tissue factor (TF) activates downstream signaling upon binding to factor VIIa (FVIIa).Citation8 Recently it is reported that the inhibition of TF blunts hepatic metastasis in colorectal cancer, but the detailed mechanism remains elusive.Citation9 Here we addressed how TF contributes to hepatic metastasis of CRC in vitro and in vivo. Our results demonstrated that TF expression in CRC was significantly correlated with lymph node metastasis, hepatic metastasis and TNM staging in clinical samples. In addition, lentivirus mediated knockdown of TF suppressed the migration and invasion of LOVO cells in vitro, and hepatic metastasis of colorectal cancer in nude mice orthotopic model. Notably, TF knockdown induced the activation of unfolded protein response/PERK signaling, which promoted autophagy of LOVO cells depleted of TF.
Results
Clinical parameters and TF immunostaining
Immunostaining showed that TF expression was very strong in CRC tissues (, panel T) and in metastitic liver tissues (, panel L), but was negative in normal colon tissues (, panel N). 109 out of 203 (53.7%) CRC tissue specimens were judged as high TF immunoreactivity (60 cases moderately positive, 49 cases strongly positive) and 94 as low TF immunoreactivity (19 cases negative, 75 cases weak positive). Next we performed protein gel blot analysis and found that TF was highly expressed in CRC and liver metastasis tissues but weakly expressed in normal colon tissue ().
Figure 1. TF immunoreactivity in CRC samples. (A) TF immunostaining in clinical samples. (N) Normal colon tissue; (T) CRC tissues; (L) metastatic liver tissue. Scale bar = 50 mm. (B) Protein gel blot analysis of TF expression in normal colon (N), CRC (T) and liver metastasis (L) tissues. Quantitative data were presented as mean ± SEM, n = 3. (C) The correlation of TF immunoreactivity with the survival rate of CRC patients. The overall survival rate of patients with high TF immunoreactivity was significantly lower than those patients with low TF immunoreactivity. (hazard ratio: 1.886, 95% CI: 1.353–2.629, p < 0.001).
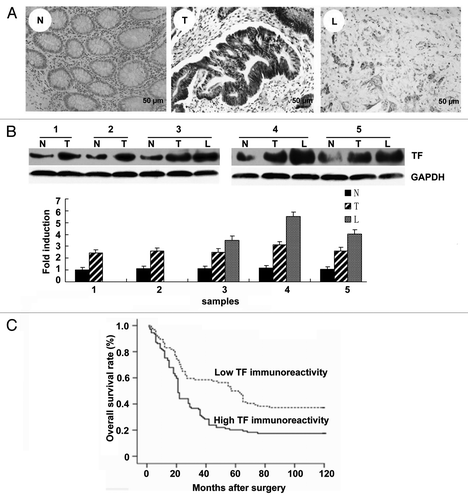
To explore the clinical significance of high TF expression in CRC tissues, we analyzed the correlation between clinical parameters and TF immunoreactivity. As shown in , TF immunoreactivity was significantly correlated with hepatic metastasis both synchronous and metachronous (p < 0.001). It was also correlated with tumor differentiation, invasion depth and lymph node metastasis, but not with gender and age. The synchronous and metachronous hepatic metastasis in the high TF immunopositive group was significantly greater than in low TF immunopositive group, respectively (p < 0.001). But there was no significant difference between synchronous and metachronous hepatic metastasis groups (p = 0.845). In addition, invasion depth was significantly correlated with hepatic metastasis (p < 0.01).
Table 1. The correlation of TF immunoreactivity with clinical parameters of CRC samples
Furthermore, survival analysis revealed that the overall survival rate of patients with high TF immunoreactivity was significantly lower than those with low TF immunoreactivity (hazard ratio: 1.886, 95% CI: 1.353–2.629, p < 0.001) (). Univariate analysis indicated that other clinical parameters including tumor differentiation (p = 0.0012), depth of tumor invasion (p < 0.001), lymph node metastasis (p < 0.001) and distant metastasis (p < 0.001) were also predictive of postoperative prognosis. However, Cox multivariate proportional hazards regression analysis revealed that only distant metastasis (hazard ratio: 1.886, 95% CI: 1.353–2.629, p < 0.001) was an independent risk factor for poor patient prognosis ().
TF expression in colon cancer cell lines is correlated with the invasion ability of the cells
To investigate the molecular mechanism by which TF promotes CRC metastasis, we employed colon cancer cell lines with different potency of metastasis. Protein gel blot assay showed that TF expression was high in LOVO and SW620 cells with high potency of metastasis and in SW480 and HT-29 cells with moderate potency metastasis, but was undetectable in RKO and DLD1 cells with low potency metastasis (). However, these data were not consistent with the results of real-time PCR assay (), suggesting that TF expression is regulated at post-transcription level in colon cancer cells.Citation13
Figure 2. TF expression in colon cancer cell lines is correlated with the invasion ability of the cells. (A) Real-time PCR analysis of TF mRNA level in colon cancer cell lines. Quantitative data were presented as mean ± SEM, n = 3. (B) Protein gel blot analysis of TF protein level in colon cancer cell lines. (C) Gelatin zymography analysis of MMP2/MMP9 enzymatic activity. (D) Transwell assay of the invasion ability of the cell lines.
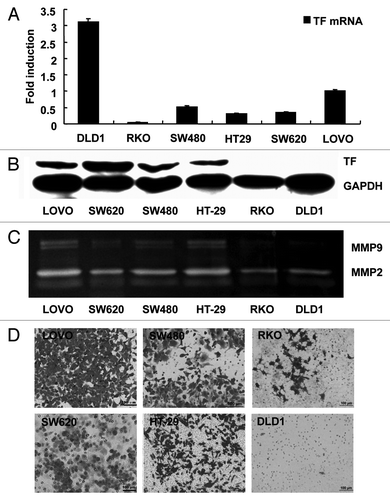
Next we examined the invasion ability of the cell lines that expressed high protein level of TF (LOVO, SW620, SW480 and HT-29) and that expressed low protein level of TF (RKO and DLD1) using the gelatin zymography assay and matrigel invasion assay. The results demonstrated the consistency between TF expression of and the invasion of tumor cells. MMP2/MMP9 enzymatic activity was higher in LOVO, SW620, SW480 and HT-29 cells than in RKO and DLD1 cells (). In addition, LOVO, SW620, SW480 and HT-29 cells showed higher invasion ability than RKO and DLD1 cells ().
Collectively, these results proved that TF expression in colon cancer cell lines is correlated with the invasion ability of the cells. We chose LOVO cells as the model for the following experiments because TF expression in this cell line was high at both mRNA and protein levels.
TF knockdown suppresses the migration and invasion of LOVO cells
Lentivirus mediated TF knockdown led to efficient and specific depletion of TF in LOVO cells as confirmed by RT-PCR and protein gel blot analysis (). Next we investigated the effect of TF knockdown on the invasion and migration ability of LOVO cells. Gelatin zymography assay showed that MMP9 enzymatic activity was significantly inhibited in TF knockdown cells (). Transwell invasion assay showed that the number of cells crossing the matrigel was 5.9 ± 1.1 in TF knockdown group, significantly less than 96.7 ± 2.4 in empty vector group, and 108.4 ± 2.2 in untransfected group (p < 0.05, ). Migration assay also demonstrated the impaired migration ability of TF knockdown cells in comparison to control cells (72.8 ± 4.2 in TF knockdown group, 197.2 ± 6.1 in empty vector group, and 203.6 ± 7.5 in untransfected group) (p < 0.05, ). Furthermore, we employed scratch wound-healing assay to confirm that TF knockdown would reduce the migration rate of LOVO cells. The result showed decreased cell migration in wound closure in TF knockdown LOVO cells compared with control cells, as measured after 24 and 48 h of wound healing ().
Figure 3 (See previous page). TF knockdown suppresses the migration and invasion of LOVO cells. (A) Real-time PCR analysis of TF mRNA level in different groups of LOVO cells. (B) Protein gel blot analysis of TF protein level in different groups of LOVO cells. (C) Gelatin zymography analysis of MMP2/MMP9 enzymatic activity in different groups of LOVO cells. (D) Transwell assay of the migration and invasion ability of different groups of LOVO cells. (E) Would healing assay of the migration of different groups of LOVO cells photographs were taken at 0, 24 and 48 h after the wound was made by confocal microscopy. Representative photographs (upper) and quantification (lower) were shown. (F) Protein gel blot analysis of MMP2, MMP9, c-fos and c-jun protein level in different groups of LOVO cells. Magnification: × 200. Data shown were the representative set of three independent experiments. *p < 0.05, **p < 0.01, vs. the empty vector group.
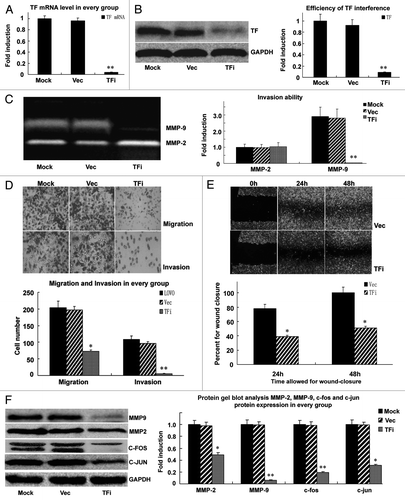
Since MMPs is crucial for the migration and invasion of cancer cells, next we examined the expression of MMP2 and MMP9 after TF knockdown and found that TF knockdown inhibited the expression of MMP2 and MMP9 (). In addition, we examined the expression of the transcription factors c-fos and c-jun, which are responsible for the upregulation of MMPs in various conditions. Protein gel blot analysis revealed that TF knowckdown led to decreased expression of c-fos and c-jun (), suggesting that TF induced upregulation of MMPs may be mediated by c-fos and c-jun.
Altogether, these loss-of-function studies in vitro demonstrate that TF knockdown suppresses the migration and invasion of LOVO cells, providing evidence that TF promotes CRC metastasis.
TF knockdown suppresses hepatic metastasis of colorectal cancer in vivo
To provide in vivo evidence that TF promotes CRC metastasis, we established an orthotopic model of colon cancer progression for in vivo monitoring of local tumor growth and dissemination in real time. Prior to cecum subserosa injection, the average fluorescence of LOVO cells was determined and shown to be directly proportional to cell number, and the luminescent signals emitted by the cells of empty vector group and TF knockdown group were similar. After orthotopic surgical implantation of LOVO cells, nude mice were imaged every month to compare colon signal intensity and monitor the development of hepatic metastasis. Significant differences in hepatic metastases () as well as orthotopic tumor growth () between the two experimental groups were observed. time for metastatic development was shorter, and both the total number of metastatic sites and the size of the tumor foci were significantly higher in vector control group than in TF knockdown group.
Figure 4. TF knockdown suppresses hepatic metastasis of colorectal cancer in vivo. (A) in the control group, infusion of cancer cells resulted in development of macroscopic hepatic tumors in 19/20 mice (Vec). In the TF knockdown group, macroscopic hepatic tumors were visible on the liver surface in 2/20 mice (TFi) (p < 0.001 vs. control). Black arrows indicated orthotopic tumor, hollow arrows indicated hepatic metastasis. (B) Macroscopic examination of the liver. In the control group, metastasis was visible macroscopically. By contrast, in the TF knockdown group, no metastasis was visible macroscopically. (C) Orthotopic tumor weight (g) in the two group after 3 mo. Significant difference in orthotopic tumor growth between the two groups. *p < 0.05, **p < 0.01, vs. empty vector group.
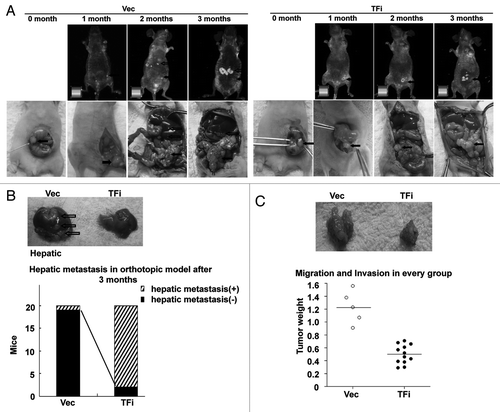
Taken together, these data demonstrate that TF depletion inhibits tumor growth and hepatic metastases in vivo. These findings are consistent with the in vitro studies and clinicopathologic data shown above.
TF knockdown decreases colony formation ability and induces autophagy and apoptosis of LOVO cells
Colony formation assay showed an apparent decrease both in cell colony formation numbers and in clone sizes of TF knockdown cells (). After 7 d, colony formation efficiency was (23 ± 3)/1000 for TF knockdown cells and (171 ± 25)/1000 for empty vector transfected cells.
Figure 5 (See previous page). TF knockdown induces autophagy and apoptosis of LOVO cells. (A) colony formation assay showing inhibition of colony formation ability in LOVO cells depleted of TF. (B) Histochemical staining of MAP1LC3B in LOVO cells. magnification ( × 400). (C and D) AnnexinV-PE/7AAD staining of apoptotic LOVO cells as analyzed by FCM (C) and confocal microscopy (D). (E) Electron microscopy showing the activation of autophagy in LOVO cells depleted of TF, in which autophagic vesicles were distinguished from other vesicles by the presence of a double membrane. The apoptotic cells exhibited the typical high density nucleic condensation, nuclei fragmentation and apoptotic bodies. (F) Protein gel blot analysis of MAP1LC3B, ATG5, caspase-3, caspase-9 and PARP protein level in different groups of LOVO cells. *p < 0.05, **p < 0.01, vs. empty vector group.
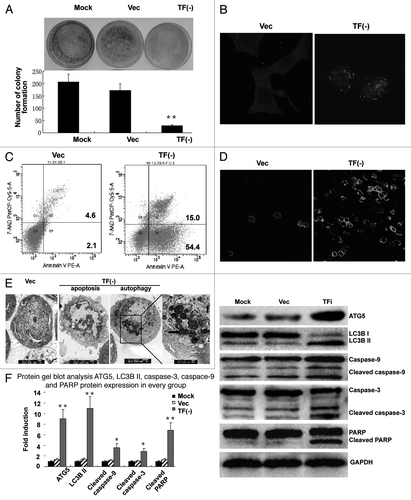
Several forms of cell stress within tumor microenvironments are capable of inducing autophagy and apoptosis. To test whether TF knockdown could induce autophagy and apoptosis, we monitored the expression of the markers of autophagy and apoptosis in TF knockdown LOVO cells. The results showed that TF knockdown was sufficient to induce the conversion of MAP1LC3B from the cytosolic form MAP1LC3B-I to the lapidated membrane-bound form MAP1LC3B-II, as well as the activation of caspase-3/9 and PARP (). Changes in MAP1LC3B processing and expression were also examined by immunocytochemical staining in TF knockdown LOVO cells (). In control conditions, MAP1LC3B staining was diffuse with few foci characteristic of autophagosomes. In contrast, TF knockdown induced a rapid relocalization of MAP1LC3B into a punctuate pattern. Activation of autophagy and apoptosis was confirmed by electron microscopy, in which autophagic vesicles were distinguished from other vesicles by the presence of a double membrane (). Apoptosis was induced by TF knockdown alone in LOVO cells as analyzed by flow cytometry () and AnnexinV-PE/7AAD staining (). These data suggest that TF could protect LOVO cells from autophagy and apoptosis.
TF knockdown activates UPR signaling to regulate autophagy in LOVO cells
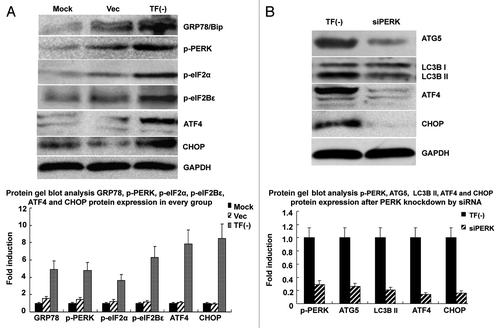
Recent evidence suggests that autophagy is activated to act as a novel survival mechanism in cells in response to endoplasmic reticulum stress.Citation14 ER stress is known to induce the unfolded protein response (UPR) and the activation of PERK pathway. Therefore, we examined the activation of PERK pathway in LOVO cells. We detected increased levels of phosphorylated eIF2α (p-eIF2α), eIF2Bε (p-eIF2 Bε), ATF4 and CAATT enhancer binding protein homologous protein (CHOP) in TF knockdown cells, suggesting the activation of PERK pathway under this condition (). Next we demonstrated that siRNA-mediated knockdown of PERK had significant inhibitory effects on the expression of autophagy markers MAP1LC3B and ATG5 and ER associated protein ATF4 and CHOP in TF knockdown cells (). These results suggest that the depletion of TF results in the activation of the UPR and PERK pathway to induce autophagy in LOVO cells.
Figure 6. TF knockdown activates UPR signaling to regulate autophagy in LOVO cells. (A) Protein gel blot analysis showing the activation of UPR signaling in LOVO cells depleted of TF. (B) siRNA-mediated knockdown of PERK abrogated the upregulation of MAP1LC3B, ATG5, ATF4 and CHOP in LOVO cells depleted of TF. The data were mean ± SEM from three independent experiments.
Discussion
Hepatic metastasis is the leading cause of death in colorectal cancer patients. Current available adjuvant therapies aiming at preventing or treating hepatic metastasis, such as 5FU-leucovorin, irinotecan, or oxaliplatin, have achieved unsatisfactory effects, thus it is urgent to develop new efficient adjuvant agents for CRC metastasis.
Hyper-coagulability and angiogenesis are involved in cancer progression, through upregulation of tissue factor (TF), the cellular receptor of coagulation factor VII (FVII), and the principal initiator of the coagulation cascade. After binding of FVII to TF, the TF-FVIIa complex induces proteolytic activation of factor X and the generation of thrombin, leading to platelet activation and fibrin clot formation. TF-FVIIa also induces the activation of protease-activated receptors (PAR), especially PAR-2. TF is expressed in most CRC cells, and this aberrant expression is proposed to be directly linked to oncogenic mutations of K-ras oncogene and loss of p53 tumor suppressor gene in human CRC cells.Citation15
In the present study, univariate and multivariate analyses of 203 macro-dissected colon cancer samples revealed that TF is a major factor in hepatic metastatic dissemination of CRC. First, TF expression in primary tumors was significantly higher in patients with liver metastasis than in those without metastasis. Second, significantly higher TF expression was observed in tumor cells derived from hepatic metastasis than in the corresponding primary tumor cells. Third, the overall survival rate of CRC patients was significantly lower among patients with high TF immunoreactivity than those with low TF immunoreactivity. Forth, TF expression was significantly higher in tumor cells from patients with Dukes C and D CRC than in those from patients with Dukes A and B CRC. In addition, we provided both in vitro and in vivo evidence that TF promotes CRC metastasis. Lentivirus mediated TF knockdown inhibited the migration and invasion of LOVO cells that overexpress TF in vitro. In orthotopic model of CRC in nude mice, depletion of TF in injected tumor cells significantly inhibited the development of hepatic metastases.
Endoplasmic reticulum stress, initiated by the accumulation of unfolded or misfolded proteins, activates the unfolded protein response (UPR), which adapts cells to the stress.Citation16-Citation18 If the stress is intolerable, UPR activates an apoptotic program to eliminate the affected cells. Mechanistically, our results demonstrate that depletion of TF not only inhibited TF mediated activation of MMPs through the transcription factors c-fos and c-jun, but also decreases colony formation ability induced the apoptosis and autophagy of tumor cells. Notably, we found that the depletion of TF resulted in the activation of UPR that enhances the capacity of tumor cells to undergo autophagy, which may promote their survival, but adversely influences their migration, invasion and metastasis. Depletion of TF in LOVO cells led to the upregulation of autophagy-related gene 5 (ATG5) and essential autophagy gene MAP1LC3B through the transcription factors ATF4 and CHOP, respectively, which are regulated by PERK kinase, also known as EIF2AK3.Citation19 MAP1LC3B and ATG5 are not required for the initiation of autophagy but mediate phagophore expansion and autophagosome formation.Citation20-Citation22
Most significantly, our results reveal a previously unknown link between TF and the regulation of autophagy and apoptosis. While autophagy involves UPR-dependent transcriptional induction of MAP1LC3B and ATG5, apoptosis involves UPR-dependent transcriptional induction of caspase-9/3 and CHOP. In the present study, we demonstrate that the regulation of autophagy and apoptosis by the PERK/eIF2α/ATF4 arm of the UPR upon TF knockdown is important in the modulation of cell colony formation, migration and invasion. It remains controversial whether autophagy promotes or inhibits tumor metastasis. Further studies are necessary to investigate the potential role of autophagy in inhibiting CRC invasion and metastasis in our experimental setting.
In conclusion, our findings confirm that TF has potential value as a prognosis factor for CRC metastasis. In addition, depletion of TF inhibits CRC metastasis both in vitro and in vivo, through the downregulation of MMPs and the activation of autophagy and apoptosis. These data strongly suggest that blocking TF through genetic or pharmacological approaches could reduce hepatic metastasis of colorectal cancer. Thus TF represents a novel target for the diagnosis, prognosis and therapy of colon cancer.
Materials and Methods
Clinical samples
A total of 203 CRC patients (aged from 27–89 y old, with median age of 64 y) who underwent surgery at the 1st hospital of Peking University from January 1994 to May 2005 were the subjects of the present study. All patients were Chinese and did not receive preoperative chemotherapy or radiotherapy. Parafin wax-embedded blocks of tumor tissues were assembled from the archival collections of the Department of Pathology. Most patients (all stages I–II and some stage III patients) did not have any postoperative chemotherapy or radiotherapy. Some patients with stage III or IV disease underwent postoperative chemotherapy or radiotherapy. All 203 cases were confirmed as CRC using tissue sections stained with Hematoxylin and Eosin (H&E). The clinical parameters of the patients were shown in . In addition, six normal tissues from the nonmalignant portion of the colon were resected during the surgery and used as controls. Survival data of all patients were collected. The collection of clinical samples was approved by the Ethics Committee of Peking University, and all patients gave their written informed consent.
Immunohistochemistry
Immunohistochemical staining was performed using the Dako EnVisionTM technique according to the manufacturer’s instruction (Dako). Briefly, formalin-fixed, parafin wax-embedded tissues were cut into 3 mm consecutive sections, dewaxed in xylene and rehydrated in graded ethanol solutions. After antigen retrieval the sections were immersed in a 0.3% hydrogen peroxide solution for 15 min to block endogenous peroxidase activity. Non-specific labeling was blocked by the incubation with 5% bovine serum albumin at room temperature for 30 min. Sections were then incubated with TF primary antibody (diluted in 1:1000, ab17375, Abcam) at 4°C overnight. A negative control was performed by omitting the primary antibodies. The sections were then treated by polymer accentuator (ready-to-use, Dako) for 20 min and incubated with horseradish peroxidase-labeled goat anti-mouse secondary antibody (ready-to-use, Dako). Diaminobenzene was used as the chromogen and hematoxylin as the nuclear counterstaining. The sections were dehydrated, cleared and mounted.
All slides were examined independently by two pathologists, who were not informed about the patients’ clinical data. The intensity for TF immunostaining was judged on a scale as follows: 0, negative (0%); 1, weak positive (< 25%); 2, moderate positive (< 75%); 3, strong positive (≥ 75%).Citation22 For simple statistical analysis, the patients were divided into a low TF immunoreactive group (grade 0 and 1) and a high TF immunoreactive group (grade 2 and 3).
Cell culture
LOVO, SW480, HT29 and RKO cell lines were obtained from ATCC and grown in Dulbecco modified Eagle medium (DMEM) with high glucose (HyClone) and SW620 and DLD1 cell lines grown in RPIM-1640 (Hyclone), supplemented with 10% heat-inactivated fetal bovine serum (Gibco) and 5 mM CaCl2 and 1% penicillin/streptomycin in a 5% CO2 incubator at 37°C.
Establishment of stable TF knockdown cells
Interfering RNA (RNAi) against TF was chemically synthesized (Ambion) with the following sequence: The TF siRNA sense sequence was 5′-GATCCGCGCTTCAGGCACTACAAATTCAAGAGATTTGTAGTGCCTGAAGCGCCGA-3′ and the antisense sequence was 5′-AGCTTCGGCGCTTCAGGCACTACAAATCTCTTGAATTTGTAGTGCCTGAAGCGCG-3′. The oligonucleotides were diluted to 1 μg/µl in TE, and heated at 90°C for 3 min, then cooled to 37°C and incubated for 1 h at 37°C. The annealed template was cloned into pSilencer 4.1-CMV siRNA expression vector according to the manufacturer’s instruction (Ambion). A total of 107 TF RNAi lentivirus was transduced into 90% confluent LOVO cells in 25-cm flask (Costar) using 1 ml serum free DMEM. Successful knockdown of TF was analyzed by protein gel blot analysis and real-time PCR, and the stable knockdown cells were established by flow cytometry (FCM) sorting.
siRNA transfection
LOVO cells were seeded into 6-well plates and cultured to 50% confluence on the day of transfection. The small interfering RNAs (siRNAs) for PERK, as well as the nontargeting siRNA control, SiConTRol non-targeting SiRNA pool (D-001206–13–20) were purchased from Dharmacon. the shRNA against PERK (targeting sequence 5′-AGCGCGGCAGGTCATTAGTAA-3′) were generated as described previously. Cells were transfected with 100 nM siRNA diluted in DMEM using Lipofectamine reagent (Invitrogen) according to the manufacturer’s protocol.
Quantitative real-time PCR
Total RNA was extracted from tissue samples or LOVO cells using Trizol (Invitrogen) according to the manufacturer’s protocol. Reverse transcription was performed using 1 ug RNA and High Capacity RNA-to-cDNA kit (Applied Premega) with random primers. Real-time PCR was performed in ABI 7500 (Applied Biosystems) with a final reaction of 20 ul. Gene abundance was detected using power SYBR Green I (Applied Biosystems). Actin gene was used as an internal control (Applied Biosystems). Primer pairs were as follows: TF, 5′-CAAACCCGTCAATCAAGTCTAC and 3′-CTTCACATCCTTCACAATCTCG; GAPDH, 5′-CCCCATGGTGTCTGAGCG and 3′-CGACAGTCAGCCGCATCTT.
Immunoblotting
LOVO cells or 40 frozen CRC tissues (10 each for Duke’s A, B, C and D stages) were lysed in RIPA buffer supplemented with protease and phosphatase inhibitors. The lysates were centrifuged at 20,000 rpm for 20 min at 4°C, and the supernatant was collected. Protein concentration was determined using a Bio-Rad kit (Bio-Rad Laboratories, Inc.). Equal amount of protein was separated in 10, 12, or 15% SDS-PAGE gels and transferred to polyvinylidene difluoride membranes. After blocking, the membranes were probed with primary antibodies for TF (ab17375), GAPDH (santa cruz), ATF4 (abcom), GADD153 (santa cruz), MAP1LC3B (Sigma), MMP2/9 (CST), p-eIF2α (abcom), p-eIF2Bε (abcom), c-fos (santa cruz), c-jun (santa cruz), caspase-3 (CST), caspase-9 (CST), PARP (CST), GRP78 (santa cruz), followed by incubation with HRP-labeled secondary antibodies. Immunoreactivity signals were developed using ECL kit (GE Healthcare).
Flow cytometry and confocal microscopy
The LOVO cells were fixed in 4% PBS-buffered paraformaldehyde and subjected to AnnexinV-PE and 7AAD double staining according to the manufacturer’s recommendations. The apoptosis of cells was analyzed by flow cytometry and confocal microscopy. For detection of autophagy, cells were seeded on glass coverslips in 6-well plates. On the third day after transfection, cells were fixed in 4% PBS-buffered paraformaldehyde, and permeabilized using 0.5% Tween-20 in PBS. Cells were probed with antibody for cleaved MAP1LC3B (Sigma) followed by anti-rabbit fluorescence secondary antibody or TF antibody followed by anti-mouse fluorescence secondary antibody and analyzed by confocal microscopy.
Transmission electron microscopy
The LOVO cells were fixed in 0.01 mol/L sodium phosphate buffer containing 2.5% glutaraldehyde (pH7.4). Next, the cells were fixed, dehydrated, embedded, and sliced as described by Wang et al.Citation10 Ultrathin sections were stained with uranyl acetate and lead citrate and examined under a JEM-1230 transmission electron microscope (JEOL).
Wound-healing assay
An in vitro wound healing/scratch assay was used to assess the motility of tumor cells. Briefly, LOVO cells were plated in 6-well plates and cultured to 90% confluence. On the next day, a wound was created using a sterile micropipette tip and then immediately washed with growth medium twice and cultured in DMEM medium containing 2% FBS at 37°C in a humidified incubator with 5% CO2 for up to 48 h. The migration of cells toward the wound was monitored daily, and images were captured by fluorescence microscope at time intervals of 24 h.
Cell invasion and migration assays
To detect cell invasion, 24-well transwell plate consisting of transwell chambers (pore size 8 μm) with precoated matrigel (Becton Dickinson) membrane filter was used. Five hundred microliters DMEM containing 10% FBS was added to the lower chamber and 5 × 10⁴ LOVO cells in 200 μl of serum free DMEM were plated into the upper chamber. The chamber was incubated for 48 h at 37°C. Then, the upper surface of the filters were removed and the invaded cells were fixed with 4% Paraformaldehyde and stained with 0.1% crystal violet (Sigma). The number of invaded cells was quantified by counting five random fields (magnification, 200 ×) per filter. To detect cell migration, 24-well transwell plate (matrigel-uncoated) was used and the procedures was the same as cell invasion assay. Both assays were performed in triplicate.
Gelatin zymography assay
Gelatin zymography assay was performed as described previously.Citation11 In brief, the conditioned medium of LOVO cells was collected by centrifugation at 5,000 rpm for 10 min, and subjected to zymographic SDS-PAGE containing 0.1% gelatin (w/v). The gels were washed and incubated in incubation buffer for 48 h, then stained with Coomassie brilliant blue and destained. The zone of gelatinolytic activity was shown by negative staining.
Colony formation assay
About 1,000 cells of each clone were seeded in 10-cm culture dishes. After culture in DMEM containing 10% fetal calf serum for 7 d, and then fixed with 4% Paraformaldehyde and stained with 0.1% crystal violet. Colonies containing 50 or more cells were counted. The colony formation efficiency was calculated as follows: number of clusters exhibited green fluorescence/number of plated cells exhibited green fluorescence × 100%. Three reduplicate dishes were used for each clone.
Animal models
All animal experiments were performed under approved protocols of the institutional animal use and care committee. Female BALB/cnu/nu mice were 6–8 weeks old, weighed 28–32 g, and maintained in a germ-free environment in the animal facility. To establish orthotopic colon carcinoma model, TF knockdown or control GFP-tagged LOVO cells (107 cells in 100 ul PBS) were injected into upper cecum subserosa of the nude mice to form a bubble. Twenty nude mice in each group were used for this model. After tumor volume reached 200 mm3, the animals were analyzed by in vivo fluorescence imaging every month. Animals were placed supine under isofluorane anesthesia in a light-tight chamber and wavelength-resolved spectral imaging was performed using a spectral imaging system (Maestro In Vivo Imaging System from Cambridge Research and Instrumentation).Citation12 The excitation filter was 503–555 nm. The tunable filter was automatically stepped in 10 nm increments from 580–900 nm with an exposure time of 49 ms for images captured at each wavelength. Collected images were analyzed by the Maestro software. Mice were killed after 3 months. Animals we injected with pimonidazole (60 mg/kg i.p. hypoxyprobe-1; Chemicon) and BrdU (30 mg/kg i.p.; Sigma-Aldrich) 1 h prior to killing.
Statistical analysis
Data were expressed as means ± standard deviation. Student’s t-test was used for single comparison. Multiple test was done using ANOVA with a Bonferroni post-hoc test. The correlation between TF immunoreactivity and patients’ clinical parameters was analyzed by χ2 and tests. Univariate and multivariate analyses were used to explore the correlations among patients’ prognoses, TF immunoreactivity and clinical parameters. All statistical analyses were performed using SPSS 13.0 and a p value less than 0.05 was considered as statistically significant.
| Abbreviations: | ||
| CRC | = | colorectal cancer |
| MMP | = | matrix metalloproteinase |
| H&E | = | hematoxylin and eosin |
| DMEM | = | Dulbecco modified Eagle medium |
| Ab | = | antibody |
| UPR | = | unfolded protein response |
| TF | = | tissue factor |
| TFi | = | tissue factor interfering RNA transfected group |
| Vec | = | empty vector transfected group |
Acknowledgments
This work was supported by the grants from the National Natural Science Foundation of China (No. 30872469) and National Natural Science Youth Foundation of China (No. 30801092).
Disclosure of Potential Conflicts of Interest
No potential conflicts of interest were disclosed.
References
- Cheng KC, Yeung YP, Lau PY, Meng WC. Surveillance and outcome of liver metastasis in patients with colorectal cancer who had undergone curative-intent operation. Hong Kong Med J 2008; 14:432 - 6; PMID: 19060341
- Sørbye H, Braendengen M, Balteskard L. Palliative chemotherapy and radiotherapy for metastatic colorectal cancer. Tidsskr Nor Laegeforen 2008; 128:194 - 7; PMID: 18202732
- Zucker S, Vacirca J. Role of matrix metalloproteinases (MMPs) in colorectal cancer. Cancer Metastasis Rev 2004; 23:101 - 17; http://dx.doi.org/10.1023/A:1025867130437; PMID: 15000152
- Kenific CM, Thorburn A, Debnath J. Autophagy and metastasis: another double-edged sword. Curr Opin Cell Biol 2010; 22:241 - 5; http://dx.doi.org/10.1016/j.ceb.2009.10.008; PMID: 19945838
- Klionsky DJ, Cregg JM, Dunn WA Jr., Emr SD, Sakai Y, Sandoval IV, et al. A unified nomenclature for yeast autophagy-related genes. Dev Cell 2003; 5:539 - 45; http://dx.doi.org/10.1016/S1534-5807(03)00296-X; PMID: 14536056
- Kang MR, Kim MS, Oh JE, Kim YR, Song SY, Kim SS, et al. Frameshift mutations of autophagy-related genes ATG2B, ATG5, ATG9B and ATG12 in gastric and colorectal cancers with microsatellite instability. J Pathol 2009; 217:702 - 6; http://dx.doi.org/10.1002/path.2509; PMID: 19197948
- Noda NN, Kumeta H, Nakatogawa H, Satoo K, Adachi W, Ishii J, et al. Structural basis of target recognition by Atg8/LC3 during selective autophagy. Genes Cells 2008; 13:1211 - 8; http://dx.doi.org/10.1111/j.1365-2443.2008.01238.x; PMID: 19021777
- Lee CJ, Chandrasekaran V, Wu S, Duke RE, Pedersen LG. Recent estimates of the structure of the factor VIIa (FVIIa)/tissue factor (TF) and factor Xa (FXa) ternary complex. Thromb Res 2010; 125:Suppl1 S7 - 10; http://dx.doi.org/10.1016/j.thromres.2010.01.022; PMID: 20156644
- Zerbib P, Grimonprez A, Corseaux D, Mouquet F, Nunes B, Petersen LC, et al. Inhibition of tissue factor-factor VIIa proteolytic activity blunts hepatic metastasis in colorectal cancer. J Surg Res 2009; 153:239 - 45; http://dx.doi.org/10.1016/j.jss.2008.05.014; PMID: 19062044
- Wang L, Yu C, Lu Y, He P, Guo J, Zhang C, et al. TMEM166, a novel transmembrane protein, regulates cell autophagy and apoptosis. Apoptosis 2007; 12:1489 - 502; http://dx.doi.org/10.1007/s10495-007-0073-9; PMID: 17492404
- Mukherjee S, Roth MJ, Dawsey SM, Yan W, Rodriguez-Canales J, Erickson HS, et al. Increased matrix metalloproteinase activation in esophageal squamous cell carcinoma. J Transl Med 2010; 8:91; http://dx.doi.org/10.1186/1479-5876-8-91; PMID: 20920372
- So MK, Xu C, Loening AM, Gambhir SS, Rao J. Self-illuminating quantum dot conjugates for in vivo imaging. Nat Biotechnol 2006; 24:339 - 43; http://dx.doi.org/10.1038/nbt1188; PMID: 16501578
- Zhang X, Yu H, Lou JR, Zheng J, Zhu H, Popescu NI, et al. MicroRNA-19 (miR-19) regulates tissue factor expression in breast cancer cells. J Biol Chem 2011; 286:1429 - 35; http://dx.doi.org/10.1074/jbc.M110.146530; PMID: 21059650
- Ogata M, Hino S, Saito A, Morikawa K, Kondo S, Kanemoto S, et al. Autophagy is activated for cell survival after endoplasmic reticulum stress. Mol Cell Biol 2006; 26:9220 - 31; http://dx.doi.org/10.1128/MCB.01453-06; PMID: 17030611
- Rak J, Milsom C, May L, Klement P, Yu J. Tissue factor in cancer and angiogenesis: the molecular link between genetic tumor progression, tumor neovascularization, and cancer coagulopathy. Semin Thromb Hemost 2006; 32:54 - 70; http://dx.doi.org/10.1055/s-2006-933341; PMID: 16479463
- Scheper GC, van der Knaap MS, Proud CG. Translation matters: protein synthesis defects in inherited disease. Nat Rev Genet 2007; 8:711 - 23; http://dx.doi.org/10.1038/nrg2142; PMID: 17680008
- Pavitt GD, Proud CG. Protein synthesis and its control in neuronal cells with a focus on vanishing white matter disease. Biochem Soc Trans 2009; 37:1298 - 310; http://dx.doi.org/10.1042/BST0371298; PMID: 19909266
- Lin W, Popko B. Endoplasmic reticulum stress in disorders of myelinating cells. Nat Neurosci 2009; 12:379 - 85; http://dx.doi.org/10.1038/nn.2273; PMID: 19287390
- Rouschop KM, van den Beucken T, Dubois L, Niessen H, Bussink J, Savelkouls K, et al. The unfolded protein response protects human tumor cells during hypoxia through regulation of the autophagy genes MAP1LC3B and ATG5. J Clin Invest 2010; 120:127 - 41; http://dx.doi.org/10.1172/JCI40027; PMID: 20038797
- Satoo K, Noda NN, Kumeta H, Fujioka Y, Mizushima N, Ohsumi Y, et al. The structure of Atg4B-LC3 complex reveals the mechanism of LC3 processing and delipidation during autophagy. EMBO J 2009; 28:1341 - 50; http://dx.doi.org/10.1038/emboj.2009.80; PMID: 19322194
- Kang MR, Kim MS, Oh JE, Kim YR, Song SY, Kim SS, et al. Frameshift mutations of autophagy-related genes ATG2B, ATG5, ATG9B and ATG12 in gastric and colorectal cancers with microsatellite instability. J Pathol 2009; 217:702 - 6; http://dx.doi.org/10.1002/path.2509; PMID: 19197948
- Deng L, Feng J, Broaddus RR. The novel estrogen-induced gene EIG121 regulates autophagy and promotes cell survival under stress. Cell Death Dis 2010; 1:e32; http://dx.doi.org/10.1038/cddis.2010.9; PMID: 21072319