Abstract
We have previously demonstrated that enhanced aerobic glycolysis and/or autophagy in the tumor stroma supports epithelial cancer cell growth and aggressive behavior, via the secretion of high-energy metabolites. These nutrients include lactate and ketones, as well as chemical building blocks, such as amino acids (glutamine) and nucleotides. Lactate and ketones serve as fuel for cancer cell oxidative metabolism, and building blocks sustain the anabolic needs of rapidly proliferating cancer cells. We have termed these novel concepts the “Reverse Warburg Effect,” and the “Autophagic Tumor Stroma Model of Cancer Metabolism.” We have also identified a loss of stromal caveolin-1 (Cav-1) as a marker of stromal glycolysis and autophagy. The aim of the current study was to provide genetic evidence that enhanced glycolysis in stromal cells favors tumorigenesis. To this end, normal human fibroblasts were genetically-engineered to express the two isoforms of pyruvate kinase M (PKM1 and PKM2), a key enzyme in the glycolytic pathway. In a xenograft model, fibroblasts expressing PKM1 or PKM2 greatly promoted the growth of co-injected MDA-MB-231 breast cancer cells, without an increase in tumor angiogenesis. Interestingly, PKM1 and PKM2 promoted tumorigenesis by different mechanism(s). Expression of PKM1 enhanced the glycolytic power of stromal cells, with increased output of lactate. Analysis of tumor xenografts demonstrated that PKM1 fibroblasts greatly induced tumor inflammation, as judged by CD45 staining. In contrast, PKM2 did not lead to lactate accumulation, but triggered a “pseudo-starvation” response in stromal cells, with induction of an NFκB-dependent autophagic program, and increased output of the ketone body 3-hydroxy-buryrate. Strikingly, in situ evaluation of Complex IV activity in the tumor xenografts demonstrated that stromal PKM2 expression drives mitochondrial respiration specifically in tumor cells. Finally, immuno-histochemistry analysis of human breast cancer samples lacking stromal Cav-1 revealed PKM1 and PKM2 expression in the tumor stroma. Thus, our data indicate that a subset of human breast cancer patients with a loss of stromal Cav-1 show profound metabolic changes in the tumor microenvironment. As such, this subgroup of patients may benefit therapeutically from potent inhibitors targeting glycolysis, autophagy and/or mitochondrial activity (such as metformin).
Introduction
In 1926, Otto Warburg observed that normal and tumor cells differ in their ability to metabolize glucose. He hypothesized that unlike most normal tissues, cancer cells rely upon glycolysis for energy production, despite the presence of sufficient oxygen (aerobic glycolysis or “the Warburg Effect”).Citation1 In addition, Warburg hypothesized that tumor cells develop mitochondrial dys-function that leads to impaired aerobic respiration and a switch toward glycolytic metabolism, with increased L-lactate production. However, subsequent studies showed that most tumor cells still maintain at least some mitochondrial function,Citation2,Citation3 suggesting that there might be a different explanation for the increased aerobic glycolysis of cancer cells.
Over the last decade, it has been increasingly recognized that the tumor microenvironment plays an important role in promoting tumor growth and metastasis. In particular, in vitro and in vivo studies have shown that breast and prostate cancer progression are highly dependent on cancer-associated fibroblasts (CAFs).Citation4,Citation5 CAFs are known to support tumor growthCitation6 and may play a key role in the acquisition of drug resistance in tumor cells.Citation7
We have recently proposed a new model to explain tumor metabolism. We have termed this new paradigm, “the Autophagic Tumor Stroma Model of Cancer Metabolism.”Citation8 In this new model, cancer cells induce oxidative stress and autophagy in cancer-associated fibroblasts, leading to a loss of stromal caveolin-1 (Cav-1). The activation of an autophagic program in the tumor microenvironment provides building blocks (amino acids, lipids and nucleotides) to sustain the anabolic needs of adjacent tumor cells. Using a co-culture system, we have also shown that MCF7 breast cancer cells have the ability to decrease mitochondrial activity in adjacent fibroblasts with the consequent induction of aerobic glycolysis.Citation9 Conversely, we have observed that in co-culture, MCF7 cells increase their mitochondrial mass and activity.Citation9 As a result of increased autophagy and mitophagy (mitochondria self-digestion), CAFs become dependent on aerobic glycolysis for sustaining their energy requirements. Increased aerobic glycolysis in stromal cells results in the increased production and secretion of lactate. Secreted L-lactate is transferred to adjacent cancer cells, and converted to pyruvate, thus functioning as a substrate for mitochondrial oxidative phosphorylation. We have termed this novel model, the “Reverse Warburg Effect.”Citation10 Importantly, in human breast cancer samples lacking stromal Cav-1, the transporter for the cellular extrusion of lactate (MCT4) is specifically upregulated in stromal cells, whereas the transporter for the uptake of lactate (MCT1) is specifically upregulated in epithelial cancer cells.Citation11
Thus, a loss of stromal Cav-1 is a marker of increased aerobic glycolysis and autophagy in CAFs.Citation12 Importantly, a loss of stromal Cav-1 predicts tamoxifen-resistance, advanced disease status, recurrence and poor clinical outcome in breast cancer.Citation13,Citation14 Breast cancer patients with a loss of stromal Cav-1 show a near 4-fold reduction in progression-free survival, relative to patients with positive expression of Cav-1 in the stroma.
The aim of the current study was to directly assess the tumor promoting effects of inducing aerobic glycolysis in stromal cells. To this end, we overexpressed the two isoforms of pyruvate kinase M (PKM1 and PKM2) in normal human fibroblasts. PKM is a rate-limiting glycolytic enzyme, and previous studies have shown that PKM1 is found mainly in normal cells, whereas PKM2 is an embryonic-isoform expressed in cancer cells.Citation15 Here, we employed a xenograft model of human breast cancer to evaluate the possible tumor promoting properties of PKM1 or PKM2 expression in the tumor microenvironment. Here, we show that recombinant overexpression of either PKM1 or PKM2 in human fibroblasts is sufficient to promote the growth of MDA-MB-231 breast cancer cells, increasing tumor mass and tumor volume, without an increase in tumor angiogenesis.
Interestingly, overexpression of PKM1 and PKM2 promotes tumor growth by different mechanism(s). We show that PKM1-expression drives increased lactate production in cancer-associated fibroblasts, as a reflection of increased aerobic glycolysis. Conversely, PKM2 overexpression promotes the activation of an autophagic program in stromal cells, and leads to increased ketone-body production. Both lactate, the end product of glycolysis, and ketone bodies can be taken up by epithelial cancer cells and utilized in oxidative mitochondrial metabolism. In support of this idea, we show that MDA-MB-231 cells co-cultured with fibroblasts overexpressing PKM1 or PKM2 greatly increase their mitochondrial activity. In vivo, we also show that stromal expression of PKM1 increases tumor inflammation, whereas stromal expression of PKM2 drives increased mitochondrial respiration in epithelial cancer cells.
Results
PKM1 and PKM2 are highly expressed in the stroma of human breast cancers lacking Cav-1.
Alterations in the microenvironment play a significant role in tumor development and progression. We have previously shown that a loss of stromal Cav-1 is a marker of a lethal tumor microenvironment, leading to the stromal upregulation of glycolytic enzymes and the induction of an autophagic program.Citation16 Using immuno-histochemistry, we demonstrated that human breast cancer samples lacking stromal Cav-1 display the upregulation of PKM2 in stromal fibroblasts.Citation10 However, it remains unknown if PKM1 expression is also correlated with the levels of stromal Cav-1.
To address this issue, human breast cancer samples lacking stromal Cav-1 were stained with antibodies directed against PKM1 and PKM2. In the top left panel of , Cav-1 staining is also shown, demonstrating the absence of Cav-1 expression in stromal cells. We have previously shown that, depending on the antibody, PKM2 displays two expression patterns in breast cancer samples lacking Cav-1. PKM2 can be localized intracellularly in stromal cells (, top right) or can be secreted extracellularly (, bottom right). Interestingly, (bottom left) shows that PKM1 is also localized in the stroma of tumors lacking Cav-1. Thus, it appears that the expression of both PKM1 and PKM2 is highly elevated in the stroma of human breast cancer samples lacking Cav-1.
Fibroblasts overexpressing PKM1, not PKM2, display increased lactate accumulation.
To dissect the role of stromal PKM isoform expression in tumor growth, we stably overexpressed PKM1 and PKM2 in immortalized human fibroblasts (). Studies have shown that PKM2 expression in cancer cells promotes a shift toward aerobic glycolysis, with increased lactate production.Citation17 Thus, we examined the effects of PKM1 and PKM2 expression on glucose metabolism in stromal cells. Lactate secretion was measured in the cell culture media of PKM1 and PKM2 overexpressing fibroblasts. Surprisingly, shows that fibroblasts overexpressing PKM1 display increased lactate secretion (∼1.5-fold), compared with fibroblasts overexpressing PKM2 or the empty vector (EV) control.
Fibroblasts overexpressing PKM2, not PKM1, exhibit the induction of autophagy.
We have recently shown that activation of an autophagic program in the tumor stroma promotes the growth of epithelial cancer cells, as autophagy leads to the generation of recycled chemical building blocks that can sustain the anabolic needs of tumor cells. To evaluate if stromal expression of PKM1 or PKM2 promotes autophagy, fibroblasts overexpressing PKM1 and PKM2 were subjected to protein blot analysis using a panel of autophagy markers.
demonstrates that PKM2 overexpression in fibroblasts drives the increased expression of mitophagy (BNIP3) and autophagy markers (Beclin-1 and Cathepsin B). Immuno-fluorescence analysis independently confirmed that PKM2 overexpression is sufficient to induce the expression of BNIP3, BNIP3L, and Beclin-1 in fibroblasts (). Conversely, fibroblasts overexpressing PKM1 did not display the induction of autophagy.
To gain insight into the mechanism(s) driving PKM2-induced autophagy, PKM1 and PKM2 fibroblasts were subjected to immuno-blot analysis with antibodies directed against phospho-NFκB and HIF1α, the two main transcription factors which induce autophagy.Citation18,Citation19 demonstrates that NFκB is specifically activated only in PKM2 overexpressing fibroblasts, with upregulation also of the total level of NFκB. However, HIF1α levels were unchanged.
To directly demonstrate that increased autophagy in PKM2 overexpressing fibroblasts is mediated via increased activation of the NFκB pathway, PKM2 overexpressing fibroblasts were treated with a specific NFκB inhibitor, namely PS-1145. shows that NFκB inhibition diminishes the expression of BNIP3 in a dose-dependent fashion.
PKM2 overexpression promotes the activation of ketone body metabolism in fibroblasts.
As PKM2 induces an autophagic program, which is normally activated during starvation, we investigated whether expression of PKM2 in human fibroblasts is sufficient to drive ketone body production.
Ketone bodies are produced during periods of starvation and serve as an alternative energy source. To this end, the levels of the ketone body β-hydroxy-butyrate were measured in the cell culture media derived from fibroblasts carrying either empty vector (EV), PKM1 or PKM2. shows that fibroblasts overexpressing PKM2 display a 1.4-fold increase in β-hydroxy-butyrate production (p ≤ 0.04). Conversely, fibroblasts overexpressing PKM1 show similar β-hydroxy-butyrate production, as the empty vector (EV) control.
These results were independently confirmed by immuno-blot analysis, using a panel of antibodies directed against key enzymes involved in ketone body production (HMGCS1, HMGCS2, HMGCL, and BDH1) and utilization (OXCT1 and OXCT2). shows that PKM2 overexpressing fibroblasts display increased expression of enzymes involved in both ketone body production and utilization. Conversely, PKM1 overexpressing fibroblasts exhibit a large decrease in the expression of these same enzymes. These data suggest that stromal expression of PKM2 drives increased ketone body production.
Fibroblasts overexpressing PKM1 and PKM2 increase the mitochondrial activity of adjacent breast cancer cells.
Our data indicate that fibroblasts expressing PKM1 display increased lactate production, whereas fibroblasts expressing PKM2 show increased ketone body production. Lactate or ketone bodies secreted by cancer-associated fibroblasts could be used by adjacent epithelial cancer cells as a source of energy to support mitochondrial respiration.
To evaluate if PKM fibroblasts promote the mitochondrial activity of adjacent breast cancer cells, we employed a co-culture system consisting of MDA-MB-231 breast cancer cells and fibroblasts carrying either empty vector (EV), PKM1, or PKM2. To distinguish the fibroblasts from the cancer cells, we employed GFP-positive MDA-MB-231 cells.
First, we assessed the mitochondrial activity of homotypic cultures of PKM1 and PKM2 overexpressing fibroblasts by immunofluorescence analysis with the mitochondrial dye MitoTracker. MitoTracker staining is thought to correlate with mitochondrial activity, because it labels only mitochondria with an active membrane potential. shows increased mitochondrial activity in fibroblasts overexpressing PKM1 and PKM2, relative to control cells. These results suggest that the nutrients secreted by PKM1- (lactate) or PKM2- (ketones) fibroblasts are re-utilized to self-support mitochondrial respiration.
Next, we determined the effects of PKM1-fibroblasts or PKM2-fibroblasts on co-cultured GFP positive MDA-MB-231 cells. shows that in the co-cultures of MDA-MB-231 cells with control EV-fibroblasts, the mitochondrial activity is slightly elevated in the cancer cell compartment (left panels). However, breast cancer cells co-cultured with either PKM1 or PKM2 fibroblasts display a very significant increase in mitochondrial activity relative to MDA-MB-231 cells co-cultured with control fibroblasts (middle and right panels).
These data suggest that overexpression of PKM1 or PKM2 in cancer-associated fibroblasts stimulates mitochondrial oxidative metabolism in adjacent breast cancer cells. In contrast, the mitochondrial activity is greatly reduced in PKM1 and PKM2 fibroblasts in co-culture with MDA-MB-231 cells, as compared with homotypic fibroblast cultures (compare the MitoTracker staining of the GFP-negative cells in with ).
PKM1 and PKM2 overexpressing fibroblasts do not exert any cytotoxic effects on MDA-MB-231 cells.
Lactate and ketone bodies are potentially acidic molecules and may alter the pH balance of the microenvironment. To evaluate if the increased secretion of lactate and ketones by PKM1 and PKM2 fibroblasts exerts any cytotoxic effects on cancer cells, we evaluated the apoptosis rates of GFP-positive MDA-MB-231 cells in co-culture with fibroblasts carrying either empty vector (EV), PKM1 or PKM2.
shows that MDA-MB-231 cells co-cultured with control fibroblasts are highly protected against apoptosis (∼7- to 8-fold) as compared with MDA-MB-231 cells cultured alone. However, co-culture with fibroblasts overexpressing PKM1 or PKM2 protects cancer cells against apoptosis, in a comparable way as control fibroblasts. These results indicate that lactate and ketones generated by PKM1 and PKM2 fibroblasts do not exert any cytotoxic effects on adjacent cancer cells.
We next evaluated the apoptotic rates in the fibroblast compartment. shows that fibroblasts overexpressing PKM1 and PKM2 display similar apoptotic rates as control (EV) fibroblasts. In addition, co-culture with MDA-MB-231 cells protects fibroblasts against apoptosis, independently of the genetic background of the fibroblasts.
Fibroblasts overexpressing PKM1 or PKM2 promote increased tumor growth, with reduced tumor angiogenesis.
To evaluate if PKM1 or PKM2 expression in stromal cells promotes tumor growth in vivo, we developed a human tumor xenograft model. To this end, fibroblasts expressing either empty vector (EV), PKM1 or PKM2 were co-injected with MDA-MB-231 cells in the flanks of immuno-deficient nude mice. Mice were sacrificed at 4 weeks post-injection.
shows that the overexpression of PKM2 in stromal cells promotes tumor growth, resulting in a 2-fold increase in tumor mass, and a 2.4-fold increase in tumor volume, relative to control fibroblasts. Similarly, fibroblasts expressing PKM1 also stimulate tumor growth relative to control fibroblasts, resulting in an 1.5-fold increase in tumor mass, and a 2-fold increase in tumor volume.
One possible mechanism to explain the tumor-promoting properties of PKM1 and PKM2 fibroblasts could be an increase in tumor angiogenesis. To test this hypothesis, frozen tumor sections were immuno-stained with anti-CD31 antibodies, and vessel density was quantitated. Interestingly, shows a significant decrease in vascular density (number of vessels per field) in the tumors containing PKM1 and PKM2 fibroblasts, suggesting that the tumor promoting effects of PKM1 and PKM2 cancer-associated fibroblasts are independent of angiogenesis. shows representative images of CD31 staining.
In vivo, stromal expression of PKM1 induces tumor inflammation, but stromal expression of PKM2 fuels cancer cell oxidative metabolism.
We next evaluated if increased inflammation is associated with the tumor-promoting properties of PKM1 and PKM2 fibroblasts. To this end, frozen tumor sections were immuno-stained with anti-CD45 antibodies, a marker of neutrophils and macrophages. shows that PKM1 overexpressing fibroblasts induce an important tumor inflammatory response, whereas PKM2 overexpressing fibroblasts did not show a significant increase in CD45 positive cells.
We next attempted to detect the mitochondrial activity in situ, using cytochrome C oxidase (COX) staining on xenograft tumor sections. This method is a well-established way to detect mitochondrial activity in skeletal muscle biopsies, and serves to evaluate the endogenous enzymatic activity of complex IV in situ.Citation20 To this end, frozen tumor sections were incubated in the presence of COX substrate (cytochrome C) and the colorimetric reaction was evaluated using the oxidation of the electron donor diaminobenzidine (DAB). shows that cancer cells display a strong increase in mitochondrial activity in PKM2-tumors, but not in PKM1-tumors, suggesting that fibroblasts overexpressing PKM2 promote mitochondrial respiration in adjacent cancer cells.
Taken together, our data indicate that the stromal expression of PKM1 and PKM2 both drive tumor growth by different mechanisms. Stromal PKM1 feeds tumor cells by increasing L-lactate secretion, and triggers a tumor inflammatory response. Conversely, stromal PKM2 increases ketone body secretion, supplies chemical building blocks via autophagy, and fuels cancer cell mitochondrial respiration.
Discussion
Role of stromal pyruvate kinase M in tumor-stroma metabolic coupling.
The Warburg Effect is described as the propensity of cancer cells to avidly convert glucose to lactate in the presence of normal oxygen conditions (aerobic glycolysis). This phenomenon was described over 90 years ago, but its biological significance still remains elusive.Citation1,Citation21,Citation22 It still remains unclear the reason why actively proliferating cancer cells with high energetic requirements would rely upon a less efficient energy source (glycolysis) to sustain their growth.Citation2,Citation23,Citation24
Pyruvate kinase is a key enzyme of the glycolytic pathway, converting phosphoenolpyruvate (PEP) into pyruvate with the generation of one molecule of ATP. The PKM1 and PKM2 isoforms are encoded by the same gene and result from the alternative splicing of exons 9 and 10.Citation25 Although still controversial,Citation26 studies have shown that PKM2 is preferentially expressed in tumor cells.Citation15 For this reason, the role of PKM1 in tumor formation and progression still remains largely unexplored.
Importantly, the enzymatic activity of PKM2 is regulated by its oligomerization status. In normal proliferating cells, PKM2 is mainly tetrameric and highly active, whereas in cancer cells, PKM2 is preferentially dimeric and shows low catalytic activity.Citation15 Despite reduced activity, PKM2 appears to support tumor growth, likely by increasing the availability of glycolytic intermediates as substrates for the anabolic needs of actively proliferating cells,Citation27,Citation28 or by promoting an alternate pathway that totally circumvent PKM.Citation29 This alternate pathway converts PEP to pyruvate without ATP generation, providing intermediates for cancer cell biosynthetic requirements. Post-translational modifications can also regulate and decrease PKM2 activity. For example, the glucose-dependent acetylation of PKM2 was shown to target PKM2 for degradation via an autophagic-mediated pathway, and to decrease PKM2 activity. Importantly, a PKM2 acetyl-mimetic mutant greatly promotes tumor growth in a xenograft model.Citation30
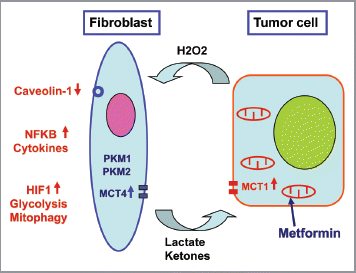
Our data suggest a novel mechanism to explain the tumor promoting properties of PKM expression (summarized in ). We show here that the expression of PKM1 and PKM2 in stromal cells promotes tumor growth, indicating that glycolytic stromal cells support aggressive tumor behavior. We also show for the first time that PKM1 is also tumor promoting.
Immuno-histochemical analysis of human breast cancers lacking stromal Cav-1 demonstrates the specific expression of PKM1 and PKM2 in the stromal compartment. To mimic these phenotypes, we recombinantly overexpressed PKM1 and PKM2 in fibroblasts. Importantly, fibroblasts overexpressing PKM1 and PKM2 greatly favored the growth of co-injected MDA-MB-231 breast cancer cells in a xenograft model. Interestingly, the tumor promoting phenotypes of PKM1 and PKM2 are independent of increased angiogenesis.
Mechanistically, we show that PKM1 and PKM2 fibroblasts promote tumorigenesis by different mechanism(s). Fibroblasts expressing PKM1 display increased lactate secretion, serving as a source of high-energy nutrients to fuel epithelial cancer growth. In addition, PKM1 expression triggers a profound tumor inflammatory response, as judged by the accumulation of CD45-positive cells. Conversely, PKM2 overexpression induces a pseudo-starvation condition, leading to an autophagic program with increased generation of building chemical blocks (lipids, nucleotides), and increased secretion of high-energy metabolites, i.e., ketone bodies. As a consequence, fibroblasts expressing PKM2 fuel the mitochondrial respiration of adjacent epithelial cancer cells, as judged by the enhanced in situ activity of mitochondrial complex IV.
Our data support a model whereby glycolytic and/or catabolic stromal cells support tumor growth. These results are fully supportive of the “Reverse Warburg Effect”Citation10 and the “Autophagic Tumor Stroma Model of Cancer Metabolism.”Citation8 The metaboliccoupling between stromal and cancer cells is reminiscent of the physiological intercellular co-operativity established during oogenesis between cumulus granulosa cells and oocytes. During folliculogenesis and oocyte development, cumulus cells surround the oocytes and metabolically support them, by the generation of high amounts of lactate and pyruvate.Citation31 Oocytes are unable to directly utilize glucose and perform glycolysis,Citation32 but promote the expression of glycolytic enzymes in granulosa cells.Citation33 As a consequence, granulosa cells generate high amounts of the glycolysis end products, such as lactate and pyruvate, that can be directly used by the oocyte to sustain their growth via mitochondrial respiration. Importantly, in situ hybridization has demonstrated the confinement of six glycolytic enzymes, including PKM2 and LDHA, to the cumulus cells.Citation34 Similarly, our current study indicates that stromal cells expressing PKM1 and PKM2 metabolically sustain the growth of adjacent cancer cells, in a type of symbiotic or parasitic relationship.
Consistent with the idea that cancer cells metabolically exploit host cells as parasites, recent studies have shown that pyruvate kinase deficiency, a common genetic cause of hemolytic anemia, provides protection against malaria in humansCitation35 and mice.Citation36 These results suggest that an intact glycolytic pathway in the host cells favors parasite infection.
Clinical relevance of PKM in cancer patients.
Plasma levels of tumor-M2-pyruvate kinase (Tu-M2-PK) can be used as a serum biomarker to predict disease severity and adverse clinical outcome. Tu-M2-PK levels are not only elevated in aggressive carcinomas, including breast,Citation37 pancreatic,Citation38 and lung cancers,Citation39 but are normalized after chemotherapy treatment,Citation37 indicating that Tu-M2-PK can also be used as a serum biomarker to follow treatment response.Citation37,Citation40 Our current studies are consistent with the use of Tu-M2-PK as a serum biomarker. Our data suggest that stromal cells, and not cancer cells, are the cellular source of serum Tu-M2-PK in aggressive tumors. We have also previously shown that PKM2 is secreted at high levels in the conditioned media of fibroblasts derived from Cav-1 (-/-) mice.Citation41 As loss of stromal Cav-1 is a marker of the tumor stroma metabolic-coupling in aggressive tumors, future studies will be needed to directly correlate the levels of serum Tu-M2-PK with stromal Cav-1 expression.
Attempts to directly correlate the expression of PKM2 in tumor cells with clinical outcome have failed to demonstrate a clear association between PKM2 expression and prognosis. PKM2 expression was found either undetectable in pancreatic cancer,Citation42 decreased in invasive breast cancer relative to adjacent normal tissue,Citation43 or associated with a more favorable prognosis in another breast cancer study.Citation44 In another study in hepatocellular carcinomas, the mRNA levels of PKM2 have been correlated with increased Ki67.Citation45 Unfortunately, most studies to date have focused on the expression of PKM2 in epithelial cancer cells and not in the tumor stroma. Future studies correlating the levels of stromal PKM1 and PKM2 with clinical outcome are warranted.
PKM2 and ketone body metabolism.
Our results indicate that ketone bodies can effectively serve as a source of energy for cancer cells, and unravel a novel role for PKM2 stromal expression in the ketone body generation. During periods of starvation, free fatty acids are converted into ketone bodies by the liver and are used as an alternative source for energy by the peripheral tissues and the brain. In the brain, astrocytes can also serve as a ketone body source supporting neuronal oxidative phosphorylation, in a process called the “astrocyte-neuron ketone body shuttle.”Citation46 The astrocyte's ability to produce ketone bodies is similar to that of hepatocytes and is, at least partially, AMPK-dependent.Citation47 One of the key enzymes for ketone body production, HMGCL, is found in astrocytes at a similar abundance as in the liver.Citation48 Astrocyte ketogenesis might be particularly important during periods of ischemia/hypoxia, in which anaerobic metabolism of glucose by astrocytes is stimulated leading to the local accumulation of lactate. However, hypoxia prevents the use of lactate as neuronal fuel, and lactate accumulation inhibits glycolysis by a negative feed-back mechanism. By contrast, ketone bodies can serve as a substrate for neuronal oxidative metabolism even during hypoxia, because oxidation of ketone body by neurons is not impaired during hypoxia.Citation49,Citation50 Ketone bodies require far less oxygen for their use in mitochondrial oxidative metabolism, behaving as a “super-fuel.”
We have previously observed increased ketone body production in Cav-1 (-/-) stromal cells and in the tumor stroma isolated from human breast cancers.Citation8 In addition, we have shown that administration of 3-hydroxy-butyrate increases tumor growth in a human breast cancer xenograft model.Citation51 Interestingly, transcriptional profiling of MCF7 cells treated with ketones identifies a ketogenic-gene signature that predicts poor clinical outcome in human breast cancer patients.Citation52 Here, we provide evidence of an unexpected link between the expression of PKM2 in the tumor stroma and enhanced ketone body output, possibly indicating that ketone body utilization by cancer cells is critical during tumor hypoxia.
PKM1, lactate and inflammation.
Our data indicate that PKM1 enhances stromal aerobic glycolysis and triggers a very important tumor inflammatory response. These results suggest a fairly unexplored link between inflammation and the metabolic remodeling of the tumor stroma. The association between inflammation and lactate accumulation is well explored in other pathological conditions, such as sepsis and wound healing.Citation53,Citation54 Previous studies have shown that macrophage migration inhibitory factor (MIF), an important mediator of systemic inflammatory response, induces glycolysis and lactate production in the skeletal muscle of animal models, indicating that inflammation may control host glucose metabolism.Citation55 In addition, L-lactate has been shown to be an active player in driving inflammation and innate immune activation.Citation56–Citation58 Consistent with these findings, our data show that PKM1 induces lactate accumulation and increases inflammation, suggesting that increased lactate output may be the molecular trigger driving tumor inflammation.
Despite the fact that expression of PKM2 in stromal cells is sufficient to induce NFκB activation, we do not observe an increased inflammatory response in PKM2-tumors. One possible explanation is that in PKM2 tumors, the inflammation may occur at the initial steps during tumor formation and may decline at later stages when the tumors were analyzed. Conversely, in PKM1 tumors, lactate accumulation may serve as a sustained trigger of inflammation, leading to massive tumor infiltration by inflammatory cells.
Previous studies have shown that a loss of stromal Cav-1 induces inflammation in the tumor microenvironment. Cav-1 (-/-) null mammary fat pads display infiltration with several inflammatory cell-types, including lymphocytes, T cells, macrophages and mast cells.Citation59 Also, we have previously subjected the tumor stroma of laser capture micro-dissected breast cancer samples, with Cav-1 negative vs. Cav-1 positive stroma, to genome-wide expression profiling.Citation60 Gene set enrichment analysis of this data identified a signature consistent with oxidative stress, hypoxia, autophagy and increased inflammation, in patients with Cav-1 negative tumor stroma.Citation60 Thus, we envision a scenario in which a loss of stromal Cav-1 induces aerobic glycolysis and inflammation, both key contributing factors to tumor progression and metastasis.
Materials and Methods
Materials.
Antibodies and their source were as follow: anti-Cav-1 (Santa Cruz, N20); anti-PKM1 (Proteintech, 15821-1-AP, affinity purified for IHC and crude serum for WB); anti-PKM2 (Proteintech for WB and IHC, 15822-1-AP; Cell Signaling for IHC, 3198); anti-Beclin-1 (Novus Biologicals for WB, NBP1-00085; Epitomics for IF, 2026-1); anti-BNIP3 (Abcam, ab10433); anti-BNIP3L BH3 Domain (Abgent, AP1320A); anti-cathepsin B (Santa Cruz, sc-13985); anti-NFκB (Cell Signaling, 3034); anti-phospho-NFκB (Cell Signaling, 3037); anti-cHMGCS (Santa Cruz, sc-33829); anti-mHMGCS (Santa Cruz, sc-33828); anti-HMGCL (Sigma-Aldrich, WH0003155M1); anti-BDH1 (Sigma-Aldrich, SAB1400024); anti-OXCT1 (Santa Cruz, sc-133988); anti-OXCT2 (Sigma-Aldrich, AV48886); anti-β-actin (Sigma-Aldrich, A5441).
Human breast cancer immunohistochemistry.
Formalin-fixed paraffin-embedded sections of human breast cancer samples were immuno-stained, as previously described.Citation10 Briefly, sections were deparaffinized, rehydrated and washed in PBS. Antigen retrieval was performed in 10 mM sodium citrate, pH 6.0 for 10 min using a pressure cooker. After blocking with 3% hydrogen peroxide for 10 min, sections were incubated with 10% goat serum for 1 h. Then, sections were incubated with primary antibodies overnight at 4°C. Antibody binding was detected using a biotinylated secondary (Vector Labs) followed by strepavidin-HRP (Dako). Immunoreactivity was revealed using 3,3′ diaminobenzidine. The slides were counterstained with hematoxylin, dehydrated and mounted with Permount mounting medium.
Cell culture.
Human skin immortalized fibroblasts (hTERT-BJ1) and human GFP-positive MDA-MB-231 breast cancer cells were maintained in Dulbecco's Modified Eagle's Medium (DMEM) containing 10% fetal bovine serum in a 37°C, 5% CO2 incubator. PS-1145 (Sigma) was incubated at the indicated concentration for 24 h.
Lentiviruses.
Lentiviral plasmids EX-NEG-Lv105 (empty vector), EX-Z5842-Lv105 (human PKM1) and EX-C0354-Lv105 (human PKM2) (all obtained from GeneCopoeia, Inc.) were transfected into GeneCopoeia 293Ta lentiviral packaging cells using Lenti-Pac HIV Expression Packaging Kit according to the manufacturer's instructions. After 48 h, lentivirus-containing culture medium was passed through a 0.45 µm filter and added to human fibroblasts in the presence of 5 µg/ml Polybrene. Infected fibroblasts were selected with 1.5 µg/ml puromycin.
Western blot analysis.
Cells were harvested in lysis buffer (10 mM Tris, pH 7.5, 150 mM NaCl, 1% Triton X-100, and 60 mM n-octyl-glucoside), containing protease (Roche Applied Science) and phosphatase inhibitors (Sigma). After rotation at 4°C for 40 min, cell lysates were centrifuged at 10,000 × g for 15 min at 4°C to remove insoluble debris. Protein concentrations were measured using the BCA reagent (Pierce). Cell lysates were then separated by SDS-PAGE (10×15% acrylamide) and transferred to nitrocellulose. After blocking for 1 h in TBST (10 mM Tris, pH 8.0, 150 mM NaCl, 0.05% Tween 20) supplemented with 5% nonfat dry milk, membranes were incubated with primary antibody diluted in TBST with 1% bovine serum albumin. Horseradish peroxidase-conjugated secondary antibodies [antimouse, 1:6000 dilution (Pierce) or anti-rabbit, 1:5000 dilution (BD PharMingen)] were used to visualize bound primary antibodies, with the Supersignal chemiluminescence substrate (Pierce).
L-lactate assay.
Cells were seeded (1.2 × 10⁵ per well) in 12-well plates in 250 µl of complete media in quadruplicate. The day after, the media was changed to DMEM containing 2% FBS. After 48 h, the media was collected. Lactate concentration was determined on cell culture media using the EnzyChrom L-Lactate Assay Kit (cat no. ECLC-100, BioAssay Systems), and was normalized for protein content.
Immuno-fluorescence.
Cells were plated onto glass coverslips in 12-well plates in 1 ml of complete media. The day after, the media was changed to DMEM without FBS (serum starvation). After 24 h, cells were washed three times in PBS with 0.1 mM CaCl2 and 1mM MgCl2 (PBS/CM) and fixed with 2% PFA for 30 min. Then, cells were rinsed with PBS/CM, permeabilized for 10 min in IF buffer (PBS/CM with 0.1% Triton X-100 and 0.2% BSA), and treated for 10 min with 25 mM NH4Cl in PBS to quench free aldehyde groups. After rinsing with PBS, cells were incubated for 1 h with primary antibodies, washed with IF buffer, and incubated for 30 min with fluorochrome-conjugated secondary antibodies. Finally, slides were washed with IF buffer, incubated with the nuclear stain DAPI and mounted.
Confocal microscopy.
Images were collected with a Zeiss LSM510 meta confocal system, using a 405 nm Diode excitation laser with a band pass filter of 420–480 nm, a 488 nm Argon excitation laser with a band pass filter of 505–550 nm, and a 543 nm HeNe excitation laser with a 561–604 nm filter. Images were acquired with a 60× objective.
β-hydroxybutyrate assay.
Cells were seeded at a density of 1.2 × 10⁵ in 12-well plates in 350 µl of complete media. The day after, the media was changed to DMEM without phenol red containing 2% FBS. After 48 h, the media were collected. β-Hydroxybutyrate concentration was determined using the β-Hydroxybutyrate (β-HB) Assay Kit (BioVision, K632-100), and was normalized for protein concentration.
Breast cancer cell-fibroblast co-cultures.
Fibroblasts (harboring EV, PKM1 or PKM2) and GFP-positive MDA-MB-231 cells were co-plated onto glass coverslips in 12-well plates in 1 ml of DMEM containing 10% NuSerum (BD Biosciences). Cells were seeded at a 5:1 fibroblast to MDA-MB-231 cell ratio and the total number of cells per well was 1 × 10⁵. As controls, cultures of fibroblasts and MDA-MB-231 cells alone were plated in parallel.
Mitochondrial staining.
To stain mitochondria, the rosamine-based MitoTracker Orange CMTMRos (Invitrogen, M7510) was used. Lyophilized MitoTracker product was dissolved in DMSO to a 1 mM stock solution. Then, the stock solution was diluted in serum-free DMEM to a final concentration of 25 nM. Cells were incubated with the pre-warmed MitoTracker staining solution for 12 min at 37°C. Then, cells were washed in PBS/CM three times and fixed with 2% PFA.
Annexin V apoptosis detection.
Apoptosis was quantified by Flow Cytometry using the Annexin V-Cy5 apoptosis detection kit, as the per manufacturer's instructions (Abcam). Briefly, GFP-positive MDA-MB-231 cells and fibroblasts (either EV, PKM1 or PKM2 fibroblasts) were plated as co-cultures or homotypic cultures in 12-well plates, as described above. After 48 h, cells were collected by centrifugation and resuspended in 500 µL of Annexin V Binding Buffer. Five microliters of Annexin V-Cy5 was added and incubated in the dark at room temperature for 5 min. Cells were then analyzed by flow cytometry using a GFP signal detector (to detect MDA-MB-231 cells) and a Cy5 signal detector (to detect Annexin V positive cells).
Animal studies.
All animals were housed and maintained in a barrier facility at the Kimmel Cancer Center at Thomas Jefferson University under National Institutes of Health (NIH) guidelines. Mice were kept on a 12 h light/dark cycle with ad libitum access to chow and water. Approval for all animal protocols used for this study was reviewed and approved by the Institutional Animal Care and Use Committee (IACUC). Briefly, 1 × 10⁶ MDA-MB-231 cancer cells were co-injected with 3 × 10⁵ fibroblasts (either EV, PKM1 or PKM2 fibroblasts) in 100 µl of sterile PBS into the flanks of athymic NCr nude mice (Taconic Farms, NCRNU, 6–8 weeks of age). After 4 weeks, mice were sacrificed, and tumors were dissected out to determine weight and size using calipers. Tumor volume was calculated using the formula X2Y/2, where X and Y are the short and long tumor dimensions, respectively. Tumors were either fixed with 10% formalin or flash-frozen in liquid nitrogen-cooled isopentane.
CD31 and CD45 immunohistochemistry.
For CD31 and CD45 staining, 6 µm frozen sections were fixed with 4% paraformaldehyde in PBS for 10 min at 4°C and washed 3× with PBS. A 3-step biotin-streptavidin-horseradish peroxidase method was used for antibody detection. After fixation, the sections were blocked with 10% rabbit serum and incubated overnight at 4°C with either rat monoclonal CD31 (BD Biosciences, 550274), or CD45 (BD Biosciences, 550539) antibody. The sections were then incubated with biotinylated rabbit anti-rat IgG (Vector Labs) and streptavidin-HRP (Dako). Immunoreactivity was revealed with 3,3′ diaminobenzidine.
Determination of mitochondrial activity in situ.
To assess the mitochondrial oxidative phosphorylation of tumor samples, the activity of cytochrome C oxidase (COX, complex IV) was determined in situ on frozen sections of tumor xenografts. Briefly, 7 µm thick cryostat sections from xenograft samples were prepared from frozen tumor samples (n = 4 per group) and stored at −80°C until use. To detect COX activity, frozen sections were equilibrated at room temperature, washed for 5 min with 25 mM sodium phosphate buffer pH 7.4, and then incubated for 30 min at 37°C with the COX staining solution. The COX solution consisted of 10 mg cytochrome C (C7752, Sigma), 10 mg 3,3′ diaminobenzidine tetrahydrochloride hydrate (D5637, Sigma), and 2 mg catalase (C1345, Sigma) in 10 ml of 25 mM sodium phosphate buffer. The solution was filtered after preparation and the pH adjusted to 7.2–7.4 with 1N NaOH. After incubation, the slides were rinsed in 25 mM phosphate buffer, fixed in 10% formalin for 5 min, and rinsed in tap water. The slides were counterstained with hematoxylin, dehydrated and coverslipped with permount mounting medium.
Statistical analysis.
Data were analyzed with the Student's t-test. P values lower than 0.05 were considered statistically significant.
Disclosure of Potential Conflicts of Interest
No potential conflicts of interest were disclosed.
Abbreviations
| CAFs | = | cancer-associated fibroblasts |
| Cav-1 | = | caveolin-1 |
| COX | = | cytochrome C oxidase |
| PKM | = | pyruvate kinase M |
Figures and Tables
Figure 1 PKM1 and PKM2 are highly expressed in the tumor stroma of human breast cancer samples lacking stromal Cav-1. Human breast cancer samples were immuno-stained with antibodies against Cav-1, PKM1, and PKM2. Antibodies directed against PKM1 and PKM2 are isoform-specific. Upper left panel: a representative example of a loss of Cav-1 staining in stromal cells is shown. Loss of Cav-1 expression occurs selectively in cancer-associated fibroblasts, but Cav-1 expression is retained in endothelial cells. Arrows indicate Cav-1 positive vessels. Right panels: PKM2 staining was performed using two different antibodies on human breast cancers lacking stromal Cav-1. Note that PKM2 expression is increased in the tumor stroma and displays two expression patterns. Upper right: PKM2 expression (detected with a Cell Signaling antibody) is largely confined within the stromal cells. Lower right: PKM2 (detected with a Proteintech antibody) can be also detected in the extracellular matrix of human breast cancers. Lower left panel: note that PKM1 is also upregulated in the stroma of human breast cancer samples lacking stromal Cav-1. Original magnification for all, 40×.
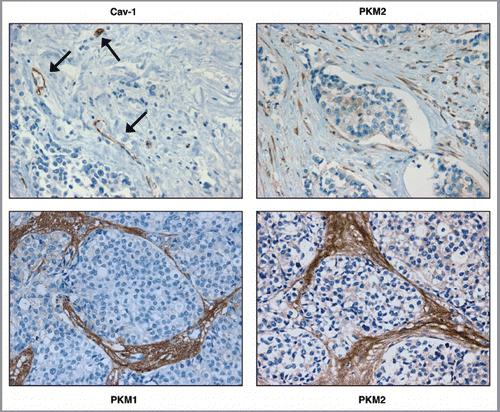
Figure 2 Overexpression of PKM1 and PKM2 in human fibroblasts. Human immortalized fibroblasts (hTERT-BJ1) were transduced with empty vector (EV), PKM1 or PKM2 lentiviral particles. After selection with puromycin, the cellular pools were subjected to immunoblot analysis to confirm PKM1 and PKM2 overexpression. Immunoblotting with β-actin is shown as an equal loading control.
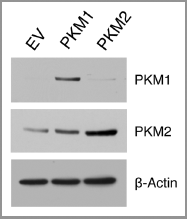
Figure 3 PKM1 induces increased lactate production in fibroblasts. EV, PKM1 or PKM2 fibroblasts were grown for 48 h in media supplemented with 2% FBS. Then, the media was collected and subjected to a biochemical analysis to determine lactate content. The graph shows that PKM1 overexpressing fibroblasts display a 1.5-fold increase in lactate secretion, as compared with control empty vector (EV) cells. In contrast, PKM2 overexpressing fibroblasts show similar lactate production as control cells. p = 0.04.
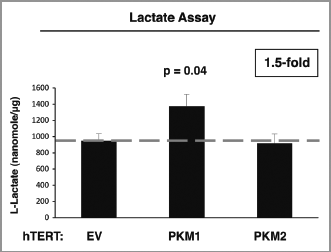
Figure 4 PKM2 overexpression induces NFκB-dependent autophagy in fibroblasts. (A) Western blot. Cells were analyzed by immuno-blot analysis using antibodies directed against a panel of autophagy markers. Note that fibroblasts harboring PKM2 show increased expression of the autophagy markers BNIP3, Beclin-1, and Cathepsin B (active form). Conversely, PKM1 did not induce autophagy. β-actin was used as equal loading control. (B) Immunofluorescence. After 24 h of serum starvation, cells were fixed and immuno-stained with antibodies against Beclin-1, BNIP3 and BNIP3L (all red). DAPI was used to visualize nuclei (blue). Note that PKM2 overexpression promotes an autophagic program in fibroblasts. No effects were observed in PKM1 overexpressing cells. (C) PKM2 induces NFκB activation. To gain insights into the molecular drivers of increased autophagy in PKM2 fibroblasts, cells were analyzed by immuno-blot analysis using antibodies directed against phospho-NFκB and HIF1α. Note that fibroblasts overexpressing PKM2 show increased activation and expression levels of NFκB. Conversely, NFκB is not activated in PKM1 cells. In addition, PKM1 and PKM2 do not stabilize HIF1α expression in fibroblasts. β-actin was used as equal loading control. (D) PKM2-induced autophagy is NFκB-dependent. PKM2 overexpressing fibroblasts were treated with increasing concentration of the NFκB inhibitor PS-1145 for 24 h. Then, cells were analyzed by immuno-blot analysis with antibodies against BNIP3. Note that NFκB inhibition reduces the expression levels of BNIP3 (an autophagy marker) in a dose-dependent manner. β-actin was used as equal loading control.
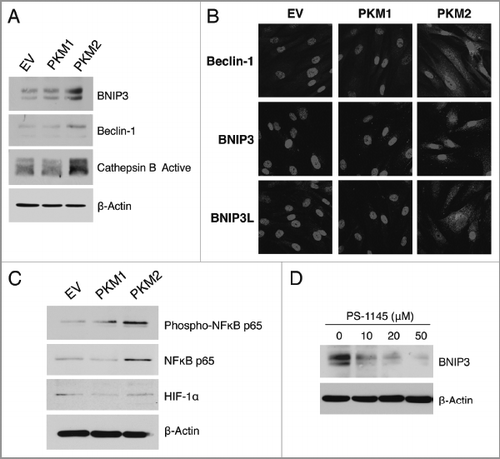
Figure 5 Stromal expression of PKM2 promotes ketone body metabolism. (A) β-hydroxybutyrate assay. The β-Hydroxybutyrate (β-OH-butyrate) concentration was measured in the cell culture media of EV, PKM1 and PKM2 fibroblasts, and was normalized for protein concentration. Note that fibroblasts overexpressing PKM2 display a 1.4-fold increase in β-Hydroxybutyrate accumulation relative to control empty vector (EV) fibroblasts. Fibroblasts overexpressing PKM1 show β-Hydroxybutyrate production as control cells. (B) Western blot analysis. Fibroblasts expressing EV, PKM1 or PKM2 were analyzed by immuno-blot with a panel of antibodies against key enzymes of ketone body metabolism (both production and utilization). Note that PKM2-fibroblasts show elevated expression of the enzymes involved in ketone production (HMGCS1, HMGCS2 HMGCL, and BDH1), and ketone utilization (OXCT1 and OXCT2). Conversely, expression of PKM1 in fibroblasts abrogates the expression of enzymes involved in ketone production (HMGCS1, HMGCS2), and ketone utilization (OXCT1 and OXCT2) relative to EV-fibroblasts. These data indicate that ketone body metabolism is activated by PKM2, but abolished by PKM1. β-actin was used as equal loading control.
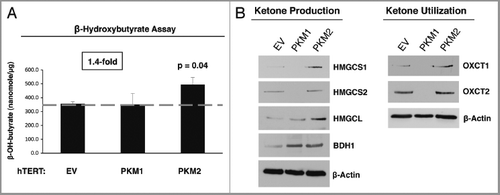
Figure 6 Fibroblasts overexpressing PKM1 and PKM2 promote mitochondrial activity in adjacent cancer cells. MitoTracker staining was used to visualize mitochondrial activity in homotypic cultures and in co-cultures of fibroblasts and GFP-positive MDA-MB-231 cells. DAPI was used to visualize nuclei (blue). (A) Fibroblast homotypic cultures. Note that fibroblasts expressing PKM1 or PKM2 exhibit high levels of MitoTracker staining (red) relative to empty vector (EV) control cells, consistent with increased mitochondrial activity. (B) Co-cultures. Note that fibroblasts expressing PKM1 or PKM2 increase the MitoTracker staining (red) of adjacent GFP-positive MDA-MB-231 cells (green), relative to empty vector (EV) control cells. In the top panels, only the red channel is shown, to appreciate the increased MitoTracker staining of cancer cells. The white stars identify the nuclei of GFP positive MDA-MB-231 cells. In addition, PKM1 and PKM2 fibroblasts co-cultured with cancer cells show reduced MitoTracker staining compared with respective homotypic cultures (compare panel A and B).
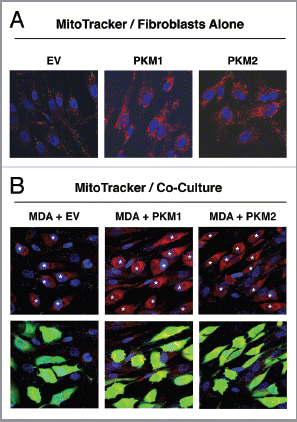
Figure 7 PKM1 and PKM2 overexpressing fibroblasts do not induce apoptosis in co-cultured breast cancer cells. GFP-positive MDA-MB-231 cells were co-cultured either with EV, PKM1 or PKM2 fibroblasts. Corresponding homotypic cultures were established in parallel. To measure apoptosis, cells were subjected to Annexin-V staining and analyzed by FACS. Thus, the GFP (+) and GFP (−) cells represent breast cancer cells and fibroblasts, respectively. (A) Apoptotic rates of co-cultured MDA-MB-231 cells. MDA-MB-231 cells maintained in co-culture with EV control fibroblasts show a 7-fold reduction in apoptosis, as compared with MDA-MB-231 cells cultured alone. Interestingly, MDA-MB-231 cells co-cultured either with PKM1 or PKM2 fibroblasts display a similar protection against apoptosis, indicating that PKM1 and PKM2 fibroblasts do not impart any toxicity effects. (B) Apoptotic rates of co-cultured fibroblasts. When maintained in co-culture with MDA-MB-231 cells, EV, PKM1 or PKM2 fibroblasts display an up to 2-fold reduction in apoptosis.
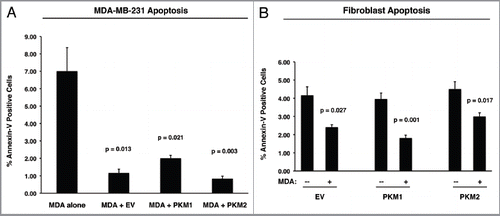
Figure 8 Fibroblasts overexpressing PKM1 and PKM2 promote breast cancer tumor growth, with decreased angiogenesis. (A) Tumor growth. We used a xenograft model employing MDA-MB-231 breast cancer cells co-injected with either EV, PKM1 or PKM2 fibroblasts into the flanks of athymic nude mice. Tumor weights and volumes were measured at 4 weeks post-injection. Note that fibroblasts overexpressing PKM2 greatly promote tumor growth, resulting in a 2-fold increase in tumor weight, and a 2.4-fold increase in tumor volume. Similarly, fibroblasts overexpressing PKM1 augment tumor growth, inducing a 1.5-fold increase in tumor weight, and a 2-fold increase in tumor volume. P values are as shown. n = 10 tumors per experimental group. (B and C) Tumor Angiogenesis. Tumor frozen sections were cut and immuno-stained with anti-CD31 antibodies. (B) Vascular density (number of vessels per field) quantification. Note that a significant decrease (1.3- to 1.5-fold) in vessel density was observed, suggesting that the tumor promoting effects of fibroblasts harboring PKM1 or PKM2 are independent of angiogenesis. P values are as shown. (C) Representative images of CD31 immuno-staining. Original magnification, 40×.
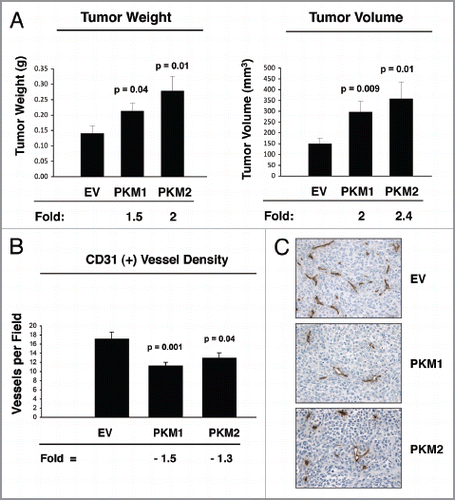
Figure 9 Fibroblasts overexpressing PKM1 promote an inflammatory response in tumor tissue. To evaluate inflammation, frozen sections of the tumor xenograft were analyzed using CD45 antibodies, detecting nucleated hematopoietic cells, including neutrophils and macrophages. Note that CD45 is highly expressed in PKM1-tumors, indicative of a significant increase in the inflammatory response. Original magnification, 40×.
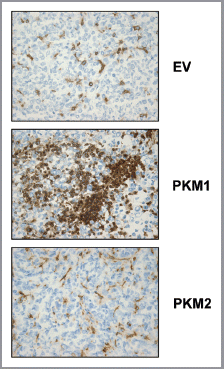
Figure 10 Fibroblasts overexpressing PKM2 induce oxidative mitochondrial activity in breast cancer cells in vivo. To evaluate mitochondrial activity in situ, the activity of Complex IV was detected via COX (Cytochrome C Oxidase) activity staining of frozen sections derived from tumor xenografts. Note that COX activity is increased specifically in the cancer cells of PKM2-tumors. Conversely, PKM1-tumors do not display increased mitochondrial activity. Original magnification, 60×.
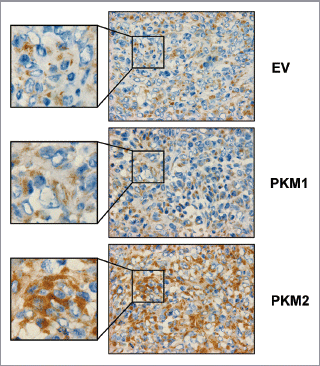
Figure 11 Pyruvate kinase expression (PKM1 and PKM2) in cancer associated fibroblasts drives tumor growth. Cancer cells secrete hydrogen peroxide (H2O2) which initiates oxidative stress in adjacent stromal fibroblasts. This, in turn, drives the activation of two main transcription factors, namely HIF1 and NFκB. NFκB is the master regulator of the innate immune response, resulting in the secretion of inflammatory cytokines. HIF1-α stabilization induces autophagy, mitophagy, and aerobic glycolysis. As a consequence, PKM1 and PKM2 expression results in the production of excess L-lactate and ketone bodies (3-hydroxy-butyrate) that are extruded via a mono-carboxylate transporter, known as MCT4. These high-energy nutrients are then taken up and recycled by cancer cells using another mono-carboxylate transporter, namely MCT1. Thus, L-lactate and ketones produced by stromal fibroblasts are transferred to cancer cells and used as fuel for mitochondrial oxidative metabolism (OXPHOS), producing large amounts of ATP. This model explains the anti-cancer activity of Metformin, a diabetic drug, that mechanistically functions as a mitochondrial “poison,” as it is a specific inhibitor of mitochondrial complex I. Complex I is a key part of the electron transport system for generating ATP. Note also that a loss of stromal Caveolin-1 (Cav-1) occurs, as it is degraded by stromal autophagy. Loss of stromal Cav-1 further perpetuates oxidative stress, and is a powerful biomarker for predicting early tumor recurrence, metastasis, and drug-resistance, as well as poor clinical outcome in breast cancer patients.
Acknowledgments
F.S. and her laboratory were supported by grants from the Breast Cancer Alliance (BCA) and the American Cancer Society (ACS). U.E.M. was supported by a Young Investigator Award from the Margaret Q. Landenberger Research Foundation. M.P.L. was supported by grants from the NIH/NCI (R01-CA-080250, R01-CA-098779, R01-CA-120876 and R01-AR-055660), and the Susan G. Komen Breast Cancer Foundation. A.K.W was supported by a Susan G. Komen Career Catalyst Grant. R.G.P. was supported by grants from the NIH/NCI (R01-CA-70896, R01-CA-75503, R01-CA-86072 and R01-CA-107382) and the Dr. Ralph and Marian C. Falk Medical Research Trust. The Kimmel Cancer Center was supported by the NIH/NCI Cancer Center Core grant P30-CA-56036 (to R.G.P.). Funds were also contributed by the Margaret Q. Landenberger Research Foundation (to M.P.L.). This project is funded, in part, under a grant with the Pennsylvania Department of Health (to M.P.L. and F.S.). The Department specifically disclaims responsibility for any analyses, interpretations or conclusions. This work was also supported, in part, by a Centre grant in Manchester from Breakthrough Breast Cancer in the UK (to A.H.) and an Advanced ERC Grant from the European Research Council.
References
- Warburg O. On the origin of cancer cells. Science 1956; 123:309 - 314; PMID: 13298683; http://dx.doi.org/10.1126/science.123.3191.309
- Guppy M, Leedman P, Zu X, Russell V. Contribution by different fuels and metabolic pathways to the total ATP turnover of proliferating MCF-7 breast cancer cells. Biochem J 2002; 364:309 - 315; PMID: 11988105
- Kallinowski F, Vaupel P, Runkel S, Berg G, Fortmeyer HP, Baessler KH, et al. Glucose uptake, lactate release, ketone body turnover, metabolic micromilieu, and pH distributions in human breast cancer xenografts in nude rats. Cancer Res 1988; 48:7264 - 7272; PMID: 3191497
- Kalluri R, Zeisberg M. Fibroblasts in cancer. Nat Rev Cancer 2006; 6:392 - 401; PMID: 16572188; http://dx.doi.org/10.1038/nrc1877
- Karnoub AE, Dash AB, Vo AP, Sullivan A, Brooks MW, Bell GW, et al. Mesenchymal stem cells within tumour stroma promote breast cancer metastasis. Nature 2007; 449:557 - 563; PMID: 17914389; http://dx.doi.org/10.1038/nature06188
- Orimo A, Gupta PB, Sgroi DC, Arenzana-Seisdedos F, Delaunay T, Naeem R, et al. Stromal fibroblasts present in invasive human breast carcinomas promote tumor growth and angiogenesis through elevated SDF-1/CXCL12 secretion. Cell 2005; 121:335 - 348; PMID: 15882617; http://dx.doi.org/10.1016/j.cell.2005.02.034
- Martinez-Outschoorn UE, Lin Z, Ko YH, Goldberg AF, Flomenberg N, Wang C, et al. Understanding the metabolic basis of drug resistance: Therapeutic induction of the Warburg effect kills cancer cells. Cell Cycle 2011; 10:2521 - 2528; PMID: 21768775; http://dx.doi.org/10.4161/cc.10.15.16584
- Pavlides S, Tsirigos A, Migneco G, Whitaker-Menezes D, Chiavarina B, Flomenberg N, et al. The autophagic tumor stroma model of cancer: Role of oxidative stress and ketone production in fueling tumor cell metabolism. Cell Cycle 2010; 9:3485 - 3505; PMID: 20861672; http://dx.doi.org/10.4161/cc.9.17.12721
- Martinez-Outschoorn UE, Balliet RM, Rivadeneira DB, Chiavarina B, Pavlides S, Wang C, et al. Oxidative stress in cancer associated fibroblasts drives tumor-stroma co-evolution: A new paradigm for understanding tumor metabolism, the field effect and genomic instability in cancer cells. Cell Cycle 2010; 9:3256 - 3276; PMID: 20814239; http://dx.doi.org/10.4161/cc.9.16.12553
- Pavlides S, Whitaker-Menezes D, Castello-Cros R, Flomenberg N, Witkiewicz AK, Frank PG, et al. The reverse Warburg effect: aerobic glycolysis in cancer associated fibroblasts and the tumor stroma. Cell Cycle 2009; 8:3984 - 4001; PMID: 19923890; http://dx.doi.org/10.4161/cc.8.23.10238
- Whitaker-Menezes D, Martinez-Outschoorn UE, Lin Z, Ertel A, Flomenberg N, Witkiewicz AK, et al. Evidence for a stromal-epithelial “lactate shuttle” in human tumors: MCT4 is a marker of oxidative stress in cancer-associated fibroblasts. Cell Cycle 2011; 10:1772 - 1783; PMID: 21558814; http://dx.doi.org/10.4161/cc.10.11.15659
- Martinez-Outschoorn UE, Trimmer C, Lin Z, Whitaker-Menezes D, Chiavarina B, Zhou J, et al. Autophagy in cancer associated fibroblasts promotes tumor cell survival: Role of hypoxia, HIF1 induction and NFkappaB activation in the tumor stromal microenvironment. Cell Cycle 2010; 9:3515 - 3533; PMID: 20855962; http://dx.doi.org/10.4161/cc.9.17.12928
- Witkiewicz AK, Dasgupta A, Sotgia F, Mercier I, Pestell RG, Sabel M, et al. An absence of stromal caveolin-1 expression predicts early tumor recurrence and poor clinical outcome in human breast cancers. Am J Pathol 2009; 174:2023 - 2034; PMID: 19411448; http://dx.doi.org/10.2353/ajpath.2009.080873
- Sloan EK, Ciocca DR, Pouliot N, Natoli A, Restall C, Henderson MA, et al. Stromal cell expression of caveolin-1 predicts outcome in breast cancer. Am J Pathol 2009; 174:2035 - 2043; PMID: 19411449; http://dx.doi.org/10.2353/ajpath.2009.080924
- Mazurek S, Boschek CB, Hugo F, Eigenbrodt E. Pyruvate kinase type M2 and its role in tumor growth and spreading. Semin Cancer Biol 2005; 15:300 - 308; PMID: 15908230; http://dx.doi.org/10.1016/j.semcancer.2005.04.009
- Sotgia F, Martinez-Outschoorn UE, Pavlides S, Howell A, Pestell RG, Lisanti MP. Understanding the Warburg effect and the prognostic value of stromal caveolin-1 as a marker of a lethal tumor microenvironment. Breast Cancer Res 2011; 13:213; PMID: 21867571; http://dx.doi.org/10.1186/bcr2892
- Hitosugi T, Kang S, Vander Heiden MG, Chung TW, Elf S, Lythgoe K, et al. Tyrosine phosphorylation inhibits PKM2 to promote the Warburg effect and tumor growth. Sci Signal 2009; 2:ra73; PMID: 19920251; http://dx.doi.org/10.1126/scisignal.2000431
- Bellot G, Garcia-Medina R, Gounon P, Chiche J, Roux D, Pouyssegur J, et al. Hypoxia-induced autophagy is mediated through hypoxia-inducible factor induction of BNIP3 and BNIP3L via their BH3 domains. Mol Cell Biol 2009; 29:2570 - 2581; PMID: 19273585; http://dx.doi.org/10.1128/MCB.00166-09
- Criollo A, Senovilla L, Authier H, Maiuri MC, Morselli E, Vitale I, et al. The IKK complex contributes to the induction of autophagy. EMBO J 2010; 29:619 - 631; PMID: 19959994; http://dx.doi.org/10.1038/emboj.2009.364
- Smeitink J, van den Heuvel L, DiMauro S. The genetics and pathology of oxidative phosphorylation. Nat Rev Genet 2001; 2:342 - 352; PMID: 11331900; http://dx.doi.org/10.1038/35072063
- Vander Heiden MG, Cantley LC, Thompson CB. Understanding the Warburg effect: the metabolic requirements of cell proliferation. Science 2009; 324:1029 - 1033; PMID: 19460998; http://dx.doi.org/10.1126/science.1160809
- Warburg O. On respiratory impairment in cancer cells. Science 1956; 124:269 - 270; PMID: 13351639
- Guppy M. The hypoxic core: a possible answer to the cancer paradox. Biochem Biophys Res Commun 2002; 299:676 - 680; PMID: 12459193; http://dx.doi.org/10.1016/S0006-291X(02)02710-9
- Zu XL, Guppy M. Cancer metabolism: facts, fantasy, and fiction. Biochem Biophys Res Commun 2004; 313:459 - 465; PMID: 14697210; http://dx.doi.org/10.1016/j.bbrc.2003.11.136
- Noguchi T, Inoue H, Tanaka T. The M1- and M2-type isozymes of rat pyruvate kinase are produced from the same gene by alternative RNA splicing. J Biol Chem 1986; 261:13807 - 13812; PMID: 3020052
- Bluemlein K, Gruning NM, Feichtinger RG, Lehrach H, Kofler B, Ralser M. No evidence for a shift in pyruvate kinase PKM1 to PKM2 expression during tumorigenesis. Oncotarget 2011; 2:393 - 400; PMID: 21789790
- Mazurek S, Michel A, Eigenbrodt E. Effect of extracellular AMP on cell proliferation and metabolism of breast cancer cell lines with high and low glycolytic rates. J Biol Chem 1997; 272:4941 - 4952; PMID: 9030554; http://dx.doi.org/10.1074/jbc.272.8.4941
- Christofk HR, Vander Heiden MG, Wu N, Asara JM, Cantley LC. Pyruvate kinase M2 is a phosphotyrosine-binding protein. Nature 2008; 452:181 - 186; PMID: 18337815; http://dx.doi.org/10.1038/nature06667
- Vander Heiden MG, Locasale JW, Swanson KD, Sharfi H, Heffron GJ, Amador-Noguez D, et al. Evidence for an alternative glycolytic pathway in rapidly proliferating cells. Science 2010; 329:1492 - 1499; PMID: 20847263; http://dx.doi.org/10.1126/science.1188015
- Lv L, Li D, Zhao D, Lin R, Chu Y, Zhang H, et al. Acetylation targets the M2 isoform of pyruvate kinase for degradation through chaperone-mediated autophagy and promotes tumor growth. Mol Cell 2011; 42:719 - 730; PMID: 21700219; http://dx.doi.org/10.1016/j.molcel.2011.04.025
- Leese HJ, Barton AM. Production of pyruvate by isolated mouse cumulus cells. J Exp Zool 1985; 234:231 - 236; PMID: 3998681; http://dx.doi.org/10.1002/jez.1402340208
- Biggers JD, Whittingham DG, Donahue RP. The pattern of energy metabolism in the mouse oocyte and zygote. Proc Natl Acad Sci USA 1967; 58:560 - 567; PMID: 5233459; http://dx.doi.org/10.1073/pnas.58.2.560
- Sugiura K, Su YQ, Diaz FJ, Pangas SA, Sharma S, Wigglesworth K, et al. Oocyte-derived BMP15 and FGFs cooperate to promote glycolysis in cumulus cells. Development 2007; 134:2593 - 2603; PMID: 17553902; http://dx.doi.org/10.1242/dev.006882
- Sugiura K, Pendola FL, Eppig JJ. Oocyte control of metabolic cooperativity between oocytes and companion granulosa cells: energy metabolism. Dev Biol 2005; 279:20 - 30; PMID: 15708555; http://dx.doi.org/10.1016/j.ydbio.2004.11.027
- Ayi K, Min-Oo G, Serghides L, Crockett M, Kirby-Allen M, Quirt I, et al. Pyruvate kinase deficiency and malaria. N Engl J Med 2008; 358:1805 - 1810; PMID: 18420493; http://dx.doi.org/10.1056/NEJMoa072464
- Min-Oo G, Fortin A, Tam MF, Nantel A, Stevenson MM, Gros P. Pyruvate kinase deficiency in mice protects against malaria. Nat Genet 2003; 35:357 - 362; PMID: 14595440; http://dx.doi.org/10.1038/ng1260
- Lüftner D, Mesterharm J, Akrivakis C, Geppert R, Petrides PE, Wernecke KD, et al. Tumor type M2 pyruvate kinase expression in advanced breast cancer. Anticancer Res 2000; 20:5077 - 5082; PMID: 11326672
- Goonetilleke KS, Mason JM, Siriwardana P, King NK, France MW, Siriwardena AK. Diagnostic and prognostic value of plasma tumor M2 pyruvate kinase in periampullary cancer: evidence for a novel biological marker of adverse prognosis. Pancreas 2007; 34:318 - 324; PMID: 17414054; http://dx.doi.org/10.1097/MPA.0b013e31802ee9c7
- Schneider J, Morr H, Velcovsky HG, Weisse G, Eigenbrodt E. Quantitative detection of tumor M2-pyruvate kinase in plasma of patients with lung cancer in comparison to other lung diseases. Cancer Detect Prev 2000; 24:531 - 535; PMID: 11198266
- Schneider J, Neu K, Grimm H, Velcovsky HG, Weisse G, Eigenbrodt E. Tumor M2-pyruvate kinase in lung cancer patients: immunohistochemical detection and disease monitoring. Anticancer Res 2002; 22:311 - 318; PMID: 12017309
- Bonuccelli G, Whitaker-Menezes D, Castello-Cros R, Pavlides S, Pestell RG, Fatatis A, et al. The reverse Warburg effect: Glycolysis inhibitors prevent the tumor promoting effects of caveolin-1 deficient cancer associated fibroblasts. Cell Cycle 2010; 9:1960 - 1971; PMID: 20495363; http://dx.doi.org/10.4161/cc.9.10.11601
- Aloysius MM, Zaitoun AM, Bates TE, Albasri A, Ilyas M, Rowlands BJ, et al. Complete absence of M2-pyruvate kinase expression in benign pancreatic ductal epithelium and pancreaticobiliary and duodenal neoplasia. BMC Cancer 2009; 9:327; PMID: 19754967; http://dx.doi.org/10.1186/1471-2407-9-327
- Schmidt M, Voelker HU, Kapp M, Krockenberger M, Dietl J, Kammerer U. Glycolytic phenotype in breast cancer: activation of Akt, up-regulation of GLUT1, TKTL1 and down-regulation of M2PK. J Cancer Res Clin Oncol 2010; 136:219 - 225; PMID: 19655166; http://dx.doi.org/10.1007/s00432-009-0652-y
- Benesch C, Schneider C, Voelker HU, Kapp M, Caffier H, Krockenberger M, et al. The clinicopathological and prognostic relevance of pyruvate kinase M2 and pAkt expression in breast cancer. Anticancer Res 2010; 30:1689 - 1694; PMID: 20592362
- Kitamura K, Hatano E, Higashi T, Narita M, Seo S, Nakamoto Y, et al. Proliferative activity in hepatocellular carcinoma is closely correlated with glucose metabolism but not angiogenesis. J Hepatol 2011; 55:846 - 857; PMID: 21334407; http://dx.doi.org/10.1016/j.jhep.2011.01.038
- Guzmán M, Blazquez C. Is there an astrocyte-neuron ketone body shuttle?. Trends Endocrinol Metab 2001; 12:169 - 173; PMID: 11295573; http://dx.doi.org/10.1016/S1043-2760(00)00370-2
- Blázquez C, Woods A, de Ceballos ML, Carling D, Guzman M. The AMP-activated protein kinase is involved in the regulation of ketone body production by astrocytes. J Neurochem 1999; 73:1674 - 1682; PMID: 10501215
- Cullingford TE, Dolphin CT, Bhakoo KK, Peuchen S, Canevari L, Clark JB. Molecular cloning of rat mitochondrial 3-hydroxy-3-methylglutaryl-CoA lyase and detection of the corresponding mRNA and of those encoding the remaining enzymes comprising the ketogenic 3-hydroxy-3-methylglutaryl-CoA cycle in central nervous system of suckling rat. Biochem J 1998; 329:373 - 381; PMID: 9425122
- Izumi Y, Ishii K, Katsuki H, Benz AM, Zorumski CF. beta-Hydroxybutyrate fuels synaptic function during development. Histological and physiological evidence in rat hippocampal slices. J Clin Invest 1998; 101:1121 - 1132; PMID: 9486983; http://dx.doi.org/10.1172/JCI1009
- Masuda R, Monahan JW, Kashiwaya Y. D-beta-hydroxybutyrate is neuroprotective against hypoxia in serum-free hippocampal primary cultures. J Neurosci Res 2005; 80:501 - 509; PMID: 15825191; http://dx.doi.org/10.1002/jnr.20464
- Bonuccelli G, Tsirigos A, Whitaker-Menezes D, Pavlides S, Pestell RG, Chiavarina B, et al. Ketones and lactate “fuel” tumor growth and metastasis: Evidence that epithelial cancer cells use oxidative mitochondrial metabolism. Cell Cycle 2010; 9:3506 - 3514; PMID: 20818174; http://dx.doi.org/10.4161/cc.9.17.12731
- Martinez-Outschoorn UE, Prisco M, Ertel A, Tsirigos A, Lin Z, Pavlides S, et al. Ketones and lactate increase cancer cell “stemness,” driving recurrence, metastasis and poor clinical outcome in breast cancer: achieving personalized medicine via Metabolo-Genomics. Cell Cycle 2011; 10:1271 - 1286; PMID: 21512313; http://dx.doi.org/10.4161/cc.10.8.15330
- Haji-Michael PG, Ladriere L, Sener A, Vincent JL, Malaisse WJ. Leukocyte glycolysis and lactate output in animal sepsis and ex vivo human blood. Metabolism 1999; 48:779 - 785; PMID: 10381154; http://dx.doi.org/10.1016/S0026-0495(99)90179-8
- Hunt TK, Aslam RS, Beckert S, Wagner S, Ghani QP, Hussain MZ, et al. Aerobically derived lactate stimulates revascularization and tissue repair via redox mechanisms. Antioxid Redox Signal 2007; 9:1115 - 1124; PMID: 17567242; http://dx.doi.org/10.1089/ars.2007.1674
- Benigni F, Atsumi T, Calandra T, Metz C, Echtenacher B, Peng T, et al. The proinflammatory mediator macrophage migration inhibitory factor induces glucose catabolism in muscle. J Clin Invest 2000; 106:1291 - 1300; PMID: 11086030; http://dx.doi.org/10.1172/JCI9900
- Roth S, Droge W. Regulation of interleukin 2 production, interleukin 2 mRNA expression and intracellular glutathione levels in ex vivo derived T lymphocytes by lactate. Eur J Immunol 1991; 21:1933 - 1937; PMID: 1868876; http://dx.doi.org/10.1002/eji.1830210823
- Nareika A, He L, Game BA, Slate EH, Sanders JJ, London SD, et al. Sodium lactate increases LPS-stimulated MMP and cytokine expression in U937 histiocytes by enhancing AP-1 and NF-kappaB transcriptional activities. Am J Physiol Endocrinol Metab 2005; 289:E534 - E542; PMID: 15941782; http://dx.doi.org/10.1152/ajpendo.00462.2004
- Samuvel DJ, Sundararaj KP, Nareika A, Lopes-Virella MF, Huang Y. Lactate boosts TLR4 signaling and NF-kappaB pathway-mediated gene transcription in macrophages via monocarboxylate transporters and MD-2 up-regulation. J Immunol 2009; 182:2476 - 2484; PMID: 19201903; http://dx.doi.org/10.4049/jimmunol.0802059
- Martinez-Outschoorn UE, Whitaker-Menezes D, Lin Z, Flomenberg N, Howell A, Pestell RG, et al. Cytokine production and inflammation drive autophagy in the tumor microenvironment: role of stromal caveolin-1 as a key regulator. Cell Cycle 2011; 10:1784 - 1793; PMID: 21566463; http://dx.doi.org/10.4161/cc.10.11.15674
- Witkiewicz AK, Kline J, Queenan M, Brody JR, Tsirigos A, Bilal E, et al. Molecular profiling of a lethal tumor microenvironment, as defined by stromal caveolin-1 status in breast cancers. Cell Cycle 2011; 10:1794 - 1809; PMID: 21521946; http://dx.doi.org/10.4161/cc.10.11.15675