Abstract
In the cancer stem cell model a cell hierarchy has been suggested as an explanation for intratumoral heterogeneity and tumor formation is thought to be driven by this tumor cell subpopulation. The identification of cancer stem cells in osteosarcoma (OS) and the biological processes dysregulated in this cell subpopulation, also known as tumor-initiating cells (TICs), may provide new therapeutic targets. The goal of this study, therefore, was to identify and characterize the gene expression profiles of TICs isolated from human OS cell lines. We analyzed the self-renewal capacity of OS cell lines and primary OS tumors based upon their ability to form sphere-like structures (sarcospheres) under serum-starving conditions. TICs were identify from OS cell lines using the long-term label retention dye PKH26. OS TICs and the bulk of tumor cells were isolated and used to assess their ability to initiate tumors in NOD/SCID mice. Gene expression profiles of OS TICs were obtained from fresh orthotopic tumor samples. We observed that increased sarcosphere efficiency correlated with an enhanced tumorigenic potential in OS. PKH26Hi cells were shown to constitute OS TICs based upon their capacity to form more sarcospheres, as well as to generate both primary bone tumors and lung metastases efficiently in NOD/SCID mice. Genomic profiling of OS TICs revealed that both bone development and cell migration processes were dysregulated in this tumor cell subpopulation. PKH26 labeling represents a valuable tool to identify OS TICs and gene expression analysis of this tumor cell compartment may identify potential therapeutic targets.
Introduction
Malignant tumors usually are composed of a heterogeneous mixture of cells with distinct proliferative and differentiation capacities.Citation1 These differences may be due to distinct cellular (genetic and epigenetic) as well as host factors (tumor microenvironment). Two different, but not necessarily mutually exclusive models have been proposed to explain tumor heterogeneity. The stochastic model predicts that tumors are biologically homogenous and cell behavior is randomly affected by intrinsic or extrinsic influences. Alternatively, the cancer stem cell model posits that tumors maintain a hierarchical organization similar to that observed during normal tissue development, and that tumor formation is initiated and driven by specific mutations in tissue stem cells or progenitors.Citation2 The main consequence is that only this subset of cells, as a result of acquiring self-renewal properties as well as quiescence, is maintained and is capable of generating the rest of the tumor progeny.Citation3
This cellular heterogeneity and hierarchical distribution have been observed in primary human tumors and also in established cancer cell lines. Tumor-initiating cells (TICs) or cancer stem cells (CSCs) have been identified from many cancer types, including leukemia, breast, prostate and glioma cell lines using the ALDEFLUOR assay, by the expression of different surface markers or by the ability to efflux Hoechst dye in the so-called side population.Citation4–Citation6 CSCs have also been propagated in vitro as clonogenic spheres in suspension under serum-free conditions as a surrogate of their self-renewal capacity.Citation7 All of these techniques involve cell culture and fluorescent activated cell sorting (FACS) analysis, which may alter the expression of known CSC markers and cell viability. The gold standard to demonstrate the presence of CSCs is limiting dilution transplantation usually performed in immunodeficient mice. The selection of the appropriate microenvironment, which provides the cellular niche and vasculature, is critical for long-term maintenance of tumor growth.Citation8
The identification of CSCs in solid tumors by many laboratories is based on the expression of specific cell surface markers such as CD44+/CD24low in breast cancer, CD133+ in colon or pancreatic cancer and CD90+ in malignant liver tumors.Citation9 However, the significant tissue heterogeneity in these tumors associated with the relative promiscuity of these markers may limit their utility.Citation10,Citation11 Other laboratories have employed a label-retaining cell assay that relies on the quiescence of CSCs to identify this tumor cell compartment.Citation12,Citation13 This method exploits differences in cell cycle kinetics and a correlation with the level of vital dye retention such as PKH26/PKH67 or bromodeoxyuridine. Rapidly dividing cells dilute the fluorescent label and become dim, while quiescent cells retain the label and remain intensely fluorescent. PKH26, one of the long-term label retention dyes, is a non-cytotoxic red lipophilic membrane dye that gets equally partitioned among daughter cells subsequent to each cell division and due to its prolonged half-live also enables tracking of live cells.Citation14,Citation15
As in many other solid tumors, TICs have been identified in osteosarcoma (OS), the most common bone cancer in children and young adults and one of the leading causes of death by cancer in that age group.Citation16 OS TICs have been isolated based on their ability to form sarcospheres, the expression of the surface markers CD133+, CD117+ and stro-1+, and the activation of the Oct-4 promoter detected using a reporter construct.Citation17–Citation20 However, some of these studies have not functionally validated the presence of OS TICs using limiting-dilution transplantation in the appropriate orthotopic site, i.e., the bone of immunodeficient mice. Instead they often utilize subcutaneous injection of tumor cells, and very few studies have investigated the metastatic potential of these cells. The identification of OS TICs should provide new insights about the genes and molecular pathways involved in bone tumor formation. Although sarcospheres are enriched in the expression of the embryonic stem cell genes NANOG and OCT-3/4 or they contain the metastasis-associated stem cell marker CXCR4 and the drug resistance transporter ABCG2, there are little additional data about the genes that might be overexpressed or downregulated in OS TICs.Citation17,Citation20 Such a gene signature might provide important prognostic and therapeutic information. The purpose of the present study was to isolate and characterize functional TICs in established and primary human OS cell lines by labeling the slowly dividing/quiescent cells using the long-term label retention dye PKH26, and to obtain gene expression profiles of this tumor cell compartment.
Results
Established osteosarcoma cell lines form sarcospheres with variable efficiencies and sizes that reflect their tumorigenic potential.
Sphere-forming assays in which cells have been under serum-free conditions in the presence of growth factors have been employed in breast cancer and brain tumors as a surrogate for TIC self-renewal. Using a sphere-forming assay, we found that all six established OS cell lines were capable of generating sarcospheres and could be serially passaged. The sarcosphere efficiency after secondary passage was markedly different among the studied OS cell lines. We observed that MNNG/HOS and 143B formed 3–4 times more spheres, and these were larger than the spheres formed from U-2 OS or Saos-2 cells ( and S1A). Interestingly, those OS cell lines, MNNG/HOS and 143B, have shown increased tumorigenicity and increased metastatic capacity after orthotopic injections in immunodeficient mice.Citation21
Using the “wound repair” assay, we evaluated cell migration in two OS cell lines (143B and Saos-2)—which displayed markedly different sarcosphere efficiencies. We found that 143B cells exhibited significantly faster migration; i.e., they filled the artificial gap (“scratch”) to restore cell-cell contact much more rapidly than the other two cell lines (). Thus, these findings showed that sphere forming capacity correlated with the augmented migration ability in OS cell lines.
We also examined sarcosphere efficiency and size in five OS tumors. All samples were obtained from patient initial bone biopsies or at the time of definitive surgeries except for OS 1095, which came from a pulmonary metastatic lesion. Interestingly, sarcosphere efficiency and size were significantly increased in that tumor sample, which may be a reflection of the number of OS TICs ( and S1B).
Highly fluorescent PKH26 osteosarcoma cells have tumor-initiating cell properties such as increased self-renewal and quiescence.
Many tissue and CSCs are relatively quiescent and may remain in a dormancy state for long periods of time.Citation12 To identify this quiescent population, we uniformly labeled MNNG/HOS, 143B and Saos-2 cells with the red fluorescent dye PKH26. After FACS analysis, we observed that the brightly-labeled PKH26Hi cells formed secondary sarcospheres more efficiently than the dimly-labeled PKH26Lo cells (, S2A and B). There were twice as many sarcospheres observed in the PKH26Hi vs. PKH26Lo fractions in all three OS cell lines. The fraction of PKH26Hi cells constituted 8–25% of the total cell population.
We also observed that after the fourth passage under sarcosphere culture conditions, a minority of cells retained the PKH26 dye (). This finding suggests that even in established OS cell lines there is a heterogeneous group of cells that divide with different frequencies. PKH26Hi cells constituted the slowly dividing or quiescent cell subpopulation. To evaluate PKH26 distribution in vivo, 143B and MNNG/HOS ZsGreen expressing and PKH26 labeling cells were injected into the bone of NOD/SCID mice. After 4 weeks, all mice developed bone tumors, which were subsequently harvested to make single cell suspensions for FACS analysis. We found a heterogeneous distribution of the PKH26 dye ( and S2C). There was a fraction of OS cells—8–25% PKH26Hi cells—that retained the red dye as compared with the majority of the osteosarcoma cells after bone tumor formation in mice. Our results showed that PKH26 labeling allows the identification of a distinctive subpopulation that has an increased capacity for self-renewal and remains quiescent.
PKH26Hi osteosarcoma cells efficiently generated bone tumors and pulmonary metastasis after orthotopic injection in immunodeficient mice.
The gold standard to define TICs is the limiting dilution transplantation of cells in immunodeficient mice.Citation9 Injection of OS cells into the mouse tibia should provide the appropriate niche environment for tumor growth (Fig. S3A–C). 143B ZsGreen-expressing and PKH26-labeled cells were cultured under sarcosphere conditions. Prior to the injection into the tibia of NOD/SCID mice, 143B sarcospheres were dissociated and sorted by FACS into ZsGreen PKH26Hi cells (20%) and ZsGreen PKH26Lo cells (25%). After 6 weeks, we found that as few as 500 cells of 143B ZsGreen PKH26Hi could initiate bone tumors. We calculated that TIC frequency was 27-fold higher in 143B ZSGreen PKH26Hi cells compared with 143B ZsGreen PKH26Lo cells at the same cell number ( and Fig. S4). This result demonstrated the presence of OS TICs in established OS cell lines.
The observation of metastasis can be difficult, especially if they are microscopic with only a small number of cells involved. Cells stably expressing ZsGreen emit a bright fluorescent signal that facilitates their localization. At necropsy green fluorescent cells were reliably detected in bone tumors and microscopic metastasis in the lungs (). We did not observe pulmonary metastasis without primary bone tumors in any of euthanized mice (n > 50, data not shown). TICs have been reported to be more highly metastatic in pancreatic and colon cancer, and are enriched for the metastatic-marker CXCR4 in OS.Citation20,Citation22,Citation23 To evaluate if metastatic tumor cells contain PKH26 bright cells, 143B and MNNG/HOS ZsGreen expressing and PKH26 labeling cells were injected into the tibia of NOD/SCID mice. All mice developed bone tumors and 6/10 mice had microscopic lung metastasis after 4 weeks. Bone tumors and pulmonary lesions were processed and then cultured under sarcosphere conditions. Remarkably, we observed that both primary bone tumor and lung metastatic sarcospheres still contained bright PKH26 cells. Noticeably, metastatic sarcospheres appeared to contain more PKH26Hi cells ().
Genome expression analysis of PKH26Hi bone tumor cells showed that genes involved in bone development/inflammation/cell migration were upregulated and genes implicated in cellular acetylation processes were downregulated.
Genomewide expression profiling to identify genes involved in OS genesis or response to chemotherapy has been performed by several laboratories.Citation24–Citation26 This approach considered bone tumors as homogenous cell populations, which may explain the lack of overlap between results. However, osteosarcomas display marked heterogeneity as has been demonstrated in a wide range of other malignancies.Citation16,Citation27 Therefore, to understand OS clinical behavior, it is critical to define the gene expression of various tumor cell sub-populations. To elucidate the role of OS TICs in tumorigenesis and metastasis, we compared the genome expression profiling of TICs with the bulk of OS cells directly obtained from xenograft tumors.
We compared the gene expression profile of two cell subpopulations: PKH26Hi, which included exclusively the TIC subpopulation, and PKH26Lo which consisted the rest of cancer cells in each tumor sample (Fig. S5). We used Affymetrix Gene Chip arrays containing more than 45,000 genes to generate gene expression profiles for 16 OS samples. We detected 126 genes differentially expressed between OS TICs and the bulk of OS cells. Of these, 82 were significantly upregulated and 44 were significantly downregulated. A heat map illustrating the expression of those genes across the OS samples is shown in . Although differentially expressed genes between OS TICs and non-OS TICs can be validated individually, the value of genome-wide microarray analysis can be better realized in terms of cellular pathways or biologically processes. We conducted a functional analysis using the set of genes differentially expressed in OS TICs using the DAVID program (the Database for Annotation, Visualization and Integrated Discovery; www.david.abcc.ncifcrf.gov/home.jsp).Citation28 We found that genes in bone/skeletal development (GNAS, IHH, IGF-1, MMP14, ZFAND5,THRA) and cell mobility/migration (CORO1A, CDC42, FEZF2, THBS4, MMP14) processes were enhanced in OS TICs (p < 0.05). There were two genes not included in the analysis that have a poorly understood role in inflammation (AIF-1 and CXCL14). Interestingly, we also found that the genes involved in acetylation (LARP4, RECQL, SET, NUDT21, SMC5, TFDP1) were downregulated (p < 0.005), suggesting that epigenetic differences might be present in OS TICs as compared with the bulk tumor cells (Table S1).
The increased expression of the embryonic stem cell markers OCT-3/4 and NANOG in OS TICs have been reported by different groups.Citation17,Citation29 We found in our microarray data that OCT-3/4 was upregulated in the PKH26Hi (stem-like) cells as compared with PKH26Lo cells, but did not reach significance to be called present in the heatmap list. In contrast, NANOG was neither upregulated nor downregulated in the stem-like cell compartment. In addition, we only observed a modest increase by qPCR in the expression of OCT-3/4 and NANOG in MNNG/HOS PKH26Hi cells, and NANOG in 143B PKH26Hi cells.
Discussion
Typically, the isolation of TICs from solid tumors relies on the identification of a combination of cell surface markers often associated with normal stem cells. However, a single phenotype represented by a defined set of markers cannot account for the cellular heterogeneity encountered in OS.Citation30 To overcome these difficulties, we have selected OS TICs by functionally labeling slowly dividing/quiescent cells using the fluorescent dye, PKH26. In addition, we have identified several genes and molecular pathways that are dysregulated in OS TICs compared with the bulk of human OS cells.
Our data demonstrated that human OS cell lines contain a slowly dividing cell subpopulation that retains the red fluorescent dye PKH26 (PKH26Hi) and possesses TIC features. PKH26Hi cells form sarcospheres more efficiently than the rest of the tumor cells. Like breast or glioma CSCs, OS TICs overcome anoikis and serum deprived conditions to form spherical clones. The fact that OS cells can grow as sarcospheres and can be serially passaged demonstrates the presence of cells with self-renewal ability. Sarcosphere formation capacity in established OS cell lines and tumor samples have been demonstrated previously in references Citation17, Citation18 and Citation29. Interestingly, we also observed a correlation between sarcosphere number and size with tumorigenicity in OS. 143B and MNNG/HOS are two of the most tumorigenic OS cell lines, and they constitute the group with the highest number and largest sarcospheres in our experiments. This phenomenon could be due to an increased proportion of OS TICs in these cell lines. Our results also showed that the most tumorigenic tumor samples (obtained directly from metastatic pulmonary nodules) also follow this pattern. A similar observation has been reported in malignant brain tumors.Citation31
While sarcosphere formation capacity is a good in vitro assay to study OS TICs, the gold-standard to demonstrate functional TICs in any particular cancer is the formation of tumors after limiting dilution transplantation in immunodeficient mice. The interplay of tumor-initiating cells with their niche is critical for cancer growth.Citation32 OS is a primary malignant tumor of the bone and ideally xenograft transplantation of putative TICs should be performed orthotopically in the bone of NOD/SCID mice. However, performing limiting dilution transplantations into the bone of immunodeficient mice is technically very challenging. CD133+ was identified as a marker of OS TICs in established cell lines in vitro but lacked confirmation in animal experiments.Citation18 Subcutaneous injection of human OS TIC expressing the surface markers CD117+ and stro-1+ or containing the Oct-4 activated promoter has been used as an alternative to orthotopic transplantation.Citation19,Citation20 In our studies, we observed the formation of bone tumors after injecting as few as 500 cells of OS TICs (PKH26Hi) directly into the tibia of NOD/SCID mice. To our knowledge, this is the first time that human OS TICs are defined by limiting dilution transplantation in an orthotopic mouse model. The CSC model posits that only this tumor cell subpopulation should have self-renewal capacity to generate tumors and reconstitute the original tissue cell heterogeneity. Although we observed that non-OS TICs were able to form bone tumors after orthotopic injection, this required ten times more tumor cells than OS TICs. This finding may be due to the intrinsically high-tumorigenic capacity of established OS cell lines or some contamination with OS TICs after FACS analysis. Nevertheless, our approach shows that even established OS cell lines are composed of different cell subpopulations with varied tumorigenic capacities. Furthermore, this method provides an alternative for identifying OS TICs using a more biological approach instead of relying in the expression of cell surface markers. In our hands, the expression of CD117 (c-kit) by immunohistochemistry in several 143B xenograft bone tumors was negative.
The isolation of OS TICs (PKH26Hi) led us to investigate the genes and molecular pathways that are differentially expressed in this tumor cell subpopulation. Labeling OS cells with ZsGreen significantly reduced the chance of specimen contamination with non-tumor cells. This is particularly important in OS that lack unique tumor markers. OS TICs (PKH26Hi) and PKH26Lo subpopulations isolated from the appropriate bone “niche” microenvironment were employed for gene expression analysis directly without the cells being cultured or passaged in vitro which may significantly influence genotype characterization.Citation33 We found that genes involved in bone/skeletal development are upregulated in OS TICs. From this group of genes, IGF-1 is particularly interesting because it has been reported to play a key role in the tumorigenesis of several sarcomas besides being involved in the formation of trabecular bone and longitudinal bone growth.Citation34,Citation35 The activation of IGF-1R by IGF1 in OS stimulates cell growth in vitro and in vivo.Citation36,Citation37 Moreover, IGF-1R inhibition by monoclonal antibodies resulted in a delay in tumor growth and increased the overall survival in a xenograft OS model.Citation38 Our analysis did not reveal that genes involved in embryogenesis or “stemness” such as NANOG or OCT-3/4 were significantly upregulated in OS TICs.Citation17,Citation29 There was only a modest increase in the expression of NANOG and OCT-3/4 observed by both microarray and qPCR. We believe that these differences as compared with prior reports could be due to the experimental conditions of the sarcosphere assays, which enhance the development of OS TICs and may increase the expression of these “stemness” genes. The expression of NANOG and OCT-3/4 seems to be increased to a much smaller extent in primary TICs isolated from OS orthotopic bone tumors. However, we did find that IHH, a member of the Hedgehog family, is enriched in this cell compartment. The Hedgehog signaling pathway has a role during embryogenesis, bone development and also has been implicated as one the mechanisms dysregulated in CSCs in several tumors.Citation39,Citation40 However, the role of Hedgehog signaling in TICs and in the formation of distant tumors or metastasis is not fully understood. We observed that genes involved in cell migration were overexpressed in OS TICs, as might be expected if this cell subpopulation is involved in the metastatic process. Particularly, upregulation of MMP14, a member of the matrix metalloproteinase family, may be critical for OS progression and metastasis as has been shown in other tumors.Citation41
We also observed that several genes that play a role in intracellular acetylation are downregulated in OS TICs. Histone acetylation can result in epigenetic gene silencing and chromatin remodeling which may allow the cell to remain in a stem-like state.Citation42 Ultimately, more detailed functional studies will be necessary to determine the involvement of these cellular processes in OS pathogenesis.
In summary, we demonstrated that established OS cell lines contain TICs that efficiently generate bone tumors after orthotopic injection in immunodeficient mice. We identified this cell subpopulation using the long-term label retention membrane dye PKH26 that functionally labels slowly dividing/quiescent cells. This characteristic may account for OS TIC's resistance to most of the anticancer drugs that target rapidly dividing cells, and may explain later relapse. The genomic profiling of OS TICs reveals some pathways specifically dysregulated in this tumor cell subpopulation. Understanding OS heterogeneity may help in the design of improved treatments that combine cytotoxic drugs and agents that selectively target TICs.
Materials and Methods
Sarcosphere culture and in vitro scratch assays.
Six established human OS cell lines (143B, MNNG/HOS, Saos-2, MG-63, U-2 OS, SJSA-1) were acquired from the American Type Culture Collection, frozen and stored after a few passages through the Texas Children's Cancer Center and Hematology Service Tumor Tissue Bank. Experiments described in this manuscript were performed on established OS cell lines after less than 10 passages. Primary OS tumor samples were also obtained from Texas Children's Cancer Center and Hematology Service Tumor Tissue Bank. Informed consent was obtained prior to working with primary OS tumor samples. Tumor cells were grown and expanded in MEM or McCoy's medium with 10% fetal bovine serum (FBS). To evaluate the self-renewal capacity and growth as spherical clones (sarcospheres), established and primary OS cell lines were cultured in non-adherent plates with growth factors in a serum-free medium and serially passaged as previously described in reference Citation43. After 7 days, secondary sarcosphere images were taken using a Leica MZ16F inverted dissecting microscope coupled to a device camera Leica DFC300FX with 2.0 and 2.5x magnification. Secondary sarcospheres were counted and measured using Image Pro-Plus software, version 6.1. In vitro self-renewal was determined by sphere-forming efficiency (SFE), which was calculated as the number of spheres (diameter = 40 µm) formed in 7 days divided by the original number of single cells seeded and expressed in percentage (±SD).
To measure the cell migration capacity of established OS cell lines with markedly different sarcosphere efficiencies, a “wound” was inflicted with a 200 µL pipette tip in a confluent mono-layer of 143B and Saos-2 cells cultured in 60 mm dishes. Several images were taken using a Zeiss AX10 inverted microscope coupled to a device camera AxioCam MRm with 5x magnification and processed using AvioVision, version 4.6 at the beginning and at regular 6 h intervals until the gap was closed to determine the rate of cell migration as described elsewhere in reference Citation44.
PKH26 staining.
Many tissue stem cells are relatively quiescent and may remain in a dormancy state for long periods of time. Some TICs in leukemia and solid tumorsCitation12,Citation45,Citation46 are thought to share similar properties. PKH fluorescent dyes have been using for cell tracking, growth promotion and differentiation studies.Citation14,Citation47 Rapidly dividing cells dilute the dye and quiescent cells remain highly fluorescent. Accordingly, three established OS cell lines-143B, MNNG/HOS and Saos-2 cells were stained with PKH26 (Sigma-Aldrich, St. Louis, MO) following the protocol provided by the manufacturer. Briefly, 1 µL of the PKH26 dye stock solution (1.0 mM) was diluted in 250 µL of diluent C (Sigma-Aldrich, St. Louis, MO) and mixed in a separate tube with 1 × 10⁶ cells resuspended in 250 µL of the same diluent. After incubating for 5 min at room temperature, stained cells were blocked with 10% FBS and washed three times with PBS. Stained cells were plated for 48–72 h, trypsinized and single-cell suspensions were FACS sorted using an LSRII flow cytometer (BD Biosciences, San Jose, CA) according to PKH26 intensity. We selected the brightest 5–25% fluorescent cells and designated them as PKH26Hi, which constitute putative TICs and the dimmest 25–50% fluorescent cells as PKH26Lo that represent the bulk of tumor cells. PKH26Hi and PKH26Lo cells were either plated under sarcosphere conditions or used for orthotopic transplantation in immunodeficient mice. In addition, PKH26 stained cells were serially passaged under sarcosphere conditions to observe the dye distribution.
Generation of ZsGreen transduced osteosarcoma cell lines.
For bioluminescence tracking and tumor cell recovery, 143B and MNNG/HOS cells were transduced with a lentivirus allowing stable integration of ZsGreen fluorescent reporter driven by an EF1α promoter (pEi-ZsGreen). The lentivirus was packaged in 293T cells by co-transfection of pEi-ZsGreen, pRSV-rev, pMDLg-pRRE and pCMV-VSVG using Fugene transfection reagent (Roche, Indianapolis, IN). The viral supernatant was collected at 48 and 72 h post-transfection, filtered through 45 µm filter units and ultracentrifuged. Concentrated virus was aliquotted and frozen at −80°C, then titered using 293T cells. The titer for this virus was 108 infectious units (IU) per milliliter and the cells were infected at a multiplicity of infection (MOI) of five. To isolate a homogeneous bright green population, cells were sorted by FACS, returned to culture and expanded through 1–4 passages.
Orthotopic transplantation.
All animal procedures were done under a protocol approved by Baylor College of Medicine Institutional Animal Care and Use Committee. Four- to five-week-old male non-obese diabetic/severe combined immunodeficiency (NOD/SCID) mice were obtained from Jackson Laboratory (Bar Harbor, ME). Animals were anesthetized with isofluorane and kept under sterile airflow conditions during the experiments. In preparation for limiting dilution transplantation, ZsGreen expressing and PKH26 staining 143B cells were cultured under sarcosphere conditions for 72 h. Following FACS, either 500–10,000 PKH26Hi cells or 500 to 10,000 PKH26Lo cells suspended in 20 µl PBS/matrigel (1:1) were injected into the right tibia of NOD/SCID mice. Animals were monitored daily until 12 weeks after injection or when tumors reached 1 cm in diameter. The right tibia and both lungs were then dissected and removed for inspection using a Leica DFC300FX fluorescent microscope under brightfield or GFP filter at 0.71x magnification. Tumor images were processed using Image Pro-Plus software, version 6.1. TIC frequency was estimated using R (version 2.12.2) Citation48 and the STATMOD library.Citation49
In vivo tumor-initiating cell isolation from bone tumor and lung metastasis.
Fifty thousand ZsGreen expressing and PKH26 staining 143B and MNNG/HOS cells were injected into the right tibia of NOD/SCID mice (five mice for group). After 4 weeks, all animals developed palpable bone tumors that were subsequently dissected and fixed with 4% paraformaldehyde (PFA) for histological analysis. The soft tissue portion was minced, digested with 2 mg/mL collagenase A (Roche, Indianapolis, IN) at 37°C for 90 min with gentle rocking, filtered twice (70 µm and 40 µm), washed with 10% FBS thrice and resuspended in PBS for FACS analysis or cell culture. Tumor cells were sorted based on the co-expression of ZsGreen and the content of PKH26 (Hi vs. Lo). Samples were snap-frozen in liquid nitrogen and stored at −80°C for microarray analysis. Samples of unsorted bone tumor cells were also cultured under sarcosphere conditions. After 5–7 days, sarcospheres generated from orthotopic bone tumors and lung metastases were visualized using a Zeiss AX10 fluorescent microscope coupled to a device camera AxioCam MRm under FITC and Texas Red filters at 20x magnification. Images were processed using AvioVision, version 4.6.
To recover metastatic tumor cells, the lungs were dissected and placed in a dish containing PBS. Previously, the heart was flushed with 10 mL of PBS to avoid “contamination” with circulating tumor cells or red blood cells. Lung lesions were localized by ex vivo bioluminescence imaging using Leica DFC300FX fluorescent microscope (see above) and resected under sterile conditions. Half of the tissue was fixed with 4% PFA and processed for histological analysis. The other half was minced and processed as described above for bone tumors except that metastatic tumor cells were sorted based only on the expression of ZsGreen due to their reduced number.
Microarray analysis.
Gene expression analysis was performed in PKH26Hi cells (TICs) and PKH26Lo cells (non-TICs) obtained from five orthotopic bone tumors generated by each MNNG/HOS and 143B cell lines. All bone tumors were located at the site of orthotopic injection (right tibia). The tumor volume was 3.5 cm3 [mean volume, calculated per the equation: volume = (L + W)(L)(W)(0.2618)] at the time of mouse euthanasia. The soft tissue component from each bone tumor was dissected, minced and processed as described above. Immediately after FACS, 1.5 × 10⁵ PKH26Hi cells and 7 × 10⁵ PKH26Lo cells from each bone tumor sample were snap frozen and stored at −80°C until RNA processing.
The microarray data were first evaluated for quality control using the AffyQCReport library of BioConductor.Citation50 Two 143B PKH26Hi tumor samples were processed together due to insufficient RNA material. The raw expression values were log-transformed and normalized by RMA implemented in BRB Arraytools suite.Citation51 Using two-sided t-tests, significant genes were identified by comparing different sample groups, such as PKH26Hi vs. PKH26Lo cells. The significance of gene discovery was corrected for multiple testing by the Benjamini and Hochberg method.Citation52 A false discovery rate of < 0.01 was used as a cutoff. Hierarchical clustering and heatmaps were generated using MeV software, Pearson correlation and average linkage.Citation53 The control and non-annotated probes were removed before the generation of heatmaps.
Quantitative real-time polymerase chain reaction (qPCR).
To assess mRNA expression levels of the cancer stem cell markers OCT-3/4 and NANOG, total RNA was extracted using Trizol reagent (Invitrogen, Carlsbad, CA). Reverse transcription was performed from 200 ng of total RNA from each condition with random primers using the High Capacity cDNA reverse transcription kit (Applied Biosystems, Carlsbad, CA). Quantitative real-time PCR determinations of OCT-3/4, NANOG and GAPDH were run in triplicates. Human OCT-3/4 and NANOG primers were purchased from Integrated DNA Technology (IDT, Coralville, IA). Primers: hOCT3/4 Forward: 5′-CTT GAA TCC CGA ATG GAA AGG G-3′; hOCT 3/4 Reverse: 5′-GTG TAT ATC CCA GGG TGA TCC TC-3′; hNANOG Forward: 5′-TGA TTT GTG GGC CTG AAG AAA A-3′; hNANOG Reverse: 5′-GAG GCA TCT CAG CAG AAG ACA-3′. The final primer concentration per reaction was 250 nM. Human GAPDH real time qPCR primers were prepared and used per the manufacturer's recommendation (QIAGEN, Valencia, CA). All qPCR reactions were performed using the Bio-Rad iQ SYBR Green Supermix. Reactions were run using a Corbett Research Rotor-Gene 3000 Real-time Thermal Cycler. Analysis was performed utilizing the delta-delta Ct method of comparing the individual cell line PKH26Hi vs. PKH26Lo relative expression levels. Multiple independent experiments were performed that produced similar results.
Abbreviations
| TICs | = | tumor-initiating cells |
| CSCs | = | cancer stem cells |
| OS | = | osteosarcoma |
| SFE | = | sphere-forming efficiency |
| FACS | = | fluorescent activated cell sorting |
Figures and Tables
Figure 1 Sarcosphere size and efficiency reflect tumorigenic potential in osteosarcoma. (A) MNNG/HOS and 143B OS cell lines generates larger sarcospheres than Saos-2 and U-2 OS (*p < 0.01, size in microns, at least 100 spheres per group). (B) Representative sarcosphere derived from MNNG/HOS and U-2 OS. Bar 100 µm. (C) MNNG/HOS and 143B form more sarcospheres than Saos-2 and U-2 OS (SFE *p < 0.01, six samples/group in duplicate experiments). (D) Total number of spheres per well of MNNG/HOS and U-2 OS. Bar 500 µm. (E) 143B (top) has increased cell migration capacity than Saos-2 (bottom). The images at the beginning and the end of the 24 h incubation period were captured. The estimated migration of 143B cells was 2.7 times faster than Saos-2 cells (cell migration velocity (µm/h) 14.5 ± 0.85 vs. 5.3 ± 0.89, mean ± SD, p < 0.001, gap distance 600 µm, performed four times). (F) Metastatic osteosarcoma sample (OS1095) generates sarcospheres more efficiently than other primary bone tumor samples (SEF *p < 0.01, six samples/group in duplicate).
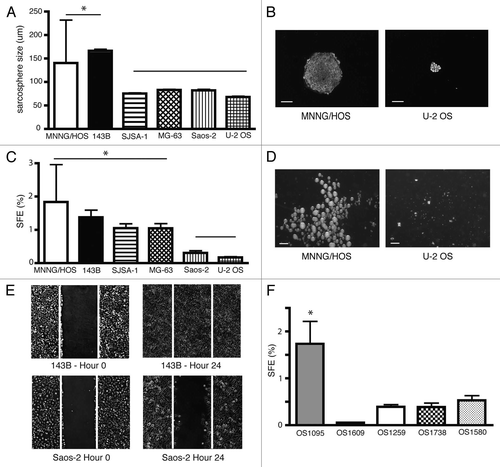
Figure 2 PKH26Hi ostesarcoma cells show increased self-renewal and divide less frequently. (A) PKH26Hi cells (black columns) generate twice as many sarcospheres than pKH26Lo cells (white columns) in three OS cell lines (SFE p < 0.01, at least three samples/group in duplicate experiments). (B) Only a minority of cells retain the PKH26 dye after serial sarcosphere passages (143B top row, primary sacosphere left, tertiary sarcosphere right; MNNG/HOS bottom row, primary sacosphere left, tertiary sarcosphere right). Bar 100 µm. (C) Representative FACS analysis shows PKH profile of cultured MNNG/HOS cell line (10,000 cells, PKH26Hi red, PKH26Lo gray, results were reproducible in at least two independent experiments). (D) Representative FACS analysis shows heterogeneous distribution of PKH26 dye on MNNG/HOS orthotopic bone tumors. Quiescence cells dilute less the membrane dye and appear brighter (10,000 cells, PKH26Hi red, PKH26Lo gray, results were reproducible in at least two independent experiments).
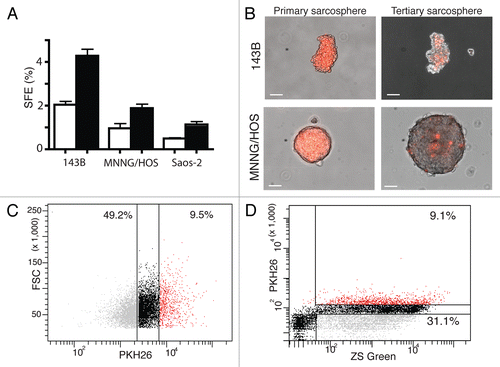
Figure 3 PKH26Hi osteosarcoma cells are more tumorigenic and generate bone tumors and lung metastasis. (A) Bone tumor (bright, left; ZsGreen, right) obtained after orthotopic injection of 1000 PKH26Hi cells. Bar 1 mm. (B) Pulmonary metastasis (bright, left; ZsGreen, right) are observed in some bone tumor bearing mice. Bar 1 mm. (C) sarcospheres obtained from bone tumors demonstrate the presence of PKH26 dye (bright, left; ZsGreen, right; PKH26, bottom) Bar 50 µm. (D) sarcospheres generated from pulmonary metastasis appeared to have an increased proportion of PKH26 cells (bright, left; ZsGreen, right; PKH26, bottom) Bar 50 µm.
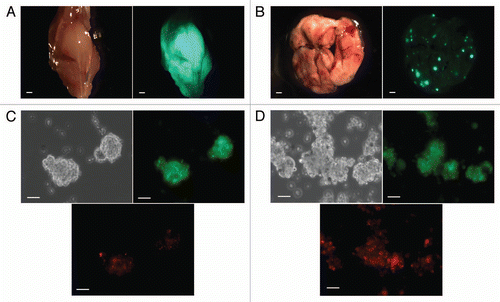
Figure 4 PKH26Hi cells have a gene signature distinct to the bulk of osteosarcoma cells in orthotopic bone tumors. Sixteen osteosarcoma samples obtained directly from orthotopic bone tumors were present on the Affymetrix U133A microarray platform. The heatmap represents the gene expression of PKH26Hi and PKH26Lo groups. The gene expression data are median centered with yellow being upregulated (82 genes) and blue being downregulated (44 genes).
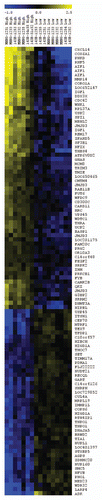
Table 1 Tumor-initiating cells were enriched in the PKH26Hi subpopulation
Additional material
Download Zip (772.5 KB)Acknowledgments
The authors thank Laszlo Perlaky, Matthew Herrick and Amy Shore for their skillful technical assistance and Dr. Jason Yustein and Dr. Lawrence Donehower for their insightful comments. This research was supported by a Fellowship and Research Grant from St. Baldrick's Foundation (N.R.), Young Investigator Award from the American Society of Clinical Oncology (N.R.) and NIH grant CA114757 (C.C.L.).
References
- Heppner GH, Miller BE. Tumor heterogeneity: biological implications and therapeutic consequences. Cancer Metastasis Rev 1983; 2:5 - 23; http://dx.doi.org/10.1007/BF00046903
- Pardal R, Clarke MF, Morrison SJ. Applying the principles of stem-cell biology to cancer. Nat Rev Cancer 2003; 3:895 - 902; http://dx.doi.org/10.1038/nrc1232
- Dalerba P, Cho RW, Clarke MF. Cancer stem cells: models and concepts. Annu Rev Med 2007; 58:267 - 284; http://dx.doi.org/10.1146/annurev.med.58.062105.204854
- Al-Hajj M, Wicha MS, Benito-Hernandez A, Morrison SJ, Clarke MF. Prospective identification of tumorigenic breast cancer cells. Proc Natl Acad Sci USA 2003; 100:3983 - 3988; http://dx.doi.org/10.1073/pnas.0530291100
- Charafe-Jauffret E, Ginestier C, Iovino F, Wicinski J, Cervera N, Finetti P, et al. Breast cancer cell lines contain functional cancer stem cells with metastatic capacity and a distinct molecular signature. Cancer Res 2009; 69:1302 - 1313; http://dx.doi.org/10.1158/0008-5472.CAN08-2741
- Kondo T, Setoguchi T, Taga T. Persistence of a small subpopulation of cancer stem-like cells in the C6 glioma cell line. Proc Natl Acad Sci USA 2004; 101:781 - 786; http://dx.doi.org/10.1073/pnas.0307618100
- Dontu G, Wicha MS. Survival of mammary stem cells in suspension culture: implications for stem cell biology and neoplasia. J Mammary Gland Biol Neoplasia 2005; 10:75 - 86; http://dx.doi.org/10.1007/s10911-005-2542-5
- Dirks PB. Brain tumor stem cells: bringing order to the chaos of brain cancer. J Clin Oncol 2008; 26:2916 - 2924; http://dx.doi.org/10.1200/JCO.2008.17.6792
- Visvader JE, Lindeman GJ. Cancer stem cells in solid tumours: accumulating evidence and unresolved questions. Nat Rev Cancer 2008; 8:755 - 768; http://dx.doi.org/10.1038/nrc2499
- Jones C, Mackay A, Grigoriadis A, Cossu A, Reis-Filho JS, Fulford L, et al. Expression profiling of purified normal human luminal and myoepithelial breast cells: identification of novel prognostic markers for breast cancer. Cancer Res 2004; 64:3037 - 3045; http://dx.doi.org/10.1158/0008-5472.CAN-03-2028
- Stingl J, Eirew P, Ricketson I, Shackleton M, Vaillant F, Choi D, et al. Purification and unique properties of mammary epithelial stem cells. Nature 2006; 439:993 - 997
- Kusumbe AP, Bapat SA. Cancer stem cells and aneuploid populations within developing tumors are the major determinants of tumor dormancy. Cancer Res 2009; 69:9245 - 9253; http://dx.doi.org/10.1158/0008-5472.CAN09-2802
- Pece S, Tosoni D, Confalonieri S, Mazzarol G, Vecchi M, Ronzoni S, et al. Biological and molecular heterogeneity of breast cancers correlates with their cancer stem cell content. Cell 2010; 140:62 - 73; http://dx.doi.org/10.1016/j.cell.2009.12.007
- Horan PK, Melnicoff MJ, Jensen BD, Slezak SE. Fluorescent cell labeling for in vivo and in vitro cell tracking. Methods Cell Biol 1990; 33:469 - 490; http://dx.doi.org/10.1016/S0091-679X(08)60547-6
- Boutonnat J, Barbier M, Muirhead K, Mousseau M, Grunwald D, Ronot X, et al. Response of chemosensitive and chemoresistant leukemic cell lines to drug therapy: simultaneous assessment of proliferation, apoptosis and necrosis. Cytometry 2000; 42:50 - 60; http://dx.doi.org/10.1002/(SICI)1097-0320(20000215)42:1<50::AIDCYTO8>3.0.CO;2-C
- Marina N, Gebhardt M, Teot L, Gorlick R. Biology and therapeutic advances for pediatric osteosarcoma. Oncologist 2004; 9:422 - 441; http://dx.doi.org/10.1634/theoncologist.9-4-422
- Gibbs CP, Kukekov VG, Reith JD, Tchigrinova O, Suslov ON, Scott EW, et al. Stem-like cells in bone sarcomas: implications for tumorigenesis. Neoplasia 2005; 7:967 - 976; http://dx.doi.org/10.1593/neo.05394
- Tirino V, Desiderio V, d'Aquino R, De Francesco F, Pirozzi G, Graziano A, et al. Detection and characterization of CD133+ cancer stem cells in human solid tumours. PLoS ONE 2008; 3:3469; http://dx.doi.org/10.1371/journal.pone.0003469
- Levings PP, McGarry SV, Currie TP, Nickerson DM, McClellan S, Ghivizzani SC, et al. Expression of an exogenous human Oct-4 promoter identifies tumor-initiating cells in osteosarcoma. Cancer Res 2009; 69:5648 - 5655; http://dx.doi.org/10.1158/0008-5472.CAN-08-3580
- Adhikari AS, Agarwal N, Wood BM, Porretta C, Ruiz B, Pochampally RR, et al. CD117 and Stro-1 identify osteosarcoma tumor-initiating cells associated with metastasis and drug resistance. Cancer Res 2010; 70:4602 - 4612; http://dx.doi.org/10.1158/0008-5472.CAN-09-3463
- Luu HH, Kang Q, Park JK, Si W, Luo Q, Jiang W, et al. An orthotopic model of human osteosarcoma growth and spontaneous pulmonary metastasis. Clin Exp Metastasis 2005; 22:319 - 329; http://dx.doi.org/10.1007/s10585-005-0365-9
- Hermann PC, Huber SL, Herrler T, Aicher A, Ellwart JW, Guba M, et al. Distinct populations of cancer stem cells determine tumor growth and metastatic activity in human pancreatic cancer. Cell Stem Cell 2007; 1:313 - 323; http://dx.doi.org/10.1016/j.stem.2007.06.002
- Brabletz T, Jung A, Spaderna S, Hlubek F, Kirchner T. Opinion: migrating cancer stem cells—an integrated concept of malignant tumour progression. Nat Rev Cancer 2005; 5:744 - 749; http://dx.doi.org/10.1038/nrc1694
- Man TK, Chintagumpala M, Visvanathan J, Shen J, Perlaky L, Hicks J, et al. Expression profiles of osteosarcoma that can predict response to chemotherapy. Cancer Res 2005; 65:8142 - 8150; http://dx.doi.org/10.1158/00085472.CAN-05-0985
- Cleton-Jansen AM, Anninga JK, Briaire-de Bruijn IH, Romeo S, Oosting J, Egeler RM, et al. Profiling of high-grade central osteosarcoma and its putative progenitor cells identifies tumourigenic pathways. Br J Cancer 2009; 101:1909 - 1918; http://dx.doi.org/10.1038/sj.bjc.6605405
- Kubista B, Klinglmueller F, Bilban M, Pfeiffer M, Lass R, Giurea A, et al. Microarray analysis identifies distinct gene expression profiles associated with histological subtype in human osteosarcoma. Int Orthop 2011; 35:401 - 411; http://dx.doi.org/10.1007/s00264-010-0996-6
- Di Cosimo S, Baselga J. Management of breast cancer with targeted agents: importance of heterogeneity. [corrected]. Nat Rev Clin Oncol 7:139 - 147; http://dx.doi.org/10.1038/nrclinonc.2009.234
- Dennis G Jr, Sherman BT, Hosack DA, Yang J, Gao W, Lane HC, et al. DAVID: Database for annotation, visualization and integrated Discovery. Genome Biol 2003; 4:3; http://dx.doi.org/10.1186/gb-2003-4-5-p3
- Wang L, Park P, Lin CY. Characterization of stem cell attributes in human osteosarcoma cell lines. Cancer Biol Ther 2009; 8:543 - 552; http://dx.doi.org/10.4161/cbt.8.6.7695
- Klein MJ, Siegal GP. Osteosarcoma: anatomic and histologic variants. Am J Clin Pathol 2006; 125:555 - 581; http://dx.doi.org/10.1309/UC6KQHLD9LV2KENN
- Singh SK, Clarke ID, Terasaki M, Bonn VE, Hawkins C, Squire J, et al. Identification of a cancer stem cell in human brain tumors. Cancer Res 2003; 63:5821 - 5828
- Clarke MF, Fuller M. Stem cells and cancer: two faces of eve. Cell 2006; 124:1111 - 1115; http://dx.doi.org/10.1016/j.cell.2006.03.011
- Lee J, Kotliarova S, Kotliarov Y, Li A, Su Q, Donin NM, et al. Tumor stem cells derived from glioblastomas cultured in bFGF and EGF more closely mirror the phenotype and genotype of primary tumors than do serum-cultured cell lines. Cancer Cell 2006; 9:391 - 403; http://dx.doi.org/10.1016/j.ccr.2006.03.030
- Rikhof B, de Jong S, Suurmeijer AJ, Meijer C, van der Graaf WT. The insulin-like growth factor system and sarcomas. J Pathol 2009; 217:469 - 482; http://dx.doi.org/10.1002/path.2499
- Zhang M, Xuan S, Bouxsein ML, von Stechow D, Akeno N, Faugere MC, et al. Osteoblast-specific knockout of the insulin-like growth factor (IGF) receptor gene reveals an essential role of IGF signaling in bone matrix mineralization. J Biol Chem 2002; 277:44005 - 44012; http://dx.doi.org/10.1074/jbc.M208265200
- Kappel CC, Velez-Yanguas MC, Hirschfeld S, Helman LJ. Human osteosarcoma cell lines are dependent on insulin-like growth factor I for in vitro growth. Cancer Res 1994; 54:2803 - 2807
- Pollak M, Sem AW, Richard M, Tetenes E, Bell R. Inhibition of metastatic behavior of murine osteosarcoma by hypophysectomy. J Natl Cancer Inst 1992; 84:966 - 971; http://dx.doi.org/10.1093/jnci/84.12.966
- Kolb EA, Kamara D, Zhang W, Lin J, Hingorani P, Baker L, et al. R1507, a fully human monoclonal antibody targeting IGF-1R, is effective alone and in combination with rapamycin in inhibiting growth of osteosarcoma xenografts. Pediatr Blood Cancer 2010; 55:67 - 75
- Ehlen HW, Buelens LA, Vortkamp A. Hedgehog signaling in skeletal development. Birth Defects Res C Embryo Today 2006; 78:267 - 279; http://dx.doi.org/10.1002/bdrc.20076
- Jiang J, Hui CC. Hedgehog signaling in development and cancer. Dev Cell 2008; 15:801 - 812; http://dx.doi.org/10.1016/j.devcel.2008.11.010
- Kessenbrock K, Plaks V, Werb Z. Matrix metalloproteinases: regulators of the tumor microenvironment. Cell 2010; 141:52 - 67; http://dx.doi.org/10.1016/j.cell.2010.03.015
- Jones PA, Baylin SB. The epigenomics of cancer. Cell 2007; 128:683 - 692; http://dx.doi.org/10.1016/j.cell.2007.01.029
- Zhang M, Behbod F, Atkinson RL, Landis MD, Kittrell F, Edwards D, et al. Identification of tumor-initiating cells in a p53-null mouse model of breast cancer. Cancer Res 2008; 68:4674 - 4682; http://dx.doi.org/10.1158/00085472.CAN-07-6353
- Liang CC, Park AY, Guan JL. In vitro scratch assay: a convenient and inexpensive method for analysis of cell migration in vitro. Nat Protoc 2007; 2:329 - 333; http://dx.doi.org/10.1038/nprot.2007.30
- Saito Y, Kitamura H, Hijikata A, Tomizawa-Murasawa M, Tanaka S, Takagi S, et al. Identification of therapeutic targets for quiescent, chemotherapy-resistant human leukemia stem cells. Sci Transl Med 2:17
- Shachaf CM, Kopelman AM, Arvanitis C, Karlsson A, Beer S, Mandl S, et al. MYC inactivation uncovers pluripotent differentiation and tumour dormancy in hepatocellular cancer. Nature 2004; 431:1112 - 1117; http://dx.doi.org/10.1038/nature03043
- Lanzkron SM, Collector MI, Sharkis SJ. Hematopoietic stem cell tracking in vivo: a comparison of short-term and long-term repopulating cells. Blood 1999; 93:1916 - 1921
- R Development Core Team. R: A language and environment for statistical computing 2011; Vienna, Austria R Foundation for Statistical Computing Available at: http://www.R-project.org/
- Smyth G, Hu Y, Dunn P, Phipson B. statmod: Statistical Modeling. R package version 1.4.8 2010; Available at: http://CRAN.R-project.org/package=statmod
- Gentleman RC, Carey VJ, Bates DM, Bolstad B, Dettling M, Dudoit S, et al. Bioconductor: open software development for computational biology and bioinformatics. Genome Biol 2004; 5:80; http://dx.doi.org/10.1186/gb-2004-5-10-r80
- Simon R, Lam A, Li MC, Ngan M, Menenzes S, Zhao Y. Analysis of gene expression data using BRB-array tools. Cancer Inform 2007; 3:11 - 17
- Benjamini Y, Drai D, Elmer G, Kafkafi N, Golani I. Controlling the false discovery rate in behavior genetics research. Behav Brain Res 2001; 125:279 - 284; http://dx.doi.org/10.1016/S0166-4328(01)00297-2
- Saeed AI, Bhagabati NK, Braisted JC, Liang W, Sharov V, Howe EA, et al. TM4 microarray software suite. Methods Enzymol 2006; 411:134 - 193; http://dx.doi.org/10.1016/S0076-6879(06)11009-5