Abstract
A right amount of oxygen and nutrients is essential for a tumor to develop. The role of oxygen dependent pathways and their regulators is therefore of utmost importance although little is known about the detailed impact they can have. Recently we have shown that inhibition of the oxygen sensor PHD2 in tumor cells blocks tumor growth due to the anti-proliferative activity of TGFβ. In this study, we refined these results by comparing different shPHD2 sequences in depth in the early phase of tumor growth. Our findings also reveal an intriguing role for MMP2 and MT1MMP in these settings, as these activated proteases display an anti-proliferative characteristic through the activation of downstream TGFβ targets. In conclusion, PHD2 inhibition is essential for the regulation of the anti-tumoral activity in mouse tumor cells and might bring some new insight in our understanding of tumor growth inhibition.
Introduction
Since tumors are growing rapidly they need a functional system that supplies them with nutrients and oxygen in order to make sure that they can expand. One of the detrimental steps in the progression of solid tumors is therefore to adapt to situations of lower oxygen conditions or hypoxia. This phenomenon consequently leads to the expression of genes that promote survival of the cells, new vessel formation and anaerobic metabolism.Citation1 The key protein in this process is hypoxia inducible factor (HIF), a transcription factor that has been shown to be required for growth of solid tumors.Citation2-Citation5 This system is controlled by a class of enzymes known as the prolyl hydroxylase domain proteins (PHDs) that hydroxylate certain prolyl residues in the oxygen sensitive HIFα protein in order to be able to bind to the VHL complex. Consequently, this leads to the ubiquitination and proteasomal degradation of HIFα.Citation6 Of the three main PHDs, PHD2 has been suggested to be the key oxygen sensor under normoxia and mild hypoxia.Citation7 Before, PHD2 was also identified as a tumor suppressor in both human colon and pancreatic carcinoma.Citation8 Conversely, recent data from our lab demonstrated that silencing of PHD2 in a mouse osteosarcoma, lung carcinoma and melanoma significantly inhibited tumor growth in immunocompetent mice.Citation9 Moreover, we also provided evidence for a link between PHD2 and the TGFβ signaling pathway, showing that inhibition of PHD2 transformed this growth factor into a tumor suppressor. In the present study, we provide more insight in the early effects of PHD2-silencing on growth inhibition. Moreover, we also found evidence for an intriguing role of matrix metalloproteinases (MMPs) in tumor growth retardation. Indeed, several MMPs are known to proteolytically cleave and activate TGFβ.Citation10-Citation12 Our results now show that loss of PHD2 in tumor cells induces the expression and activation of MMP2 and MT1MMP which leads to the transformation of TGFβ from a tumor promoter to a tumor suppressor.
Results
Inhibition of PHD2 leads to growth inhibition detectable at an early stage
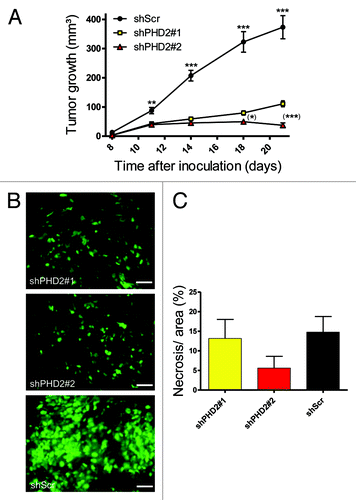
In a recent publication from our group we described two shPHD2 sequences that silence mouse PHD2 expression to a different extent (~60% for shPHD2#1 and ~80% for #2). We also demonstrated that this inhibition led to a significant reduction of tumor growth in three different cell lines in immunocompetent mice.Citation9 Due to the differential inhibition capacities of the shPHD2 sequences, we also found distinct growth patterns at later stages. Starting at day 14 after inoculation, LM8shPHD2#2 tumors tended to grow slower than shPHD2#1 tumors which turned out to be significantly different from day18 on (). Finally, shPHD2#2 tumors shrink and most of them disappear, resulting in tumor free mice, whereas shPHD2#1 tumors continue to grow but at a slower pace.Citation9 On the other hand, the control tumor cell line (shScr) grew already significantly faster than both PHD2 silenced clones by day 11. In our former study, analyses were focused on day 21 p.i. (post injection) as control tumors still grew linear at that time point. In the current study we wanted to know whether obvious differences between the studied tumor cell lines could be distinguished by day 11. Via IHC using the Ki67 marker we found that tumor cells in all shPHD2 tumors were proliferating less at this early time point compared with those in shScr tumors (), whereas no significant difference in necrosis was detected (). This confirmed previous data that the differential tumor volume observed was due to differences in proliferation rate rather than death and elimination of cells.
Figure 1. PHD2 inhibition reduces tumor cell proliferation rate and tumor growth. (A) LM8 shRNA constructs (shPHD2#1 and #2) or control LM8 (shScr) were inoculated and measured every 3–4 d (amount of tumors per group: n = 12). ** and *** represent the difference for both shPHD2#1 and #2 vs. shScr. (*) and (***) represent the difference between both shPHD2 clones (*p < 0.05, **p < 0.01 and ***p < 0.001). Tumor experiment is representative of at least five independent experiments. (B) Ki67 IHC staining (proliferation marker) on LM8 osteosarcoma tumor sections from day 11 post injection, expressing shPHD2 (#1 and #2) and control tumors (shScr). Scale bar represents 20 µm. (C) Tumor sections were stained with hematoxylin and eosin (H&E) and the necrotic area per viable area was calculated using ImageJ software. No significant difference could be observed between the different genotypes.
Differential PHD2 silencing results in an alternative outcome at day 11
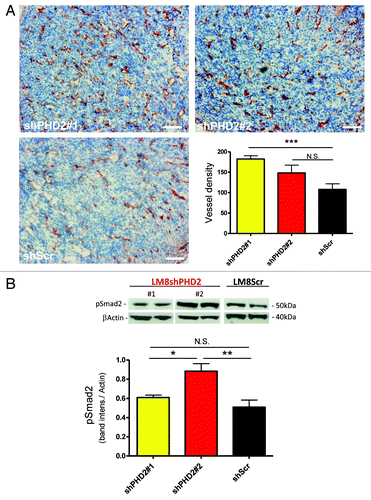
Our previous observation showed that at day 21 post-injection shPHD2 tumors contained significantly more vessels than wild type. We now show that in the early phase (day 11) only LM8shPHD2#1 tumors contain significantly more vessels compared with shScr controls, whereas shPHD2#2 tumors only showed a tendency ().Citation9 Moreover, PHD2 downregulation resulted in the activation of the anti-proliferative TGFβ pathway in which phosphorylation of Smad2 at the TGFβ receptors serves as a pivotal step. Remarkably, only shPHD2#2 tumor lysates contained significantly more phosphorylated Smad2 than their control counterparts at day11 (). In conclusion, the lower the concentration of PHD2 in LM8 tumor cells, the sooner this results in the activation of the TGFβ pathway, which is inversely related to the vessel density in these tumors.
Figure 2. Loss of PHD2 results in the increase in vessel density. (A) PECAM staining of LM8 osteosarcoma tumor sections expressing shPHD2 (#1 and #2) compared with control tumors (shScr). Vessels were counted in different areas of individual tumor (n ≥ 5) (***p < 0.001; N.S. not significant). Error bars represent mean ± SEM. Scale bar represents 50 µm. (B) Immuno-blot of tumor lysates for pSmad2 and βactin, representative samples from both shPHD2#1 and #2 and shScr tumors. Ratios are calculated as the band intensity of pSmad2versus βactin and are based on four individual samples per genotype (*p < 0.05; **p < 0.01; N.S. not significant).
PHD2 silencing induces MMP activity
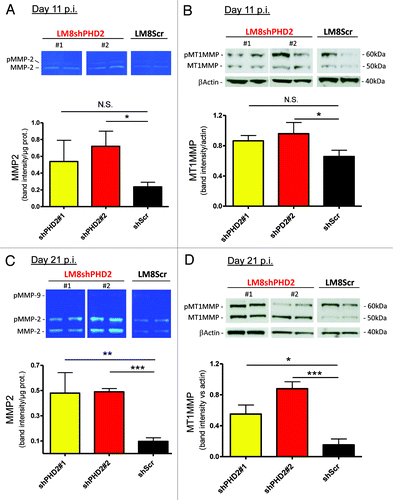
We have previously shown that the main members of the TGFβ family were elevated in LM8shPHD2 tumors as well as phosphorylation of SMAD2 demonstrating TGFβ signaling. However, it is clear that TGFβ pathway activation depends on the release of TGFβ ligands from their large latent complex that is bound to the extracellular matrix. One class of enzymes, the matrix metalloproteinases (MMPs) are known to proteolytically cleave and activate TGFβ.Citation10-Citation12 At day 11 p.i., we found that active MMP2 as well as MT1MMP was significantly upregulated but only in the tumor lysates from the most efficient PHD2 silencing clone (). Ten days later, MMP2 was highly induced (as pro- and active form) in both shPHD2 tumor types (no clear MMP9 expression could be detected) () next to a significant increase of active MT1MMP ().
Figure 3. MMP activation via PHD2 silencing in vivo. (A) shPHD2 and control tumors were isolated and equal amounts of protein lysates from randomly chosen tumor samples from both shPHD2 clones and controls were loaded on gelatin zymograms and developed as described in experimental procedures (day 11 p.i.) (pMMP = pro MMP). Graph represents quantification of active MMP2 activity (n = 4 individual samples for all groups) (*p < 0.05; N.S. not significant). (B) Protein gel blot detection of MT1MMP protein (pro and active form) on similar samples at the same time point as in (A). Graph represents quantification of active MT1MMP in tumor lysates (n = 4) (*p < 0.05; N.S. not significant). (C–D) Similar setup as in (A) and (B) respectively for tumors isolated at day 21 p.i. (*p < 0.05, **p < 0.01 and ***p < 0.001).
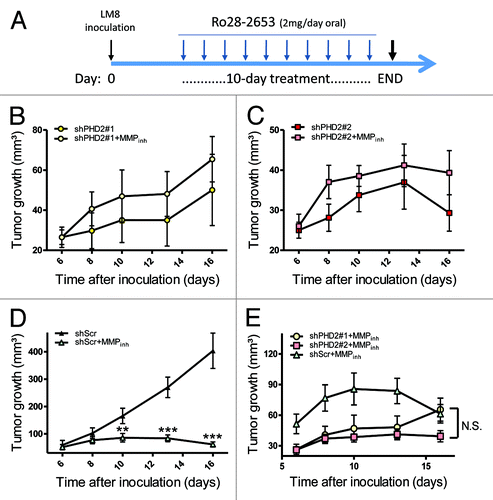
Nonetheless, this result was rather unexpected since these proteinases are renowned for their pro-tumoral activity. We therefore decided to develop an anti-MMP treatment in tumor-bearing mice using a gelatinase and MT1MMP inhibitor to investigate their impact on tumor development in this model ().Citation16 LM8shPHD2 tumors in mice treated with Ro28–2653 showed a tendency, although not significant, to grow faster than mock treated animals (). On the contrary, shScr tumor-bearing mice treated with the MMP inhibitor showed a strong reduction in tumor growth compared with their controls (). An overlay of the growth curves of all three MMP inhibitor treated tumor clones revealed that after the 10-d treatment there was no significant difference in tumor volume anymore (). These results suggest that inhibition of PHD2 in tumors induces/activates MMP2 and MT1MMP which reduces, at least in part, their proliferative potential.
Figure 4. Anti-MMP treatment in shPHD2 and control tumor bearing mice. (A) LM8 tumor cells were s.c. inoculated at the back of C3H mice. Once palpable tumors were present, 1 mg of a gelatinase/MT1MMP inhibitor (or control diluent) was given daily for 10 consecutive days (oral gavage). Tumors were isolated 24 h after the last injection (= END) and processed immediately. (B–D) LM8 cells (shPHD2#1, #2 and shScr) were inoculated in mice and either treated with the MMP inhibitor or the diluent. Tumors were measured every 2–3 d (n = 10) (**p < 0.01 and ***p < 0.001) (isolation of tumors at day 16). (E) This graph represents all growth curves from mice receiving the MMP inhibitor shown in graphs (B), (C) and (D) and in order to show the effect of the treatment on both LM8shPHD2 clones and WT counterparts. N.S., no significant difference between any of the treated clones has been found by day 16. Data are representative of three independent experiments.
MMP inhibition leads to reduced TGFβ-activation
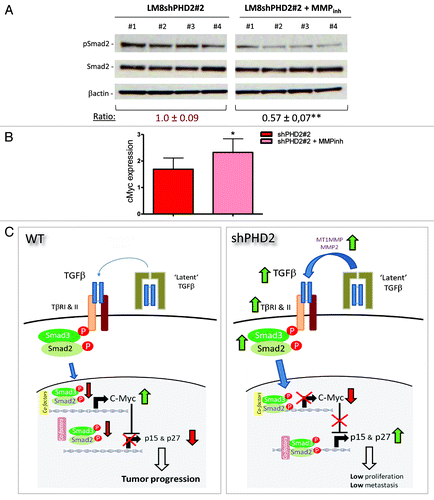
We also investigated whether the induction of MMP2 and MT1MMP in PHD2 silenced tumors was directly linked to the activation of the anti-proliferative TGFβ pathway. Therefore, we isolated the tumors from the most efficient shPHD2 clone at the end of the 10-d treatment (day 16 p.i.) and checked for the amount of phosphorylated Smad2 in their lysates. As shown in , we could detect a significant reduction of this central Smad in a group of individual tumors from mice treated with the MMP inhibitor. In addition, we have shown before that TGFβ activation via PHD2 inhibition leads to a reduction of the proto-oncogene, cMyc.Citation9 Although we could not find a significant difference in the CDK inhibitors p15LNK4B or p27KIP1 at that stage (data not shown), cMyc was significantly induced in tumors from mice treated with the MMP inhibitor (). This suggests that matrix metalloproteinases in our model function as tumor suppressors since they are directly involved in the activation of TGFβ.
Figure 5. MMP inhibition reduces TGFβ activation. (A) pSmad2 and Smad2 immunoblot on shPHD2#2 lysates of individual tumors with or without 10-d MMP inhibitor treatment. Ratios are calculated based on the band intensity of pSmad2 vs. βactin (**p < 0.01). (B) qPCR analysis for cMyc on shPHD2#2 tumors with or without MMP inhibitor treatment (n = 4 and 5 respectively) (*p < 0.05). (C) PHD2 silencing blocks tumor growth via the anti-proliferative nature of TGFβ. In an aggressive osteosarcoma the TGFβ-Smad pathway is less active and leads to pro-oncogenic signaling. PHD2 silencing leads to the induction of TGFβ members and more activation of the TGFβ-Smad pathway through MMPs. This consequently switches to an anti-proliferative system which results in reduction of tumor growth. This cartoon is adapted from an earlier publicationCitation9 with data presented in the current study.
Discussion
In the recent past, an essential but controversial role has been demonstrated for PHD2 in tumor cells. Silencing of PHD2 in human pancreatic and colorectal tumor cell lines resulted in an induction of angiogenesis and faster tumor growth in immuno-deficient mice.Citation8 In our work, using three different mouse tumor cell lines, we found that the ablation of PHD2 also resulted in a higher vessel density, but that this was accompanied by a remarkable decrease in tumor growth.Citation9 Our findings are in line with results extracted from a complete collection of human cancer microarray data (Oncomine Database) were we found that significantly more tumor types overexpress PHD2 transcripts than types that underexpress the gene (12.2 vs. 2.2% respectively). Moreover, we presented evidence for a direct relationship between PHD2 inhibition and the activation of the anti-proliferative TGFβ pathway.
In the present study, we refined our initial findings by showing that already 11 d after inoculation a clear reduction of tumor cell proliferation was detectable. Remarkably, vessel density at this stage was only significantly increased in those tumors where PHD2 inhibition is the least efficient (shPHD2#1). However, we’ve shown that in shPHD2 tumors the induction of angiogenesis is caused by an, until now, unknown factor while TGFβ can partially inhibit this endothelial cell proliferation. Since only shPHD2#2 tumors showed more TGFβ activation at day 11 (higher levels of pSmad2), increased proliferation of these vessels was more delayed than in shPHD2#1 tumors.
Another interesting finding was the induction of MMP2 and MT1MMP in all smaller LM8shPHD2 tumors which correlated with the extent of PHD2 silencing, especially at an early time point. This was unexpected because MMPs were initially identified as inducers of multiple signaling activities during tumorigenesis and have been extensively tested as targets in anticancer therapies.Citation17 However, MMPs have also been shown to correlate with better prognosis in a number of tumor types, probably accounting for the overall failure of MMP inhibitors in clinical trials.Citation18 This assumption was emphasized in our model by the differential outcome of the anti-MMP treatment. In control shScr tumors, MMP inhibition resulted in massive growth retardation, whereas the same treatment in mice carrying LM8shPHD2 tumors showed an opposite effect. This suggests that in the PHD2-inhibited tumors, higher amounts of active MMPs correlate with inhibition of tumorigenesis as well as with reduced amounts of extravasated tumor cells and lung metastasis.Citation9 Additionally, the reduction of pSmad2 and the induction of cMyc implies there may be a causal relationship between the MMPs and the activation of the anti-proliferative TGFβ pathway in our model, as has been shown previously ().Citation10,Citation12 The shPHD2 tumors may acquire and/or activate more MMP2 and MT1MMP as a result of enhanced HIF1α stabilization.Citation19,Citation20 On the other hand, our previous in vivo experiments suggest that the PHD2 effect in LM8 tumor cells is largely HIF-independent, an effect that has also been described by others.Citation8,Citation21 In addition, TGFβ itself has also been shown to induce transcription and activation of these proteases and could therefore also serve as positive feedback in the LM8shPHD2 tumors.Citation22-Citation24
In our preceding report we have also shown that LLC tumors grow slower when PHD2 is silenced. The anti-TGFβ treatment demonstrated a similar anti-proliferative role for this growth factor as seen in LM8 osteosarcoma. However, we couldn’t find any differential induction of pSmad2, whereas downstream cMyc as well as the CDK inhibitors (p15LNK4B or p27KIP1) were clearly changed in favor of growth retardation. One possible explanation for this could be that other intracellular co-factors promote the propagation of the TGFβ answer. In line with this we observed no significant difference for MMP2 and MT1MMP in lysates of shPHD2 LLC tumors compared with their controls (data not shown).
In conclusion, data presented in this study refine our earlier results and underscore the relationship between PHD2, the TGFβ paradox and MMPs during tumor development and angiogenesis. This knowledge will hopefully be useful in the development of novel therapies in the future and add valuable information to the complex role of HIF regulators and growth factors in tumors.
Materials and Methods
Cells
The murine osteosarcoma cell line LM8 (a gift from Dr. C. Beltinger of the University Children’s Hospital, Ulm, Germany)Citation13 was grown in MEMα medium supplemented with 10% heat-inactivated fetal bovine serum (FBS), NEAA and L-glutamine. All stable knock down shPHD2 and shScr cell lines have been extensively described previously.Citation9
Mice and tumor models
Animal experiments were approved by the local institutional review board for the care of animal subjects and the state of Saxony. All experiments were performed with female C3H mice between 8–12 weeks old (The University Hospital Carl Gustav Carus, Dresden University of Technology). Animals were housed in standard cages, fed a standard diet, and had free access to tap water. All mice received between 2 × 10⁶ tumor cells injected into both flanks. All tumors were measured regularly with calipers and the volume of each measurement was calculated as: (WidthCitation2 × Length)/2. The MMP inhibitor, Ro28-2653, was given as a suspension in PBS/Tween-20 orally (1 mg/mouse/day) as shown in . Control animals only received the diluent. Protein gel blotting on cell or tumor lysates was performed using antibodies against pSMAD2 (Chemicon Int.), βactin (Sigma) and MT1MMP (Abcam). Zymography on tumor lysates was performed as described previouslyCitation14 using pre-cast zymograms (Invitrogen). An equal amount of protein lysates was loaded determined via BCA Protein Assay Reagent kit (Pierce), confirmed by Ponceau red staining and βactin detection. Specific bands on radiographic films and zymograms were quantified using a BioRad densitometer and analyzed by the NIH ImageJ software.
Immunohistochemistry and Histology
For histological purposes, tumors were isolated, immediately frozen in Tissue Tek and stored at -80°C. Eight-micrometer frozen sections were stained for PECAM/CD31 (Mec13.3)Citation15 to visualize blood vessels. Vessel density was determined by manually counting PECAM-positive staining in viable tumor areas. Detection of necrotic areas in tumor sections was performed via H&E staining. Proliferating tumor cells were detected by IHC using an anti Ki67 antibody (DAKO). Fluorescent and light microscopy was done with an Axioplan-2 imaging microscope and plan Apochromat lenses (Carl Zeiss). The cameras and acquisition software were either Q Imaging Retiga 2000R and Image pro MC6.0 (fluo) or Axiocam MRc5 and Axiovision (light). Representative images are presented from experiments with similar results.
Quantitative RT-PCR
Total RNA was extracted from individual tumors using the RNeasy Mini Kit (QIAGEN). cDNAs were synthesized using Superscript First-strand synthesis (Invitrogen). Relative gene expression for cMyc was determined using Maxima SYBR Green QPCR master mix (Fermentas) on an iCycler iQ (BIO-RAD). The ΔΔCT method was used and normalization to both mTBR and EF2 as reference genes.
Statistics
Data and graphs represent mean ± SEM of representative experiments. Statistical significance was calculated by t-test (Prism v5.04), with p < 0.05 considered statistically significant.
Acknowledgments
This work was supported by the Fonds voor Wetenschappelijk Onderzoek—Vlaanderen (FWO, Belgium), the Bundesministerium für Bildung und Forschung (BMBF, Germany) and grants from the Deutsche Forschungsgemeinschaft (DFG, Germany) (WI 3291/1–1, Br1336/3–1 and 3–2, and SPP 1190 “The tumor-vessel interface” to B.W and G.B.). A.K.v.A. received financial support from the BMBF and B.W. is an Emmy Noether fellow (DFG).
Disclosure of Potential Conflicts of Interest
No potential conflicts of interest were disclosed.
References
- Bertout JA, Patel SA, Simon MC. The impact of O2 availability on human cancer. Nat Rev Cancer 2008; 8:967 - 75; http://dx.doi.org/10.1038/nrc2540; PMID: 18987634
- Du R, Lu KV, Petritsch C, Liu P, Ganss R, Passegue E, et al. HIF1alpha induces the recruitment of bone marrow-derived vascular modulatory cells to regulate tumor angiogenesis and invasion. Cancer Cell 2008; 13:206 - 20; http://dx.doi.org/10.1016/j.ccr.2008.01.034; PMID: 18328425
- Tang N, Wang L, Esko J, Giordano FJ, Huang Y, Gerber HP, et al. Loss of HIF-1alpha in endothelial cells disrupts a hypoxia-driven VEGF autocrine loop necessary for tumorigenesis. Cancer Cell 2004; 6:485 - 95; http://dx.doi.org/10.1016/j.ccr.2004.09.026; PMID: 15542432
- Ryan HE, Lo J, Johnson RS. HIF-1 alpha is required for solid tumor formation and embryonic vascularization. EMBO J 1998; 17:3005 - 15; http://dx.doi.org/10.1093/emboj/17.11.3005; PMID: 9606183
- Ryan HE, Poloni M, McNulty W, Elson D, Gassmann M, Arbeit JM, et al. Hypoxia-inducible factor-1alpha is a positive factor in solid tumor growth. Cancer Res 2000; 60:4010 - 5; PMID: 10945599
- Kaelin WG Jr., Ratcliffe PJ. Oxygen sensing by metazoans: the central role of the HIF hydroxylase pathway. Mol Cell 2008; 30:393 - 402; http://dx.doi.org/10.1016/j.molcel.2008.04.009; PMID: 18498744
- Berra E, Benizri E, Ginouves A, Volmat V, Roux D, Pouyssegur J. HIF prolyl-hydroxylase 2 is the key oxygen sensor setting low steady-state levels of HIF-1alpha in normoxia. EMBO J 2003; 22:4082 - 90; http://dx.doi.org/10.1093/emboj/cdg392; PMID: 12912907
- Chan DA, Kawahara TL, Sutphin PD, Chang HY, Chi JT, Giaccia AJ. Tumor vasculature is regulated by PHD2-mediated angiogenesis and bone marrow-derived cell recruitment. Cancer Cell 2009; 15:527 - 38; http://dx.doi.org/10.1016/j.ccr.2009.04.010; PMID: 19477431
- Ameln AK, Muschter A, Mamlouk S, Kalucka J, Prade I, Franke K, et al. Inhibition of HIF prolyl hydroxylase-2 blocks tumor growth in mice through the antiproliferative activity of TGFβ. Cancer Res 2011; 71:3306 - 16; http://dx.doi.org/10.1158/0008-5472.CAN-10-3838; PMID: 21436457
- Wang M, Zhao D, Spinetti G, Zhang J, Jiang LQ, Pintus G, et al. Matrix metalloproteinase 2 activation of transforming growth factor-beta1 (TGF-beta1) and TGF-beta1-type II receptor signaling within the aged arterial wall. Arterioscler Thromb Vasc Biol 2006; 26:1503 - 9; http://dx.doi.org/10.1161/01.ATV.0000225777.58488.f2; PMID: 16690877
- Yu Q, Stamenkovic I. Cell surface-localized matrix metalloproteinase-9 proteolytically activates TGF-beta and promotes tumor invasion and angiogenesis. Genes Dev 2000; 14:163 - 76; PMID: 10652271
- Tatti O, Vehvilainen P, Lehti K, Keski-Oja J. MT1-MMP releases latent TGF-beta1 from endothelial cell extracellular matrix via proteolytic processing of LTBP-1. Exp Cell Res 2008; 314:2501 - 14; http://dx.doi.org/10.1016/j.yexcr.2008.05.018; PMID: 18602101
- Wei J, Blum S, Unger M, Jarmy G, Lamparter M, Geishauser A, et al. Embryonic endothelial progenitor cells armed with a suicide gene target hypoxic lung metastases after intravenous delivery. Cancer Cell 2004; 5:477 - 88; http://dx.doi.org/10.1016/S1535-6108(04)00116-3; PMID: 15144955
- Wielockx B, Lannoy K, Shapiro SD, Itoh T, Itohara S, Vandekerckhove J, et al. Inhibition of matrix metalloproteinases blocks lethal hepatitis and apoptosis induced by tumor necrosis factor and allows safe antitumor therapy. Nat Med 2001; 7:1202 - 8; http://dx.doi.org/10.1038/nm1101-1202; PMID: 11689884
- Vecchi A, Garlanda C, Lampugnani MG, Resnati M, Matteucci C, Stoppacciaro A, et al. Monoclonal antibodies specific for endothelial cells of mouse blood vessels. Their application in the identification of adult and embryonic endothelium. Eur J Cell Biol 1994; 63:247 - 54; PMID: 8082649
- Lein M, Jung K, Ortel B, Stephan C, Rothaug W, Juchem R, et al. The new synthetic matrix metalloproteinase inhibitor (Roche 28-2653) reduces tumor growth and prolongs survival in a prostate cancer standard rat model. Oncogene 2002; 21:2089 - 96; http://dx.doi.org/10.1038/sj.onc.1205267; PMID: 11960381
- Overall CM, Kleifeld O. Tumour microenvironment - opinion: validating matrix metalloproteinases as drug targets and anti-targets for cancer therapy. Nat Rev Cancer 2006; 6:227 - 39; http://dx.doi.org/10.1038/nrc1821; PMID: 16498445
- Fingleton B. MMPs as therapeutic targets–still a viable option?. Semin Cell Dev Biol 2008; 19:61 - 8; http://dx.doi.org/10.1016/j.semcdb.2007.06.006; PMID: 17693104
- Ridgway PF, Ziprin P, Alkhamesi N, Paraskeva PA, Peck DH, Darzi AW. Hypoxia augments gelatinase activity in a variety of adenocarcinomas in vitro. J Surg Res 2005; 124:180 - 6; http://dx.doi.org/10.1016/j.jss.2004.10.020; PMID: 15820246
- Muñoz-Ńjar UM, Neurath KM, Vumbaca F, Claffey KP. Hypoxia stimulates breast carcinoma cell invasion through MT1-MMP and MMP-2 activation. Oncogene 2006; 25:2379 - 92; http://dx.doi.org/10.1038/sj.onc.1209273; PMID: 16369494
- Barth S, Edlich F, Berchner-Pfannschmidt U, Gneuss S, Jahreis G, Hasgall PA, et al. Hypoxia-inducible factor prolyl-4-hydroxylase PHD2 protein abundance depends on integral membrane anchoring of FKBP38. J Biol Chem 2009; 284:23046 - 58; http://dx.doi.org/10.1074/jbc.M109.032631; PMID: 19546213
- Derynck R, Akhurst RJ, Balmain A. TGF-beta signaling in tumor suppression and cancer progression. Nat Genet 2001; 29:117 - 29; http://dx.doi.org/10.1038/ng1001-117; PMID: 11586292
- Stawowy P, Margeta C, Kallisch H, Seidah NG, Chretien M, Fleck E, et al. Regulation of matrix metalloproteinase MT1-MMP/MMP-2 in cardiac fibroblasts by TGF-beta1 involves furin-convertase. Cardiovasc Res 2004; 63:87 - 97; http://dx.doi.org/10.1016/j.cardiores.2004.03.010; PMID: 15194465
- Hagedorn HG, Bachmeier BE, Nerlich AG. Synthesis and degradation of basement membranes and extracellular matrix and their regulation by TGF-beta in invasive carcinomas. [Review] Int J Oncol 2001; 18:669 - 81; PMID: 11251160