Abstract
Background: Mutations that activate the PI3K/AKT/mTOR pathway are relatively common in urothelial (bladder) cancers, but how these pathway mutations affect AKT dependency is not known. We characterized the relationship between AKT pathway mutational status and sensitivity to the effects of the selective AKT kinase inhibitor AZ7328 using a panel of 12 well-characterized human bladder cancer cell lines.
Methods: Sequenome DNA sequencing was performed to identify mutations in a panel of 12 urothelial cancer cell lines. Drug-induced proliferative inhibition and apoptosis were quantified using MTT assays and propidium iodide staining with FACS analyses. Protein activation via phosphorylation was measured by immunoblotting. Autophagy was measured by LC3 immunofluorescence and immunoblotting.
Results: AZ7328 inhibited proliferation and AKT substrate phosphorylation in a concentration-dependent manner but had minimal effects on apoptosis. Proliferative inhibition correlated loosely with the presence of activating PIK3CA mutations and was strengthened in combination with the mTOR inhibitor rapamycin. AZ7328 induced autophagy in some of the lines, and in the cells exposed to a combination of AZ7328 and chemical autophagy inhibitors apoptosis was induced.
Conclusions: The cytostatic effects of AZ7328 correlate with PIK3CA mutations and are greatly enhanced by dual pathway inhibition using an mTOR inhibitor. Furthermore, AZ7328 can interact with autophagy inhibitors to induce apoptosis in some cell lines. Overall, our results support the further evaluation of combinations of PI3K/AKT/mTOR pathway and autophagy inhibitors in pre-clinical in vivo models and ultimately in patients with PIK3CA mutant bladder cancers.
Introduction
Bladder cancer is consistently among the top ten most common cancers and causes of cancer death in both men and women. In the United States, there are greater than 70,000 new cases of bladder cancer reported per year and greater than 14,000 deaths. In the last ten years, the death rate from this disease is essentially unchanged, whereas great strides have been made in other diseases.Citation1 Thus, there is an enormous need to improve current treatment regimens in both the local and advanced setting and to develop novel strategies to prevent or delay progression, which is the main determinant of poor outcome.
The phosphatidylinositol 3-kinase (PI3K/AKT/mTOR) pathway is one of the core signal transduction pathways downstream of receptor tyrosine kinases (RTKs) that control cell metabolism, proliferation, protein synthesis, cell size, autophagy, angiogenesis and motility.Citation2 Within this pathway, AKT (otherwise known as protein kinase B [PKB]) appears to play a central role as a key mediator of growth factor-dependent survival via phosphorylation-dependent inhibition of Bcl-2-associated death promoter (BAD) and Forkhead Box 03 (FOXO3) and activation of NFκB/p65.Citation2-Citation4 A large fraction of bladder cancers contain mutations, including activating mutations in the type-3 receptor for fibroblast growth factors (FGFR3), H-, N- and K-RAS and PIK3CA, deletion of the tumor suppressor PTEN and inactivation of tuberous sclerosis complex [TSC-1 (an upstream inhibitor of mTOR)],Citation5-Citation12 that should activate components of the PI3K/AKT/mTOR pathway. Furthermore, studies employing genetically engineered mouse models of bladder cancer have established causal roles for loss of PTEN and mTOR activation in disease progression.Citation13,Citation14 Therefore, there is considerable interest in defining the determinants of sensitivity to clinically available PI3K/AKT/mTOR pathway inhibitors in preclinical models of bladder cancer and designing clinical trials to evaluate the efficacies of these inhibitors in patients.Citation15
The current study was initially designed to test the hypothesis that small molecule inhibition of AKT (using AZ7328) would preferentially promote apoptosis in human bladder cancer cells, which contain mutations that activate the PI3K/AKT/mTOR pathway. We also compared the effects of AKT inhibition with AZ7328 to that of the classic mTOR inhibitor rapamycin and studied the effects of combination therapy with dual pathway inhibition. Contrary to our expectations, AZ7328 had no significant effects on apoptosis, either alone or when it was combined with conventional chemotherapeutics or TNF-related apoptosis-inducing ligand (TRAIL). However, we discovered that AZ7328 strongly induces autophagy in most of the cell lines tested, presumably as a cytoprotective response to the metabolic stress caused by AKT inhibition. In these cells AZ7328 interacted with chemical autophagy inhibitors to induce apoptosis. The potential clinical/translational relevance of our findings is discussed.
Results
Components of the PI3K/AKT/mTOR pathway are mutated in a large subset of bladder cancers,Citation16 making activated AKT an attractive candidate therapeutic target in the disease. We hypothesized that tumors with alterations that activate the PI3K/AKT/mTOR pathway would be especially sensitive to the anti-proliferative and pro-apoptotic effects of AZ7328, a novel small molecule AKT kinase inhibitor. To test this hypothesis, we first characterized a subset of 12 molecularly diverse human bladder cancer cell lines for the presence of specific activating oncogene mutations and inactivation or mutation of tumor suppressors (). Our gene sequencing results were cross-referenced with those of the COSMIC (Catalogue of Somatic Mutations in Cancer) cancer database for accuracy and all differences were reconciled. Two thirds of the cell lines (8/12) possessed at least one molecular defect that would be expected to promote PI3K/AKT/mTOR pathway activation and six contained multiple activating mutations. The following molecular alterations were found: EGFR amplification (UM-UC-5),Citation17 FGFR3 point mutation (J82, UM-UC-6, UM-UC-14, UM-UC-16), c-MET point mutation (T24, UM-UC-6), PIK3CA alteration (253J BV, J82, UM-UC-3, UM-UC-5, UM-UC-6, UM-UC-16) and H or K-Ras mutations (T24 and UM-UC-3). There were no activating AKT mutations in our panel of cells.
Table 1. Summary of PI3K/AKT pathway activating oncogenic mutations in a panel of 12 bladder cancer cell lines. Highlighted mutations include EGFR, FGFR3, c-MET, PIK3CA, RAS and AKT 1/2/3
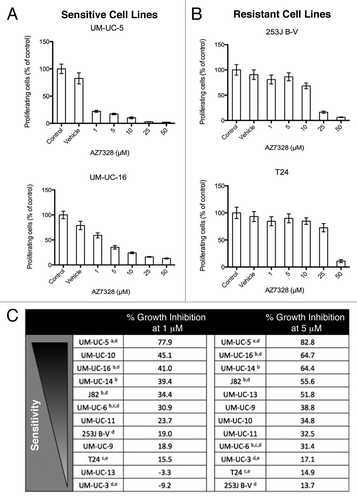
We then exposed the cells to increasing concentrations of AZ7328 and measured cell proliferation at 48 and 120 h by MTT reduction (, ). We rank ordered the cells lines accordingly by sensitivity to AZ7328 at 1 and 5 μM drug concentrations ( and ). We extended these observations in one cell line on the sensitive end of the spectrum (UM-UC-5) and one on the resistant end (T24) to confirm proliferative inhibition measured by a reduction in DNA synthesis using a [3H] thymidine incorporation assay (Fig. S1). All of the cell lines that were relatively more sensitive to AZ7328 at 48 h had an activating PIK3CA mutation (UM-UC-5, UM-UC-6, UM-UC-16). However, there was variability in the PI3K/AKT/mTOR pathway alterations among those cell lines more resistant to AZ7328 at 48 h, yielding an unpredictable pattern of resistance. With longer drug exposure (120 h), the sensitive (UM-UC-5 and UM-UC-6) and resistant (253J B-V and T24) relationships remained generally constant.
Figure 1. Sensitivity of bladder cancer cell lines to increasing concentrations of AZ7328 as measured in 48 h MTT assays. (A) The anti-proliferative effects of AZ7328 in two relatively sensitive cell lines (UM-UC-5 and UM-UC-16). (B) The anti-proliferative effects of AZ7328 in two relatively resistant cell lines (253J B-V and T24). Note the differences in scales. C, Rank ordering of sensitivity to AZ7328 at 48 h of exposure in a panel of 12 bladder cancer cell lines by the percentage of proliferative inhibition induced at both 1 and 5 μM concentrations. (aEGFR amplification, bFGFR3 mutation, cc-MET mutation, dPIK3CA mutation, eRAS mutation)
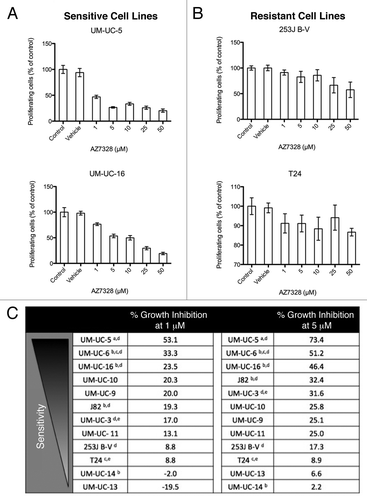
Figure 2. Sensitivity of bladder cancer cell lines to increasing concentrations of AZ7328 as measured in a 120 h MTT assay. (A) The anti-proliferative effects of AZ7328 in two relatively sensitive cell lines (UM-UC-5 and UM-UC-16). (B) The anti-proliferative effects of AZ7328 in two relatively resistant cell lines (253J B-V and T24). (C) Rank ordering of sensitivity to AZ7328 at 120 h of exposure in a panel of 12 bladder cancer cell lines by the percentage of proliferative inhibition induced at both 1 and 5 μM concentrations. (aEGFR amplification, bFGFR3 mutation, cc-MET mutation, dPIK3CA mutation, eRAS mutation)
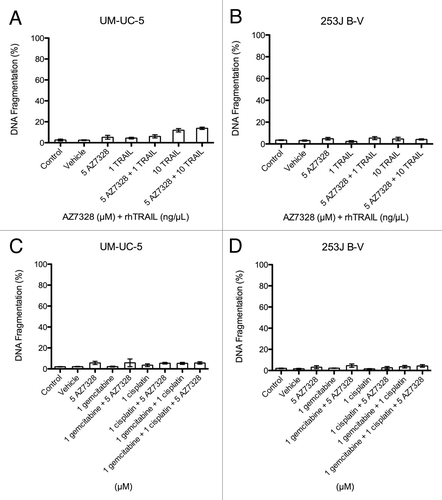
In a previous study we reported that EGFR inhibition, upstream of PI3K/AKT/mTOR, augmented TRAIL-induced apoptosis via an AKT-dependent mechanism.Citation18 We therefore sought to evaluate whether direct AKT inhibition might also enhance apoptosis via the extrinsic pathway. We used PI-FACS to assess apoptosis-associated DNA fragmentation, which emerges as a sub-G1 population upon cell sorting. At 24 h, we observed minimal induction of apoptosis in AZ7328 resistant cell lines (253J B-V), whereas a more sensitive cell line (UM-UC-5), displayed very modest levels of cell death in response to the combination of AZ7328 plus rhTRAIL (). Furthermore, neither cell line showed any induction of apoptosis mediated by the intrinsic pathway when exposed to AZ7328 in combination with gemcitabine and/or cisplatin at clinically relevant concentrations (). A subset of these experiments were confirmed by varying cell lines, duration of drug exposure and drug concentration (Fig. S2).
Figure 3. Effects of AZ7328 on apoptosis. Bladder cancer cell lines were exposed to 5 μM AZ7328 alone and in combination with either 1 ng/mL or 10 ng/mL rhTRAIL or chemotherapy. Apoptotic cells were quantified by PI-FACS. (A) Effects of AZ7328 with or without TRAIL in a sensitive cell line (UM-UC-5). (B) Effects of AZ7328 with or without TRAIL in a resistant cell line (253J B-V). (C) Effects of AZ7328 with or without various combinations of both 1 μM gemcitabine and 1 μM cisplatin in a sensitive cell line (UM-UC-5). (D) Effects of AZ7328 with or without various combinations of both 1 μM gemcitabine and 1 μM cisplatin in a resistant cell line (253J B-V).
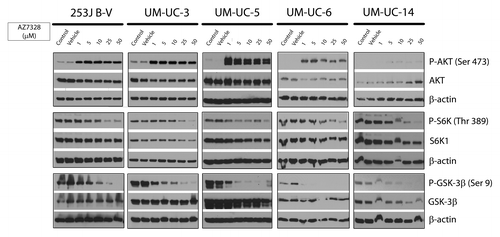
To confirm that AZ7328 blocked AKT, we assessed the status of phospho-AKT and downstream targets in cells lines throughout the spectrum of sensitivity. We chose to evaluate several extensively studied downstream targets of the PI3K/AKT/mTOR pathway: ribosomal p70s6 kinase 1 (or S6K1, which controls protein synthesis and cell growth), GSK-3β (which controls cell metabolism), cyclin D1 (a cell cycle progression protein) and p27 (a cyclin dependent kinase inhibitor).Citation19-Citation21 We measured drug effects at the 1–3 h time point because time course studies indicated maximal drug effect within this range (Fig. S3). Our first dose response experiments confirmed that AZ7328 reduced phosphorylation of S6K1 and GSK-3β to a similar extent at corresponding concentrations in all the cell lines assessed (). We also observed a strong concentration-dependent increase in the levels of phosphorylated AKT (at both phosphorylation sites) consistent with prior findings showing that ATP-competitive inhibitors of AKT hold the protein in a hyperphosphorylated but catalytically inactive form (Fig. S4).Citation22 We then went on to confirm on-target effects of AZ7328 by demonstrating a dose dependent decrease in the downstream molecule cyclin D1. There was, however, no change in p27 level (Fig. S5). Together, our results showed that the effects of the drug on substrate phosphorylation were consistent across the cell lines in spite of the observed differences in their sensitivities to AZ7328-induced proliferative inhibition.
Figure 4. Pharmacodynamic response of selected cell lines to AZ7328. Each column represents a dose response assessment of the following markers within a cell line (immunoblotting with phospho-AKT, phospho-S6K1 and phospho-GSK-3β).
Although PTEN deletion is a relatively rare event, reduced PTEN expression is found in a majority of muscle-invasive bladder cancers.Citation23 Therefore, in addition to characterizing cell lines for the presence of inactivating mutations, we also measured PTEN protein levels by immunoblotting. Among the 12 cell lines tested, we found PTEN to be completely absent in two (J82 and UM-UC-3), but there was a 50% decrease in amount of PTEN in three additional cell lines (UM-UC-9, UM-UC-10 and UM-UC-16) (). Of these cell lines, UM-UC-16 displayed the greatest relative sensitivity to AKT inhibition, followed by J82, UM-UC-9 and UM-UC-10. Given the variability in PTEN expression among the responders and non-responders it is unreliable to assign any predictive ability of PTEN status to AZ7328 sensitivity.
Figure 5. Potential predictors of response to AKT inhibition. (A) Western blot analysis of baseline PTEN status among the panel of 12 cell lines. The corresponding relative density indicates the PTEN band intensity relative to β-actin. (B) Western blot analysis of baseline AKT Ser 473 phosphorylation status among the panel of 12 cell lines. The corresponding relative densities indicate the phospho-AKT band intensity relative to total AKT.
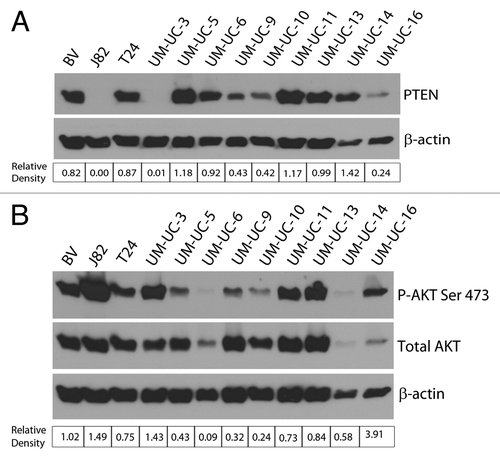
AKT phosphorylation is controlled by many upstream inputs.Citation2 Therefore, we also compared baseline AKT phosphorylation levels across our panel as a more direct measure of AKT activity (). Interestingly, high basal AKT phosphorylation was not associated with either PIK3CA/PTEN status or sensitivity to AKT inhibition. For example, UM-UC-11 and UM-UC-13 (neither of which have PI3K/AKT/mTOR pathway activation) expressed high basal phospho-AKT levels despite being relatively resistant to AZ7328. Conversely, UM-UC-5 and UM-UC-6 cells expressed relatively low phospho-AKT levels even though they both contain activating PIK3CA mutations and were more sensitive to AKT inhibition. These discrepancies might be due to the absence of upstream signaling that may be required to strongly activate the pathway regardless of PIK3CA/PTEN mutational status. Irrespective of the mechanisms involved, the data clearly show that levels of phospho-AKT expression are also not predictive of sensitivity to AKT inhibition in bladder cancer cells.
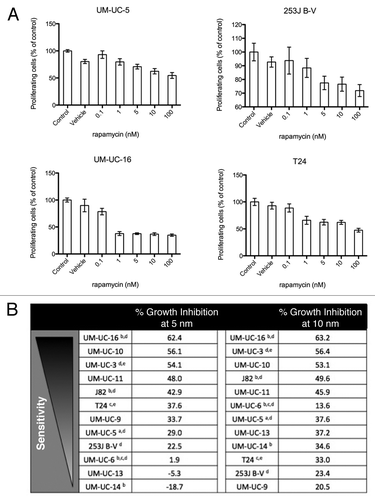
mTOR is a downstream effector of AKT that is important for many cellular processes including autophagy, cell cycle progression (from G0/G1 to S phase), cell proliferation, angiogenesis and apoptosis. In bladder cancer cell lines, mTOR inhibition with rapamycin has been shown to significantly decrease bladder cancer cell proliferation and induce G0/G1 cell-cycle arrest without stimulating apoptosis in vitro and in vivo.Citation24-Citation26 In our panel of cell lines, rapamycin induced heterogeneous and partial growth arrest that plateaued at drug concentrations around 10 nM (). Interestingly, the patterns of sensitivity to rapamycin and AZ7328 were quite distinct. For example, UM-UC-3 and UM-UC-11 were relatively more sensitive to rapamycin than AZ7328, whereas UM-UC-5 and UM-UC-6 were relatively more sensitive to AZ7328 than rapamycin. Nevertheless, 253J B-V and T24 and were highly resistant to both AKT and mTOR inhibition.
Figure 6. Sensitivity of bladder cancer cell lines to increasing concentrations of rapamycin as measured in a 120 h MTT assay. (A) The anti-proliferative effects of rapamycin in four cell lines (UM-UC-5, UM-UC-16, 253J B-V and T24). Note the differences in scales. (B) Rank ordering of sensitivity to rapamycin at 120 h of exposure in a panel of 12 bladder cancer cell lines by the percentage of proliferative inhibition induced at both 5 and 10 νM concentrations. (aEGFR amplification, bFGFR3 mutation, cc-MET mutation, dPIK3CA mutation, eRAS mutation)
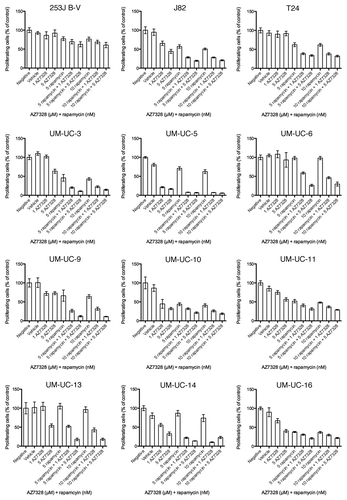
It is well known that there exists a feedback downregulation of RTK signaling in cells with constitutive mTOR activation. mTOR inhibition relieves this feedback and causes AKT activation, which attenuates the antitumor effects of mTOR inhibitors.Citation27 These preclinical observations have been reproduced in humans.Citation28 Thus, combination therapy targeting both mTOR and AKT may produce enhanced antitumor activity relative to the effects of mTOR inhibition alone. To test this hypothesis, we exposed our panel of bladder cancer cells to the combination of rapamycin plus AZ7328 and we found at least additive effects of the two drugs. This improved response was seen in all but one of the 12 cell lines tested (253J B-V) (). Thus, resistance to the cytostatic effects of either single agent alone can be overcome in most bladder cancer cell lines with combination therapy in vitro.
Figure 7. Sensitivity of all 12 bladder cancer cell lines to various combinations of AZ7328 and rapamycin as measured in a 120 h MTT assay.
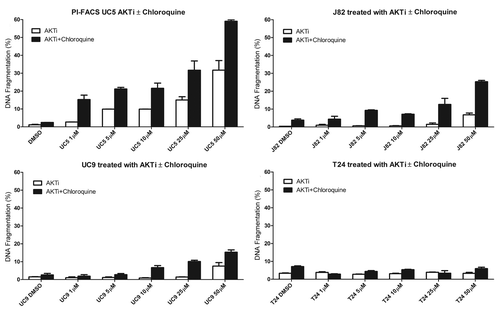
Active PI3K/AKT/mTOR signaling is associated with high rates of cellular metabolism and protein synthesis.Citation29 Autophagy is a cytoprotective adaptive response to nutrient deprivation in yeast or the absence of growth factor receptor signaling in metazoans that functions to provide a source of energy and amino acids when extracellular sources are not accessible. One of the major consequences of active mTOR signaling is suppression of autophagy.Citation30,Citation31 We therefore questioned whether AZ7328, by virtue of blocking AKT-mediated mTOR signaling, might stimulate autophagy in our cell lines, thereby masking pro-apoptotic effects of AKT inhibition. To examine this possibility, a select group of cell lines with varying levels of cytostatic response to AKT inhibition were exposed to various concentrations of AZ7328. Autophagy was assessed via anti-LC3 immunoblotting, to identify the accumulation of autophagosome components.Citation32 AZ7328 induced LC3 processing in three of the four cell lines (UC5, UC9 and J82). We confirmed these results in the J82 and T24 cell lines using anti-LC3 immunofluorescence,Citation32 which clearly revealed drug-induced LC3 punctae, indicating autophagosome formation in the former but not the latter (). To determine whether this induction of autophagy was an important cytoprotective mechanism, we exposed the cell lines to AZ7328 plus the chemical autophagy inhibitor chloroquine and quantified levels of apoptosis by PI-FACS. The combination of AZ7328 and chloroquine induced apoptosis in the cells that displayed drug-induced autophagy (UC5, UC9 and J82), but not in the T24 cells (). Together, our results provide a strong rationale for evaluating the toxicity and efficacy of combination therapy with AZ7328 plus mTOR and/or autophagy inhibitors in preclinical in vivo models and subsequently in bladder cancer patients.
Figure 8. Concentration-dependent effects of AZ7328 on autophagy. (A) Immunoblot displaying LC3-I and LC3-II expression in four representative cell lines (J82, UM-UC-5, UM-UC-9 and T24). The LC3 bands were quantified using Image J software and the bar graphs show the ratio of LC3-II to LC3-I as a function of autophagy. (B) Immunofluorescence analysis of LC-3 localization in J82 and T24 cells. Note that punctate LC-3 staining (green) is characteristic of autophagy.
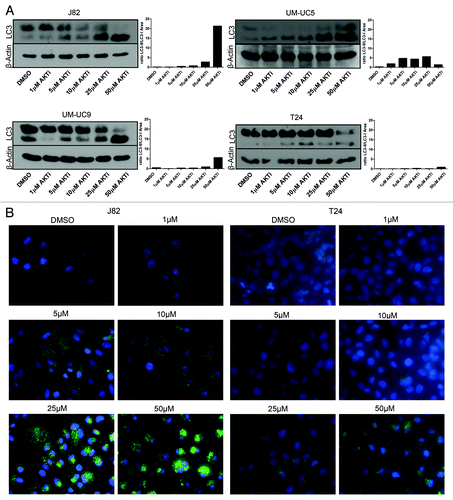
Figure 9. Effect of AZ7328 on apoptosis, as single agent or in combination with chloroquine. Bladder cancer cells (J82, UM-UC-5, UM-UC-9 and T24) were exposed to increasing concentrations of AZ7328 alone or in combination with a fixed dose of 50 µM chloroquine. Apoptotic cells were quantified by PI-FACS.
Discussion
We began our study by testing the hypothesis that AKT inhibition via the novel small molecule inhibitor AZ7328 would promote cell death as a single agent and would enhance the effects of conventional cytotoxic agents and TRAIL in human bladder cancer cells in vitro. Even though the drug blocked the AKT pathway in all of the cell lines examined and induced a range of proliferative inhibition, it had no significant effects on cell death. We next sought to identify predictors of response to AZ7328-induced proliferative inhibition. Large subsets of bladder cancers contain mutations in FGFR3, PIK3CA, RAS and PTEN that might be predicted to drive constitutive AKT activation. Thus, we examined the activity of AZ7328 in an expanded panel of molecularly diverse human bladder cancer cell lines to determine whether sensitivity to proliferative inhibition could be predicted by mutational status. Represented in our panel were cells containing activating mutations in FGFR3 (J82, UM-UC-6, UM-UC-14, UM-UC-16), c-MET (T24, UM-UC-6), PIK3CA (253J B-V, J82, UM-UC-3, UM-UC-5, UM-UC-6, UM-UC-16), or RAS (T24, UM-UC-3), EGFR amplification (UM-UC-5), or PTEN deletion (J82, UM-UC-3). Sensitivity to AKT inhibition appeared to only moderately correlate with the presence of activating PIK3CA mutations.
There are three known hotspot mutations in PIK3CA: H1047R, E542K and E545K, of which two were found in our panel of 12 cell lines. The E545K mutation disrupts an inhibitory charge-charge interaction between p110 and the N-terminal SH2 domain of the p85 regulatory subunit.Citation33 The H1047R mutation causes enhanced lipid kinase activity and increases the binding affinity of PI3K for the negatively charged phosphatidylinositol substrate.Citation34 The third mutation (P124L) is found in a region of four helices between the adaptor-binding and RAS-binding domains, the function of which is not known. However, a similar missense mutation is found in colorectal cancers suggesting that P124L may be a relevant activating mutation.Citation35 Approximately 25% of all bladder cancers contain activating PIK3CA mutations; of these, E545K mutations make up 52% and H1047R 13% of the total.Citation16 There appears to be a significant association between the presence of activating PIK3CA mutations and low grade and early stage disease.Citation16 Thus, AKT inhibition might be efficiently utilized to reduce the rate of recurrences in patients with non-muscle invasive bladder cancer.
Surprisingly, we failed to observe a strong correlation between the loss of PTEN or activated, phosphorylated AKT and sensitivity to proliferative inhibition induced by AKT inhibition. Thus, further molecular characterization is necessary before we are able to identify biomarkers that precisely predict sensitivity to AKT inhibition. It may be significant that 6/7 of the cell lines with high basal phospho-AKT levels express molecular features of epithelial-to-mesenchymal transition (EMT).Citation36,Citation37 We plan to investigate whether there a direct cause-effect relationship exists between EMT and AKT activation in future studies.
We were also surprised to observe very distinct patterns of sensitivity and resistance to AKT and mTOR inhibition in spite of the fact that the mTORC1 complex is a downstream target of AKT. Interestingly, exposure to the combination of AZ7328 plus rapamycin produced at least additive inhibition of proliferation in 11 of the 12 cell lines. Because previous studies have demonstrated that mTOR inhibition results in AKT activation in preclinical models as well as in clinical trials employing rapamycin analogs in patients, it is likely that the potency of double pathway inhibition involves prevention of this phenomenon.
TSC is a syndrome resulting from the loss of two autosomal dominant genes that produce harmartin (TSC1) and tuberin (TSC2).Citation38,Citation40 Functionally, the TSC1/TSC2 complex is downstream of AKT where TSC2 is directly phosphorylated and inactivated by AKT. TSC activation attenuates mTOR via a specific GTPase activating protein activity of TSC2 toward RAS homolog enriched in brain (RHEB).Citation40 Deletions of the long arm of chromosome 9 are the most common genetic alterations in urothelial carcinoma and mapping studies have linked this with the TSC1 locus.Citation41 Other studies have found TSC1 mutations in 12% of bladder tumors. These results indicate that TSC1 mutations may play a role in the development of many sporadic bladder tumors.Citation42 We screened our panel of cell lines for the level of TSC1 protein expression and found a varying range; however, these differences did not correlate with sensitivity to mTOR inhibition with rapamycin (Fig. S5).
One of the most familiar effects of active PI3K/AKT/mTOR pathway signaling is the suppression of autophagy.Citation31 Autophagy is an evolutionarily conserved survival mechanism and recent studies have established that autophagy limits the cytotoxic effects of conventional therapies in tumors.Citation30,Citation31 In an attempt to understand the lack of effect on cell death using AZ7328, we speculated that inhibition of the pathway might activate autophagy in bladder cancer cells, which would be expected to inhibit drug-induced cell death. Our results confirmed that three out of the four cell lines we tested displayed strong, concentration-dependent increases in autophagy following incubation with the drug and in these cell lines combinations of AZ7328 plus chemical autophagy inhibitors induced apoptosis. Many targeted agents produce primarily cytostatic effects in cancer cells and many of these agents inhibit the PI3K/AKT/mTOR pathway. It is tempting to speculate that autophagy may limit the cytotoxic activities of all of these agents, a hypothesis we are currently testing using inhibitors of growth factor receptors (EGFR, FGFR and IGF-1R) and mTOR. An important question for future studies is to determine whether combinations of these targeted agents plus autophagy inhibitors produce excessive toxicity in pre-clinical animal models, which we are also currently investigating.
In conclusion, our results show that the AKT inhibitor AZ7328 exerts largely cytostatic effects on urothelial tumor cells in vitro. Sensitivity to AZ7328-induced growth arrest was loosely associated with the presence of activating PIK3CA mutations but not with baseline AKT phosphorylation or PTEN deletions. Combinations of AZ7328 and the mTOR inhibitor rapamycin had strong additive cytostatic effects but still did not produce cell death. Rather, our data strongly suggest that induction of autophagy interacts with other previously identified cytoprotective feedback mechanisms to block cell death in most human bladder cancer cells. Autophagy inhibition is an attractive, mechanism-based strategy to better exploit the biological effects of AZ7328 and other agents that inhibit the PI3K/AKT/mTOR pathway.
Materials and Methods
Cell lines and culture conditions
The University of Michigan Urothelial Cancer (UM-UC) panel of cell lines was acquired and genotyped by the Specimen Core of the MD Anderson Specialized Program of Research Excellence (SPORE) in Bladder Cancer. Cell lines were validated by short tandem repeat (STR) DNA fingerprinting using the AmpFλSTR Identifiler kit according to manufacturer instructions (Applied Biosystems). The STR profiles were compared with known American Type Culture Collection (ATCC) fingerprints (ATCC.org), to the Cell Line Integrated Molecular Authentication database (CLIMA) version 0.1.200808 (http://bioinformatics.istge.it/clima/) (Nucleic Acids Research 37:D925-D932 PMCID: PMC2686526) and to the MD Anderson fingerprint database. The STR profiles matched known DNA fingerprints or were unique. The metastatic human urothelial cell line 253J B-V was generated in our laboratory from the 253J parental cell line by orthotopic “recycling” in nude mice.Citation43 All cell lines were maintained at 37°C with 5% C02 in modified Eagle’s MEM supplemented with 10% fetal bovine serum (FBS), vitamins, sodium pyruvate, L-glutamine, penicillin, streptomycin and non-essential amino acids.
Reagents and antibodies
AZ7328, a competitive inhibitor of the AKT ATP-binding domain, was provided by AstraZeneca. The drug was reconstituted in dimethyl sulfoxide (DMSO) and stored at -20°C until use. The stock solution was diluted in medium just before use, so that the DMSO concentration never exceeded 0.1%. Recombinant human (rhTRAIL) was purchased from R&D Systems, gemcitabine from Eli Lilly and Company (Indianapolis, IN), cisplatin from Teva Parenteral Medicines, Inc., rapamycin and chloroquine disolphate salt from Sigma-Aldrich. Antibodies specific for phospho-AKT, AKT, cyclin D1, phospho-GSK-3β, GSK-3β, phospho-S6K1, S6K1, PTEN were purchased from Cell Signaling Technology, p27 and LC3 from BD Biosciences (Franklin Lakes, NJ), β-actin from Sigma-Aldrich.
The antibody used for LC3 punctae immunofluorescence was purchased from MBL international.
Detection of mutations by gene sequencing
A high-throughput approach was used by the MD Anderson Sequenome Core Facility to identify specific oncogene sequence-specific mutations on our panel of 12 bladder cancer cell lines (). Oligonucleotide primers (sequences available on request) for amplifying gene coding exons were designed to give a product size in the range of 200 to 700 bp with a minimum of 40 bp flanking the splice sites using the Exon Primer program, which is bundled with the University of California at Santa Cruz Genome Browser (build hg17). M13F and M13R tags were added to the forward and reverse primers, respectively. Five nanograms of genomic DNA from each cell line were amplified in an 8-L PCR using AmpliTaq Gold (Applied Biosystems) on PE 9700 machines and subsequently cleaned using a diluted version of the EXO-SAP-based PCR product pre-sequencing kit (USB Corp.) dispensed by a nanoliter dispenser (Deerac Fluidics Equator by Promega). All PCR set-up procedures were performed in a 384-well format using a Biomek FX workstation after optimization. Sequencing reactions were then performed using the M13 primers along with BigDye Terminator v3.1 Cycle Sequencing kit (Applied Biosystems) and cleaned with BET before separation on an ABI 3730xl DNA Analyzer. Base calling, quality assessment and assembly were performed using the Phred, Phrap, Polyphred, Consed software suite. All sequence variants identified were verified by manual inspection of the chromatograms. Mutation frequencies determined using this approach should be considered lower estimates as all exon sequences were not covered in all cases with perfect mutation capture. In contrast, the false-positive rate with this approach is low to nonexistent.Citation44
Table 2. Panel of activating oncogenic mutations assayed at the MD Anderson Sequenome Core Facility
Evaluation of cell proliferation by MTT reduction
The acute and chronic effects of AZ7328 were measured at 48 h (h) and 120 h. In the 48 h assays 3–4 × 10⁴ cells/well were plated in 96-well plates for 24 h in complete media with 10% FBS and then exposed to varying drug concentrations. After 48 h, cell proliferation was assessed by pulsing the cells for 2 h with dimethyl thiazolyl diphenyl tetrazolium salt (MTT) (5 mg/mL in PBS) followed by solubilization in 100 μL of DMSO. Long-term (120 h) assays were performed using a slightly modified version of a protocol published previously.Citation45 Briefly, 500 cells/well were plated in 96-well plates for 24 h in complete media with 10% FBS and then exposed to varying drug concentrations. After 48 h the medium was removed, replaced with fresh medium containing the same concentrations of drug and cells were incubated for an additional 72 h. Cell proliferation was then assessed by pulsing the cells for 4 h with MTT (5 mg/mL in PBS) and solubilizing the reduced dye in 100 μL of DMSO. Color development was quantified by measuring the optical densities (ODs) at 570 nm and subtracting the ODs obtained at 660 nm (backgrounds). Results shown are mean ± SEM and were repeated in triplicate.
Quantification of DNA synthesis by 3H-incorporation
6–8 × 10³ cells per well were plated in 96-well plates for 24 h in complete media with 10% FBS and then exposed to varying drug concentrations. After 24 h medium was removed and replaced with fresh cell culture medium containing 10% FBS and 10 μCi/mL [3H] thymidine (MP Biomedicals). The cells were pulsed with [3H] thymidine for two hours and the media was subsequently removed. Cells were then lysed by the addition of 0.1 mol/L KOH and harvested onto fiberglass filters using a cell harvester (Perkin Elmer/Wallac). The incorporated tritium was quantified in a 1450 MICROBETA Trilux liquid scintillation and luminescence counter (PerkinElmer Life Sciences). Results shown are mean ± SEM, n = 8.
Cell cycle analysis
9–12 × 104 cells were plated in 6-well plates for 24 h in complete media with 10% FBS and then exposed to varying drug concentrations. After 24 h the cells were trypsinized and pelleted by centrifugation. The cells were re-suspended in PBS containing 50 μg/mL propidium iodide (PI), 0.1% Triton X-100 and 0.1% sodium citrate. PI fluorescence was measured by fluorescence-activated cell sorting analysis (FACS) (FL-3 channel, Becton Dickinson, Mountain View, CA). Cells displaying a hypodiploid content of DNA, indicative of DNA fragmentation, were considered apoptotic. All conditions were replicated in triplicate.
Western blot analysis
Cells were plated at approximately 70–80% confluency on 10 cm dishes and exposed to AZ7328 for the times indicated. The cells were harvested and disrupted on ice in lysis buffer [50 mmol/L TRIS-HCl (pH 7.4), 150 mmol/L NaCl, 5 mmol/L EDTA, 25 mmol/L NaF, 1% NP40, 0.1% Triton-X100, 0.1 mmol/L Na3V04, 12.5 mmol/L β-Glycerophosphate, 1 mmol/L PMSF, complete protease inhibitor cocktail (Roche)]. Protein concentrations were determined using the Bio-Rad Bradford protein assay reagent (Bio-Rad Laboratories). Approximately 50–60 μg of each protein sample was boiled for five minutes and separated by 15% SDS PAGE at 150 mV in electrophoresis buffer [25 mmol/L TRIS-HCl (pH 8.3), 192 mmol/L glycine, 0.1% SDS]. Proteins in the gels were electrophoretically transferred onto nitrocellulose membranes in transfer buffer (25 mmol/L TRIS-HCl, 192 mmol/L glycine, 20% methanol) for 16 h at 40 mV and 4°C. The membranes were washed in PBS with 0.1% Tween 20 (PBS-T), blocked in 5% nonfat dry milk for 30 min at room temperature with shaking and then rinsed with PBS-T. The membranes were incubated with primary antibodies diluted 1:1000 in PBS-T containing 5% milk overnight, followed, after further washing, by incubation for one hour at room temperature in horseradish peroxidase-linked secondary antibody (Santa Cruz Biotechnology) diluted in PBS-T containing 5% milk (anti-rabbit 1:3000, anti-mouse 1:5000). The probed proteins were detected using the enhanced chemiluminescence system (GE Healthcare/Amersham Biosciences, Piscataway, NJ) according to the manufacturer’s instructions.
Analysis of autophagy by anti-LC3 immunofluorescence
Twenty thousand cells were seeded in 8-well chamber slides (Becton, Dickinson and Company) for 24 h in complete medium with 10% FBS and then exposed to various drug concentrations. After 24 h, the medium was removed and the cells were washed with PBS, fixed in 4% paraformaldehyde diluted in PBS and permeabilized in 100 μg/ml of digitonin diluted in PBS. The cells were then blocked in a solution of 5% horse serum and 1% goat serum diluted in PBS followed by overnight incubation at 4°C with mouse antibody against LC-3 (MBL International) diluted 1:300 in blocking buffer. After 24 h, the cells were washed in PBS and incubated for 1 h with anti-mouse antibody DyLight 549 (Jackson ImmunoResearch Laboratories, Inc.) diluted 1:1000 in blocking buffer. After PBS washing the cells were counterstained with Sytox Green (Life technologies, Grand Island, NY) diluted 1:10,000 in PBS. The cells were then observed under a fluorescence microscope (ZEISS Axioplan2, Carl Zeiss Microscopy, LLC). Pictures were taken for each condition using an ORCA-ER Hamamatsu camera (Hamamatsu Photonics, K.K.) and Image-Pro Plus 5.1 imaging software (Media Cybernetics, Inc.).
Additional material
Download Zip (30.7 KB)Disclosure of Potential Conflicts of Interest
No potential conflicts of interest were disclosed.
Acknowledgments
We would like to thank Goodwin Jinesh G, Aditi Das, Eswaran Devarajan, I-ling Lee, Neema Navai and Eugene K Lee for providing technical support. We also thank Katherine Stemke Hale and Michael Davies for help with the gene sequencing analyses. STR DNA fingerprinting was done by the Cancer Center Support grant funded Characterized Cell Line core, NCI # CA16672.
This research was supported by the MD Anderson Genitourinary SPORE Grant (P50 CA091846), a sponsored research agreement from AstraZeneca and MD Anderson’s Cancer Center Support Grant (P30 CA016672).
Supplemental Materials
Supplemental material may be found here:
http://www.landesbioscience.com/journals/cbt/article/21793/
References
- Jemal A, Siegel R, Xu J, Ward E. Cancer statistics, 2010. CA Cancer J Clin 2010; 60:277 - 300; http://dx.doi.org/10.3322/caac.20073; PMID: 20610543
- Wong K-K, Engelman JA, Cantley LC. Targeting the PI3K signaling pathway in cancer. Curr Opin Genet Dev 2010; 20:87 - 90; http://dx.doi.org/10.1016/j.gde.2009.11.002; PMID: 20006486
- Madrid LV, Mayo MW, Reuther JY, Baldwin AS Jr.. Akt stimulates the transactivation potential of the RelA/p65 Subunit of NF-kappa B through utilization of the Ikappa B kinase and activation of the mitogen-activated protein kinase p38. J Biol Chem 2001; 276:18934 - 40; http://dx.doi.org/10.1074/jbc.M101103200; PMID: 11259436
- Sizemore N, Leung S, Stark GR. Activation of phosphatidylinositol 3-kinase in response to interleukin-1 leads to phosphorylation and activation of the NF-kappaB p65/RelA subunit. Mol Cell Biol 1999; 19:4798 - 805; PMID: 10373529
- Cappellen D, Gil Diez de Medina S, Chopin D, Thiery JP, Radvanyi F. Frequent loss of heterozygosity on chromosome 10q in muscle-invasive transitional cell carcinomas of the bladder. Oncogene 1997; 14:3059 - 66; http://dx.doi.org/10.1038/sj.onc.1201154; PMID: 9223669
- Cairns P, Evron E, Okami K, Halachmi N, Esteller M, Herman JG, et al. Point mutation and homozygous deletion of PTEN/MMAC1 in primary bladder cancers. Oncogene 1998; 16:3215 - 8; http://dx.doi.org/10.1038/sj.onc.1201855; PMID: 9671402
- Aveyard JS, Skilleter A, Habuchi T, Knowles MA. Somatic mutation of PTEN in bladder carcinoma. Br J Cancer 1999; 80:904 - 8; http://dx.doi.org/10.1038/sj.bjc.6690439; PMID: 10360673
- Vivanco I, Sawyers CL. The phosphatidylinositol 3-Kinase AKT pathway in human cancer. Nat Rev Cancer 2002; 2:489 - 501; http://dx.doi.org/10.1038/nrc839; PMID: 12094235
- Hynes NE, Lane HA. ERBB receptors and cancer: the complexity of targeted inhibitors. Nat Rev Cancer 2005; 5:341 - 54; http://dx.doi.org/10.1038/nrc1609; PMID: 15864276
- López-Knowles E, Hernández S, Malats N, Kogevinas M, Lloreta J, Carrato A, et al. PIK3CA mutations are an early genetic alteration associated with FGFR3 mutations in superficial papillary bladder tumors. Cancer Res 2006; 66:7401 - 4; http://dx.doi.org/10.1158/0008-5472.CAN-06-1182; PMID: 16885334
- Platt FM, Hurst CD, Taylor CF, Gregory WM, Harnden P, Knowles MA. Spectrum of phosphatidylinositol 3-kinase pathway gene alterations in bladder cancer. Clin Cancer Res 2009; 15:6008 - 17; http://dx.doi.org/10.1158/1078-0432.CCR-09-0898; PMID: 19789314
- Askham JM, Platt F, Chambers PA, Snowden H, Taylor CF, Knowles MA. AKT1 mutations in bladder cancer: identification of a novel oncogenic mutation that can co-operate with E17K. Oncogene 2010; 29:150 - 5; http://dx.doi.org/10.1038/onc.2009.315; PMID: 19802009
- Wu X-R. Biology of urothelial tumorigenesis: insights from genetically engineered mice. Cancer Metastasis Rev 2009; 28:281 - 90; http://dx.doi.org/10.1007/s10555-009-9189-4; PMID: 20012171
- Puzio-Kuter AM, Castillo-Martin M, Kinkade CW, Wang X, Shen TH, Matos T, et al. Inactivation of p53 and Pten promotes invasive bladder cancer. Genes Dev 2009; 23:675 - 80; http://dx.doi.org/10.1101/gad.1772909; PMID: 19261747
- Sharma SV, Haber DA, Settleman J. Cell line-based platforms to evaluate the therapeutic efficacy of candidate anticancer agents. Nat Rev Cancer 2010; 10:241 - 53; http://dx.doi.org/10.1038/nrc2820; PMID: 20300105
- Knowles MA, Platt FM, Ross RL, Hurst CD. Phosphatidylinositol 3-kinase (PI3K) pathway activation in bladder cancer. Cancer Metastasis Rev 2009; 28:305 - 16; http://dx.doi.org/10.1007/s10555-009-9198-3; PMID: 20013032
- Kassouf W, Dinney CPN, Brown G, McConkey DJ, Diehl AJ, Bar-Eli M, et al. Uncoupling between epidermal growth factor receptor and downstream signals defines resistance to the antiproliferative effect of Gefitinib in bladder cancer cells. Cancer Res 2005; 65:10524 - 35; http://dx.doi.org/10.1158/0008-5472.CAN-05-1536; PMID: 16288045
- Shrader M, Pino MS, Lashinger L, Bar-Eli M, Adam L, Dinney CPN, et al. Gefitinib reverses TRAIL resistance in human bladder cancer cell lines via inhibition of AKT-mediated X-linked inhibitor of apoptosis protein expression. Cancer Res 2007; 67:1430 - 5; http://dx.doi.org/10.1158/0008-5472.CAN-06-1224; PMID: 17308080
- Hay N, Sonenberg N. Upstream and downstream of mTOR. Genes Dev 2004; 18:1926 - 45; http://dx.doi.org/10.1101/gad.1212704; PMID: 15314020
- Cross DA, Alessi DR, Cohen P, Andjelkovich M, Hemmings BA. Inhibition of glycogen synthase kinase-3 by insulin mediated by protein kinase B. Nature 1995; 378:785 - 9; http://dx.doi.org/10.1038/378785a0; PMID: 8524413
- Diehl JA, Cheng M, Roussel MF, Sherr CJ. Glycogen synthase kinase-3beta regulates cyclin D1 proteolysis and subcellular localization. Genes Dev 1998; 12:3499 - 511; http://dx.doi.org/10.1101/gad.12.22.3499; PMID: 9832503
- Okuzumi T, Fiedler D, Zhang C, Gray DC, Aizenstein B, Hoffman R, et al. Inhibitor hijacking of Akt activation. Nat Chem Biol 2009; 5:484 - 93; http://dx.doi.org/10.1038/nchembio.183; PMID: 19465931
- Tsuruta H, Kishimoto H, Sasaki T, Horie Y, Natsui M, Shibata Y, et al. Hyperplasia and carcinomas in Pten-deficient mice and reduced PTEN protein in human bladder cancer patients. Cancer Res 2006; 66:8389 - 96; http://dx.doi.org/10.1158/0008-5472.CAN-05-4627; PMID: 16951148
- Seager CM, Puzio-Kuter AM, Patel T, Jain S, Cordon-Cardo C, Mc Kiernan J, et al. Intravesical delivery of rapamycin suppresses tumorigenesis in a mouse model of progressive bladder cancer. Cancer Prev Res (Phila) 2009; 2:1008 - 14; http://dx.doi.org/10.1158/1940-6207.CAPR-09-0169; PMID: 19952358
- Makhlin I, Zhang J, Long CJ, Devarajan K, Zhou Y, Klein-Szanto AJ, et al. The mTOR pathway affects proliferation and chemosensitivity of urothelial carcinoma cells and is upregulated in a subset of human bladder cancers. BJU Int 2010; PMID: 21050361
- Chiong E, Lee I-L, Dadbin A, Sabichi AL, Harris L, Urbauer D, et al. Effects of mTOR inhibitor everolimus (RAD001) on bladder cancer cells. Clin Cancer Res 2011; 17:2863 - 73; http://dx.doi.org/10.1158/1078-0432.CCR-09-3202; PMID: 21415218
- O’Reilly KE, Rojo F, She Q-B, Solit D, Mills GB, Smith D, et al. mTOR inhibition induces upstream receptor tyrosine kinase signaling and activates Akt. Cancer Res 2006; 66:1500 - 8; http://dx.doi.org/10.1158/0008-5472.CAN-05-2925; PMID: 16452206
- Garcia JA, Danielpour D. Mammalian target of rapamycin inhibition as a therapeutic strategy in the management of urologic malignancies. Mol Cancer Ther 2008; 7:1347 - 54; http://dx.doi.org/10.1158/1535-7163.MCT-07-2408; PMID: 18566209
- Laplante M, Sabatini DM. mTOR signaling in growth control and disease. Cell 2012; 149:274 - 93; http://dx.doi.org/10.1016/j.cell.2012.03.017; PMID: 22500797
- Lum JJ, DeBerardinis RJ, Thompson CB. Autophagy in metazoans: cell survival in the land of plenty. Nat Rev Mol Cell Biol 2005; 6:439 - 48; http://dx.doi.org/10.1038/nrm1660; PMID: 15928708
- Kundu M, Thompson CB. Autophagy: basic principles and relevance to disease. Annu Rev Pathol 2008; 3:427 - 55; http://dx.doi.org/10.1146/annurev.pathmechdis.2.010506.091842; PMID: 18039129
- Klionsky DJ, Abeliovich H, Agostinis P, Agrawal DK, Aliev G, Askew DS, et al. Guidelines for the use and interpretation of assays for monitoring autophagy in higher eukaryotes. Autophagy 2008; 4:151 - 75; PMID: 18188003
- Miled N, Yan Y, Hon W-C, Perisic O, Zvelebil M, Inbar Y, et al. Mechanism of two classes of cancer mutations in the phosphoinositide 3-kinase catalytic subunit. Science 2007; 317:239 - 42; http://dx.doi.org/10.1126/science.1135394; PMID: 17626883
- Kang S, Bader AG, Zhao L, Vogt PK. Mutated PI 3-kinases: cancer targets on a silver platter. Cell Cycle 2005; 4:578 - 81; http://dx.doi.org/10.4161/cc.4.4.1593; PMID: 15876869
- Samuels Y, Velculescu VE. Oncogenic mutations of PIK3CA in human cancers. Cell Cycle 2004; 3:1221 - 4; http://dx.doi.org/10.4161/cc.3.10.1164; PMID: 15467468
- McConkey DJ, Choi W, Marquis L, Martin F, Williams MB, Shah J, et al. Role of epithelial-to-mesenchymal transition (EMT) in drug sensitivity and metastasis in bladder cancer. Cancer Metastasis Rev 2009; 28:335 - 44; http://dx.doi.org/10.1007/s10555-009-9194-7; PMID: 20012924
- Adam L, Zhong M, Choi W, Qi W, Nicoloso M, Arora A, et al. miR-200 expression regulates epithelial-to-mesenchymal transition in bladder cancer cells and reverses resistance to epidermal growth factor receptor therapy. Clin Cancer Res 2009; 15:5060 - 72; http://dx.doi.org/10.1158/1078-0432.CCR-08-2245; PMID: 19671845
- van Slegtenhorst M, de Hoogt R, Hermans C, Nellist M, Janssen B, Verhoef S, et al. Identification of the tuberous sclerosis gene TSC1 on chromosome 9q34. Science 1997; 277:805 - 8; http://dx.doi.org/10.1126/science.277.5327.805; PMID: 9242607
- Consortium ECTS, European Chromosome 16 Tuberous Sclerosis Consortium. Identification and characterization of the tuberous sclerosis gene on chromosome 16. Cell 1993; 75:1305 - 15; http://dx.doi.org/10.1016/0092-8674(93)90618-Z; PMID: 8269512
- Tee AR, Manning BD, Roux PP, Cantley LC, Blenis J. Tuberous sclerosis complex gene products, Tuberin and Hamartin, control mTOR signaling by acting as a GTPase-activating protein complex toward Rheb. Curr Biol 2003; 13:1259 - 68; http://dx.doi.org/10.1016/S0960-9822(03)00506-2; PMID: 12906785
- Cairns P, Shaw ME, Knowles MA. Initiation of bladder cancer may involve deletion of a tumour-suppressor gene on chromosome 9. Oncogene 1993; 8:1083 - 5; PMID: 8096074
- Knowles MA, Habuchi T, Kennedy W, Cuthbert-Heavens D. Mutation spectrum of the 9q34 tuberous sclerosis gene TSC1 in transitional cell carcinoma of the bladder. Cancer Res 2003; 63:7652 - 6; PMID: 14633685
- Dinney CP, Fishbeck R, Singh RK, Eve B, Pathak S, Brown N, et al. Isolation and characterization of metastatic variants from human transitional cell carcinoma passaged by orthotopic implantation in athymic nude mice. J Urol 1995; 154:1532 - 8; http://dx.doi.org/10.1016/S0022-5347(01)66923-4; PMID: 7658585
- Stemke-Hale K, Gonzalez-Angulo AM, Lluch A, Neve RM, Kuo W-L, Davies M, et al. An integrative genomic and proteomic analysis of PIK3CA, PTEN and AKT mutations in breast cancer. Cancer Res 2008; 68:6084 - 91; http://dx.doi.org/10.1158/0008-5472.CAN-07-6854; PMID: 18676830
- Lamont FR, Tomlinson DC, Cooper PA, Shnyder SD, Chester JD, Knowles MA. Small molecule FGF receptor inhibitors block FGFR-dependent urothelial carcinoma growth in vitro and in vivo. Br J Cancer 2011; 104:75 - 82; http://dx.doi.org/10.1038/sj.bjc.6606016; PMID: 21119661