Abstract
Li-Fraumeni syndrome (LFS) is primarily characterized by development of tumors exhibiting germ-line mutations in the p53 gene. Cell lines developed from patients of a LFS family have decreased p53 activity as evidenced by the absence of apoptosis upon etoposide treatment. To test our hypothesis that changes in gene expression beyond p53 per se are contributing to the development of tumors, we compared gene expression in non-cancerous skin fibroblasts of LFS-affected (p53 heterozygous) vs. non-affected (p53 wild-type homozygous) family members. Expression analysis showed that several genes were differentially regulated in the p53 homozygous and heterozygous cell lines. We were particularly intrigued by the decreased expression (~88%) of a putative tumor-suppressor protein, caveolin-1 (Cav-1), in the p53-mutant cells. Decreased expression of Cav-1 was also seen in both p53-knockout and p21-knockout HTC116 cells suggesting that p53 controls Cav-1 expression through p21 and leading to the speculation that p53, Cav-1 and p21 may be part of a positive auto-regulatory feedback loop. The direct relationship between p53 and Cav-1 was also tested with HeLa cells (containing inactive p53), which expressed a significantly lower Cav-1 protein. A panel of nonfunctional and p53-deficient colon and epithelial breast cancer cell lines showed undetectable expression of Cav-1 supporting the role of p53 in the control of Cav-1. However, in two aggressively metastasizing breast cancer cell lines, Cav-1 was strongly expressed suggesting a possible role in tumor metastasis. Thus, there is a divergent control of Cav-1 expression as evidenced in non-cancerous Li-Fraumeni syndrome and some aggressive human cancer cell lines.
Introduction
An excellent model of a natural biological system in which to study carcinogenesis in humans is the Li-Fraumeni syndrome (LFS), which is characterized by the early onset of a broad spectrum of malignancies. Most LFS patients are carriers of a mutated form of p53. In the family studied here, for instance, affected individuals are heterozygous for the p53 mutation (from glycine to aspartic acid) that results in the expression of a dominant negative form of p53 making all the patients’ cells p53 deficient. Even so, affected individuals appear normal except for the development of cancer in multiple organs at an early age (see ). The p53 gene encodes a tumor-suppressor protein that functions as a guardian of the genome by controlling cell proliferation through cell cycle arrest and apoptosis. Its functions are mediated by a number of effecter molecules such as p21, PCNA, GADD45 and Bax that, in turn, control a whole host of proteins involved in cell growth and death.Citation1 These genes also feedback on p53 itself forming at least 10 homeostatic control loops.Citation2 Interestingly, three of these control mechanisms, involving PTEN-AKT, p14/19 ARF and Rb, are positive feedback loops whose function is presumably to amplify the p53 response.
Table 1. Status of p53 in cancer-prone LFS family
The p53 pathway has been analyzed by mapping the changes in gene expression following activation of p53 or by studying cells that either overexpress or lack p53 (for instance see ref. Citation3). We decided to use LFS cells for our analysis of gene expression. Such cells are unique in that the p53 mutation is germ-line and thus affected individuals have adapted somewhat to the decreased p53 activity as evidenced by their apparently normal growth and development. Such cells provide insight not only into the network of proteins regulated by p53 but also into the mechanisms that make these individuals prone to tumor development. In our current study, we utilized a combined microarray and Western array procedures in an attempt to map this network of genes. We compared gene expression and protein levels in siblings from an LFS family; one was an affected individual (p53 heterozygous) the other was unaffected (homozygous wild-type p53). A number of genes and proteins involved in cell growth, cancer or apoptosis were differentially regulated in these cells. Among these was caveolin-1 (Cav-1), a 22–24 kDa, 178 amino acid-containing integral membrane protein of caveolae, which was dramatically downregulated in the p53-deficient cells. Cav-1, a scaffolding protein that interacts with trimeric G-proteins and other signaling molecules, has been implicated as a possible tumor suppressor. At the molecular level, through its 20 amino acid region named caveolin-scaffolding domain, Cav-1 functions as an all-around inhibitor of kinases and other mitogenic signaling pathways including ERK-1/2, p42/44-MAP kinase, Smad-2/3 and Stat5a hyper-activation. Cav-1 also initiates cell cycle arrest at the G0/G1 transition phase. At the cellular level, recent studies have implicated a reduction or loss of Cav-1 expression in human carcinogenesis. It has been shown that sporadic dominant-negative Cav-1 mutations occur at high frequency in human breast cancers and in vivo studies of Cav-1 (−/−) mice result in mammary epithelial cell hyperplasia and increased predisposition to mammary tumorigenesis (see ref. Citation4 for extensive review).
Cav-1’s putative tumor-suppressor activity is primarily due to its contribution to cell cycle control and anti-proliferation event in certain cell types (see refs. Citation5 and Citation6 for reviews) and has been shown to induce cell cycle arrest through the action of p53 and p21.Citation7 We show that Cav-1 expression is dependent on p53 and p21 in a seeming contradiction of the prior data. We speculate that p53 and p21 upregulate Cav-1 which, in turn, upregulates p53 in a positive feedback loop whose function is to presumably amplify the p53 pathway.
Results
Differential gene expression and protein expression in LFS cells with or without a germline p53 dominant-negative mutation
To investigate the possibility that changes in gene expression and protein expression other than p53 may contribute to the propensity to form tumors in LFS, we examined both gene expression and protein expression levels in normal fibroblasts from two LFS siblings by conducting a combined microarray and Western array procedures. One cell line, 2673, is heterozygous for a dominant-negative form of p53. The other cell line, 2852 contains two copies of the wild-type p53. Differential gene expression profiles of the two individuals were obtained using custom-built genome-wide microarray chips with over 31,000 human genes. Duplicate RNA samples of each cell line were analyzed for differentially expressed transcripts. The analysis revealed the presence of well over 300 differentially expressed genes including several hypothetical genes and expressed sequence tags. The list includes those genes exhibiting a three- or more-fold difference in gene expression that have known roles in cancer, cell cycle control or cell death (see ). Genes that were upregulated by at least 3-fold in the p53-deficient cell line 2673 were those enhancing cell proliferation (e.g., ANXA1, BAD, BAG1, CDH2, CRK, CTSL, DIABLO, DNMI, GSK3B, etc.), cell cycle progression (e.g, PDGF, MAPK8, MGMT, etc.) and cell death inhibition (e.g., NOS3, NSF, PIK3R1, RAF1, RASA1, etc.). Similarly, the protein array procedure in the LFS cell line 2673 revealed the differentially downregulated (i.e., above 3-fold difference) proteins that are prominent in tumor suppression, cell cycle arrest and cell death such as MMP1, SOD2 and TGF-β2 (see ). Apparently, there is a higher level of protein expression related to cancer, cell cycle, cell death and cell signaling in the p53 heterozygous mutant cell line, 2673 than there is in the p53 wild-type homozygous cell line, 2852. Furthermore, there was a greater than 60% decrease in the expression of NME3, EDN1 and TNFRSF11B proteins in the p53 mutant 2673 (). Among these drastically reduced proteins was caveolin-1 (Cav-1), a 22-kDa, 178 amino acid-containing integral membrane protein of caveolae, which showed the greatest decrease (~88%) in expression levels in p53-deficient cells of 2673. Interestingly, we had independently detected a decrease in Cav-1 gene expression in a prior differential display analysis of gene expression in these cells (unpublished). We therefore examined this protein in some detail.
Table 2. cDNA microarray analysis of differentially expressed genes*
Table 3. Protein array analysis of differentially expressed proteins*
p53-dependent expression of Cav-1 and its magnitude
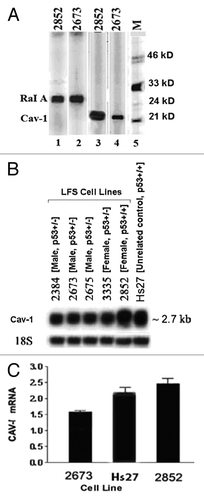
Since we had previously detected drastic changes in Cav-1 expression between p53 wild-type and p53 mutant LFS cell lines, we decided to focus on Cav-1 protein expression. To further assess the differential expression of Cav-1 protein (22 kD) between p53-wild-type, 2852 and p53-mutant, 2673, immunoblots were made using as a positive control protein, RaI A, a 24 kDa low-molecular weight GTP-binding protein belonging to the Ras superfamily of GTP-binding proteins. This protein is expressed at similar levels between the two cell lines (see lanes 1 and 2 in ). As , lane 4 shows, the Cav-1 protein expression in the p53-deficient cell line, 2673, was dramatically lower than in wild-type p53-containing 2852 cell line (lane 3), suggesting a possible dependence of Cav-1 expression in the presence of a functional p53 protein or a possible link between the two proteins in a biochemical pathway. If this phenomenon was true and if Cav-1 expression is truly dependent on p53 activity, then one would predict that all members of the LFS family under study that have the dominant-negative p53 mutation would show reduced expression of Cav-1. This was tested using northern blotting analysis of RNA isolated from normal skin fibroblasts from five members of this family (). There was a modest reduction of (about 30–58%) in Cav-1 mRNA expression in the p53 mutant LFS family member 2673 when compared with unrelated wild-type control from fibroblast cell line, Hs27, and the wild-type p53-containing LFS cell line 2852, thus agreeing with the previous microarray results for 2673 (). Furthermore, in the p53 mutant LFS family cell lines 2384, 2675 and 3335, the Cav-1 mRNA expression appears to be similar to 2673 but lower and uniformly decreased when compared with 2852 as shown on the northern blot in . This was confirmed by a densitometric analysis of northern blots of the Cav-1 mRNA bands, which reflected a downward expression in 2673 when compared with 2852 cell lines indicating that the Cav-1 mRNA expression in the p53-mutant 2673 cell line was about 58% (3,500–6,000 arbitrary units) of the expression observed in the 2852 cell line carrying the wild-type p53 (data not shown). This means the Cav-1 mRNA reduction in 2673 was about 42% from that of 2852. Moreover, this finding was validated further by a similar decrease in Cav-1 mRNA expression in 2673 (p53-mutant) cell line when compared with 2852 using quantitative PCR (). The Q-PCR assay depicts a similar decrease (about 41%) in Cav-1 mRNA expression level (1.6 in 2673 vs. 2.7 in 2852 cells). Based on the quantitative data shown, Cav-1 mRNA level between the two cell lines is similar in . On the protein side, compared with 2852 level, the approximately 3-fold decline in Cav-1 expression level in the 2673 cell line (see ) is steeper than the decrease in the corresponding mRNA level. From the mRNA and protein blots, it was possible to see that the Cav-1 gene expression was less dependent on p53 activity than the Cav-1 protein suggesting that p53 affects Cav-1 mRNA and protein levels independently. Taken together, the data strongly suggest that p53 differentially regulates expression of Cav-1 mRNA and Cav-1 protein, although there is a more drastic reduction of Cav-1 at the protein level.
Figure 1. Cav-1 differential expression. (A) Immunoblots from a protein array analysis showing the differential protein expression of Cav-1 (21 kD) in the LFS cell line 2673 (p53 deficient) and 2852 (wt p53). M denotes the positions of molecular mass markers. RaI A was used as a control for a protein that is expressed at similar levels between the two cell lines. (B) Northern blot analysis of Cav-1 differential mRNA expression in normal skin fibroblast cell lines of various LFS family members. Total RNAs (10 μg) were separated in a 1% agarose gel, transferred to nylon membrane and hybridized to a differentially expressed Cav-1 32P-labeled cDNA (50% formamide. 0.15 Denhardt's solution, 5x SSC, 0.01M Tris pH 7.5), 0.25 mg/ml salmon sperm DNA, 10% dextran sulfate for 20 h. at 42 C. Blots were washed and then autographed at -70°C. 18S RNA was used as loading control. (C) Quantitation of Cav-1 mRNA by quantitative PCR. Quantitative PCR (Q-PCR) was performed with the SYBR® Green PCR Core Reagents Kit (see Materials and Methods section). a-actin was used as a control. Each sample is represented as the average of three cell cultures. There was a significant difference in the expression of Cav-1 mRNA between 2852 and 2673 cells (p < 0.01).
Cav-1 expression in p53 and p21 knockouts
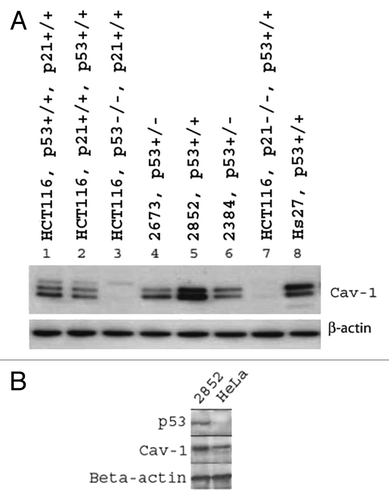
To further understand the relationship between Cav-1 and p53 at the protein level, a p53-knockout cell line, established from the human colon cancer cell line HTC116, was examined. Western analysis of the two experimental cells showed that loss of p53 may lead to a dramatic loss of Cav-1 protein expression. Our initial hypothesis was that p53 regulates Cav-1 directly and so we used a p21-knockout cell line as a control. p21 lies downstream of p53 and we expected that loss of p21 would have little effect on Cav-1 expression. Much to our surprise, loss of p21 expression showed an undetectable level of Cav-1 expression () suggesting that both functional p53 and p21 may be required for wild-type expression of Cav-1. This unexpected result raises the possibility that p53 controls Cav-1 expression through p21. That is, Cav-1 is downstream of p21, which is downstream of p53. The almost complete loss of Cav-1 expression in the p53- and p21-knockout cells is in contrast to somewhat reduced expression observed in the LFS cell lines perhaps indicates that the LFS cell lines retain some p53 activity. To consider the possibility that a p53-knockout may affect a number of downstream genes that may alter Cav-1 expression, we conducted an experiment in which HeLa cells, which have an inactive p53 protein, were employed to assess the expression of Cav-1. An immunoblotting experiment that compared Cav-1 protein expression between HeLa cells and an active p53-containing LFS cell line, 2852, confirmed that Cav-1 expression is significantly lower in HeLa cells suggesting a direct relationship between p53 and Cav-1 ().
Figure 2. Immunoblot analysis of Cav-1 protein expression in p53-knockout HTC116 cell lines and in HeLa cell lines. (A) Differential expression of Cav-1 in p53- and p21-knockout HTC116 and LFS cell lines. Hs27 is an unrelated control human fibroblast cell line. (+/−) designations are for p53 and p21 genotypes present in the cell lines. (B) Comparative expression of Cav-1 in HeLa and LFS 2852 cell lines.
Cav-1 expression during p53 upregulation
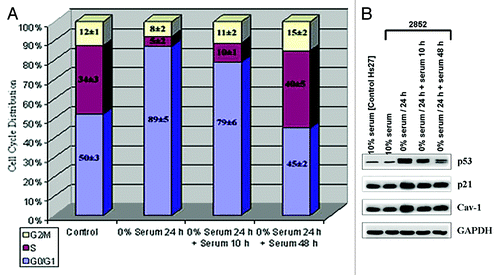
Our results have shown that lack of p53 or p21 activity may lead to loss of Cav-1 expression. We next checked to see if the increased expression of p53 in cells results in increased expression of Cav-1. To do this we serum-starved the wild-type 2852 cells reasoning that serum starvation would result in p53 activation and then measured p53 and p21 levels (). Fluorescent-activated cell sorting (FACS) analysis confirmed the arresting of cells at the G1/S transition after 24 h of serum starvation. As the figure shows, 48 h following re-feeding of the cells, normal cell cycle was restored. Similarly, Western analysis of p53 and p21 levels in these cells showed that both p53 and p21 were induced by starvation as expected (). Moreover, the elevated Cav-1 expression in starvation mirrored that of p21, suggesting that the two may be linked. On the other hand, following 10 h of re-feeding, the p53 levels decreased more than the p21 and Cav-1 protein levels. The quantitative gene expression data for was also constructed using histograms (not shown) through densitometry to show the relative intensity of the bands as a function of gene expression. It is evident that p53 is activated after 24 h of serum starvation rising to 151% from the basal serum level of 29% when both are compared with the expression of the housekeeping gene GAPDH. At the same time, the p21 and Cav-1 protein expression levels rose significantly from about 106% basal serum level to 180% during starvation. The expression of all three proteins leveled off after 10 h of serum restoration and 48 h following serum addition, although more drastically with p53 than p21 or Cav-1, whose expression most closely followed the pattern of p21. Furthermore, we performed a longer serum restoration assay (for 67 h, data not shown) following a 24 h serum starvation condition. Almost 3 d after serum restoration, the expression levels of p53 as well as the p21 and Cav-1 proteins seem to hold steady. This suggests that serum deprivation does affect the activation of p53 and subsequent expression of p21 and Cav-1 albeit to varying degrees. Thus, there is a correlation between increased expression of p53 and p21 with Cav1 expression, which most closely matched the p21 levels. This supports the hypothesis that p53 controls Cav-1 levels through p21.
Figure 3. Cav-1 is expression in serum-starved cells. (A) 2852 (wild type p53) cells were serum-starved for 24 h and then fresh serum was added for 10, 48 or 67 h. Cells were analyzed by standard FACS using Becton Dickinson (BD) FACSAria (BD Biosciences). The cell cycle analysis represents the average of three independent experiments. (B) Immunoblot analysis of p53, p21 and Cav-1 expression in serum-starved 2852 cells from (A). Cells were harvested after 24 h of serum starvation followed by restoration of serum for 10, 48 and 67 h. Cell lysates were subjected to SDS-PAGE and western blot analysis using monoclonal antibodies specific to p53, p21 or Cav-1. GAPDH was used as a loading control.
Cav-1 expression and apoptosis
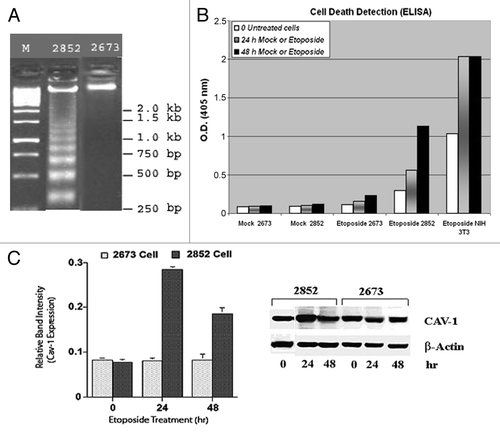
To determine whether Cav-1 expression is induced during p53-dependent apoptosis in LFS cells similar to serum starvation, we treated both 2852 (wild-type p53) and 2673 (p53 mutant) cells with etoposide, a topoisomerase inhibitor that induces breaks in single- and double-stranded DNA and derails cells in the G1 phase of the cell cycle.Citation8 Apoptosis in the two LFS cell lines was identified by standard DNA fragmentation electrophoresis (). The two LFS siblings exhibited differential time-dependent susceptibilities to etoposide as shown in . As expected, the p53 wild-type 2852 cells were very sensitive to etoposide, with significant apoptosis occurring within 24 h of treatment and a significantly larger one at 48 h. This apoptosis result is also a verification of the presence of an active p53 protein in cell line 2852. The 2673 cells, however, when compared with 2852 cells, had a very weak response to etoposide with apoptosis only slightly above basal levels after 24 h of etoposide treatment (). When Cav-1 expression was measured by western blotting of these etoposide-treated cells concomitantly during this time interval (i.e., 24 and 48 h) following apoptosis treatment, there was an elevated Cav-1 expression in the 2852 cell line but not in 2673 (, right panel). This differential susceptibility was also seen earlier when the cells were analyzed by FACS where within 24 h, 2852 cells had begun to accumulate in G1, whereas the 2673 cells showed no significant effects on cell cycle arrest even after 48 h (). Thus Cav-1 is induced in cells undergoing p53-dependent apoptosis and not in a matched cell line that expresses little p53 activity due to a p53 dominant-negative mutation. A column bar graph representing the relative Cav-1 protein levels (average of three repeats) was determined by densitometric analysis of the immunoblot normalized to the signal of β-actin (, left panel).
Figure 4. Cav-1 is expression in etoposide-treated cells. (A) Etoposide-induced fragmentation of DNA in LFS cell line 2852 but not in 2673. Cells were treated with 150 µM etoposide for up to 48 h and run on 0.5% agarose gel electrophoresis. (B) Apoptosis was measured using a Cell Death Detection ELISA Kit (Roche Diagnostics Corp.), which is a photometric enzyme-immunoassay for quantitation of histone-associated DNA. A representative experiment of three independent replicates is shown. NIH 3T3 fibroblasts were used as a positive control. Mock refers to the use of saline solution in place of etoposide. (C) Etoposide upregulates Cav-1 expression in 2852 and not in 2673. The expression of Cav-1 was monitored by western blotting with a specific mAb directed against Cav-1 in 2852 and 2673 fibroblast cell lines at the indicated times after etoposide treatment. Left panel: A column bar graph representing the relative Cav-1 protein levels (average of three repeats) as determined by densitometric analysis of the immunoblot normalized to the signal of β-actin (right panel).
Cav-1 expression in a panel of tumor cell lines
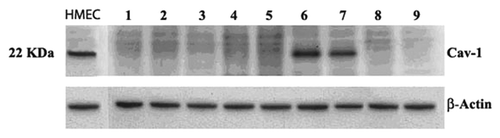
The levels of Cav-1 and p53 expression correlated well with each other in our analyses of the LFS cell lines. Many cancer cell lines have decreased p53 activity and we therefore assayed a panel of breast carcinoma epithelial cells and colon cancer cell lines to determine whether the correlation holds true in these cell lines as well. For the analysis, we used a colon cancer cell line and a mixture of breast cancer cell lines of varying degrees of tumorigenesis, ranging from moderately aggressive to strongly aggressive. As the western blot analysis in clearly shows, unlike most of the p53-negative cell lines, which lack Cav-1 expression, the aggressively metastasizing cancer cell lines MDA-MB-157 and MDA-MB-231 have strong expression. Both cell lines are deficient in p53; MDA-MB-157 is null for the p53 gene and MDA-MB-231 contains a very weak mutant form of p53. The breast cancer cell lines in that lack Cav-1 protein expression in this study are not all p53-deficient as evidenced by the two p53-positive breast cancer cell lines, MCF-7 and ZR75–1, which also do not express Cav-1. Breast cancer subtypes identified in have different underlying genetic defects besides their p53 status. Taken together, our data indicate that in non-cancerous cells from skin fibroblasts, Cav-1 expression is tightly linked to p53/p21 activity suggesting a role in the tumor-suppressor activity of p53 and Cav-1, whereas in some cancer cells with aggressive metastatic potential, expression of Cav-1 is disassociated from p53/p21 control resulting in high expression that is presumably beneficial for cell growth and survival.
Figure 5. Cav-1 expression in human cancer cell lines. Cav-1 expression was determined using western analysis (Materials and Methods). A normal human mammary epithelial cell line (wild-type p53) was used as a positive control (HMEC). Lane 1, ZR-75–1 (breast tumor, ER+), wtp53; lane 2, BT-20 (breast carcinoma, ER+-); lane 3, T47D (breast carcinoma-ductal, ER+), mtp53; lane 4, MCF-7 (breast carcinoma-ductal, ER+), wtp53; lane 5, SKBr3 (breast adenocarcinoma, ER- / HER-2 2+), mtp53; lane 6, MDA-MB-157 (breast carcinoma, ER-), mtp53; lane 7, MDA-MB-231 (adenocarcinoma, ER-), mtp53; lane 8, BT474 (breast carcinoma, ER+), mtp53; lane 9, Caco-2 (colon adenocarcinoma, ER+), p53-null. The p53 status of each cell is as indicated.
Discussion
We have demonstrated in this paper the presence of a positive correlation between wild-type p53 and Cav-1 expression using normal (non-cancerous) skin fibroblasts from Li-Fraumeni syndrome patients expressing a germ-line dominant-negative form of p53 and an unaffected sibling .We demonstrated that p53 apoptotic activity is indeed decreased in these p53 mutant cells and that this correlates with a loss of Cav-1 expression. Conversely, we showed that p53 and Cav-1 protein levels increase in cells from non-affected (wild-type p53) individuals in response to activators of p53 activity, such as serum starvation and etoposide-induced apoptosis. The link between p53 and Cav-1 expression was further investigated using p53- and p21-knockout cells. In both cases, Cav-1 expression was virtually eliminated. We do not know from these data whether the effects of p21 and p53 on Cav-1 are independent of one another. However, it is generally accepted that p21 (i.e., WAF-1) is a downstream effector of p53 so that the simplest explanation is that p53 activates p21 and that in turn induces Cav-1. This was further enhanced by the results derived from HeLa cells, which harbor an inactive p53 gene product and therefore were shown not to express the normal level of Cav-1 protein when compared with LFS cells with an active wt (wild-type) p53 protein (see ). It is assumed that both HeLa and LFS 2852 cell lines contain active wtp21. An alternative explanation for the increased expression of Cav-1 in the presence of p53 and p21 and its reduced or compromised expression in their absence or partially inactive states could be that Cav-1 itself may be the activator of both p53 and p21. Bartholomew and colleaguesCitation9 report that oxidative stress-induced activation of the p53/p21 pathway is compromised in caveolin-1-null mouse embryonic fibroblasts leading to the suggestion that Cav-1 might act upon the tumor-suppressor p53 and/or the cell cycle checkpoint protein p21 to induce their expression directly or act upon their upstream inducers.
However, Bist et al.Citation10 have also presented evidence that p53 can directly control the Cav-1 promoter. They identified p53-binding sites in the Cav-1 promoter and they showed that p53 could stabilize an E2F/DP1 – Sp1 complex on the promoter. Another paper by Clark et al., on the other hand, reports that active Cav-1 upregulates p21 in MCF-7 cells and enhances Paclitaxel-mediated cytotoxicity in a p53-dependent manner.Citation11 These disparate data raise the possibility that p53 activates Cav-1 mRNA levels both through direct action on the Cav-1 promoter and by activating p21. We do not know the relative importance of these two pathways in the LFS cells although we saw the greatest effect at the protein level rather than the RNA level.
We have shown that both p53 and p21 are required for expression of Cav-1 using p53- and p21-knockout cell lines. If Cav-1 functions as an effector of p53 action, overexpression of Cav-1 might be expected to lead to cell cycle arrest. This is indeed the case in primary cultures of mouse embryonic fibroblasts where Cav-1 has been shown to induce cells to undergo cell cycle arrest.Citation7 We did not demonstrate such effects ourselves, but we did show that under conditions of cell cycle arrest, Cav-1 increases. We also showed that Cav-1 is induced during p53-mediated apoptosis with the agent etoposide. Taken together, these data suggest that Cav-1 is part of the pathway for growth arrest due to both starvation and p53-mediated apoptosis. Although these data can be interpreted by the linear unidirectional pathway, p53-, p21-, Cav-1-growth arrest, an alternative explanation is that Cav-1’s function is to amplify the p53 response. In support of this, the cell cycle arrest induced by Cav-1 requires both p53 and p21 activity suggesting that p53/p21 and Cav-1 are part of a positive autoregulatory loop in which they activate each others’ expression. Furthermore, one of the major functions of p53, the induction of cell cycle arrest at G0/G1 phase was shown to be mediated by Cav-1 overexpression operating through a p53/p21Cip1-dependent pathway.Citation7 Thus, we speculate that p53– > p21– > Cav-1→growth inhibition is a linear pathway that could be supplemented by a feedback loop.
We and others have shown that Cav-1’s upregulation in normal diploid cells is consistent with its role as a putative tumor suppressor. The preponderance of data suggests that Cav-1 has transformation suppressor properties both in vitro and in vivo.Citation4 Many reports have previously suggested that the caveolin-1 gene functions as a novel tumor suppressor. Citation7, Citation12–Citation14 In that respect, it seems to function in concert with p53 to suppress uncontrolled cell growth. In majority of the cells where p53 is compromised, Cav-1 expression is downregulated. In fact, we have shown in that Cav-1 expression was virtually undetectable in a panel of non-functional p53-containing and p5-mutant colon and epithelial breast cancer cell lines. However, Cav-1 expression is often but not always decreased in tumor cells.Citation15–Citation20 In this paper, we also showed that Cav-1 is overexpressed in two aggressively metastasizing breast cancer cell lines with compromised p53 whereas in two p53-positive breast cancer cell lines, MCF-7 and ZR75–1, Cav-1 was not expressed. However, the literature indicates that the p53 gene or protein does not always function normally in these cell lines.Citation21–Citation23 For example, the p53 present in MCF-7 cell lines is weak and usually unresponsive, whereas in ZR75–1 breast cancer cell line and in murine in vivo analysis, DNA-damaging drugs such as doxorubicin are unable to stabilize the p53 present, suggesting normal p53 activity is impaired.Citation24 The absence of Cav-1 expression in these non-metastatic but impaired p53-possesing breast cell lines may reflect much like the p53 heterozygous or p53-null cell lines (shown in ) that the induction of Cav-1 requires a functional wild-type homozygous p53 gene and that an absent or minimally expressed p53 may not be positively correlated with Cav-1 expression. On the other hand, in the highly invasive and metastatic breast cancer cell lines MDA-MB-157 and MDA-MB-231 with an absent or non-functional p53 gene, Cav-1 may have adapted a tumorigenic characteristic as a signal transducer. There is also an in vivo experimental data in athymic nude mice showing that MDM-MB-157 and MDA-MB-231 cell lines, both of which are estrogen receptor-negative, exhibit higher growth rates and metastasis potential than the non-tumorigenic cell lines depicted in .Citation24–Citation26 This is further supported by the high level of expression in MDM-MB-157 and MDA-MB-231 breast cancer cells of the growth factor-inducible immediate-early gene Cyr61, a heparin-binding protein that promotes endothelial cell adhesion, migration and neovascularization; whereas very low levels were expressed in the less tumorigenic MCF-7 and BT-20 breast cancer cells and barely detectable amounts were found in the normal breast cells.Citation27
It is becoming increasingly clear that Cav-1 is expressed at higher levels in advanced stages of human cancers such as prostate, oral and pancreatic cancers.Citation6,Citation28,Citation29 Very recently, it was reported that Cav-1 does function as a tumor promoter during prostate carcinogenesis, rather than as a tumor suppressor, using in vivo molecular genetic evidence.Citation6 There is evidence to support that in vivo studies involving colon cancer cells, an initial Cav-1 downregulation need not be an entirely irreversible process since cell survival on selection for increased metastatic potential positively associated with increased Cav-1 expression levels.Citation30 Other studies indicate that Cav-1 overexpression correlates with tumor progression markers in pancreatic ductal adenocarcinoma,Citation29 and in prostate cancer cells.Citation6,Citation20 However, the potential regulation of IGF-IR gene expression by Cav-1 was reported in another study whose results showed that MCF7/Cav-1 cells, expressing the Cav-1 gene in a stable manner, contain significantly higher levels of IGF-IR protein and mRNA than native MCF7 cells showing that the activity of the proximal IGF-IR promoter was higher in Cav-1-expressing MCF7 cells than in untransfected MCF7 cells.Citation31 A lot can be inferred from Cav-1 studies related to cancer.
The status of the overexpressed Cav-1 gene in tumor cells should be determined to rule out point mutation or promoter methylation, both of which could deregulate its growth-suppressor activities. Cav-1 could serve as a therapeutic agent in a much similar way as p53 to suppress the activation of growth-promoting and signal-enhancing proteins. This effect is also not specific to a particular cell type because Cav-1 may also serve as a “molecular switch” in different cell types such as epithelial and fibroblast cell lines. Furthermore, genetic evidence from the study of human breast cancer Cav-1 (+/−) mutations and Cav-1(–/–)-null mice lends a strong support to the idea that caveolin-1 normally functions as a regulator of signal transduction and a negative modulator of cell proliferation and mammary tumorigenesis.Citation4,Citation32 This is further evidence as to the divergent nature of Cav-1 function in molecular signaling pathways.
Our future focus will test the concept that Cav-1 could serve as a dual activator of tumor suppression and tumor promotion in a specific cell type. We will achieve that by overexpressing Cav-1 in both the wild-type and p53-mutant LFS cells in order to determine the effects on gene expression, apoptosis and cell cycle regulation to clearly map the relative position of the protein in the p53 pathway.
Conclusions
In summary, we demonstrated that under certain circumstances of gene deregulation, Cav-1 can shed its tumor-suppressive activity. Whether it can gain growth stimulatory (i.e., oncogenic) activity or is required for cell survival under the same circumstances is not clear. However, we speculate that the seemingly divergent and contradictory role of Cav-1 expression may be due to the dichotomous role that Cav-1 plays between promoting oncogenesis and suppressing tumorigenesis.
This dual role may not be unique to Cav-1. However, it is cell type-specific and, in cancer cells, may vary with stage of the disease.
Materials and Methods
Cell lines
This study was approved by the appropriate institutional review board (IRB) at Georgetown University for use of the human cell lines discussed here. Early passage LFS, normal (non-cancerous) human skin fibroblast cell lines 2852 containing wild-type p53, and 2384, 2673, 2675 and 3335 containing mutant p53 were obtained from Dr. Alice Goldstein (NCI Repository). Primary diploid human foreskin fibroblast cell line, Hs27; human mammary epithelial cell line, HMEC; human breast cancer cell lines BT-20, SKBr3, MCF7, T47D, ZR-75–1, BT474, MDA-MB-157 and MDA-MB-231 and colon cancer cells, CACO-2 were obtained from Georgetown University’s Lombardi Tissue Culture Shared Resources (TCSR) center. A HeLa cell line (CCL-2TM from ATTC) was obtained from a colleague at Howard University College of Medicine. Colon carcinoma cell lines HCT116 p53 knockout and HCT116 p21 knockout and their paired controls were the generous gift of Dr. Bert Vogelstein (Johns Hopkins University).Citation33 All LFS skin fibroblasts and primary foreskin fibroblasts were maintained in MEM (Earle’s salts and L-glutamine) with 10% FBS and 25 mM HEPES buffer. All breast and colon cell lines were maintained in McCoy’s 5A medium or IMEM with 1% non-essential amino acids and 10% FBS complete medium or in DMEM containing 10% fetal bovine serum. HeLa cells were maintained in Eagle’s Minimum Essential Medium with 10% FBS. All cells were maintained at 37°C and 5% CO2.
Quantitation of Cav-1
cDNA was synthesized from poly(A)+ RNA with Superscript reverse transcriptase (Invitrogen) according to the manufacturer’s instructions. A 1:100 stock of cDNA from cell lines was prepared for the amplification of actin and a direct cDNA (1:1) was used for the amplification of Cav-1. PCR reactions contained 0.2 mM dNTPs, 1.5 mM MgCl2, 0.25 µl Taq DNA polymerase, 1 µl cDNA and primers in 50 µl PCR buffer. Reactions were incubated at 94°C for 5 min followed by 30 (actin) or 45 (Cav-1) cycles of 94°C for 30 sec, 55°C for 30 sec and 72°C for 1 min. RT-PCR reactions were performed using the Cav-1 sequence-specific primers 5′ AACGTTCTCACTCGCTCTCTGCTCGCTGCG 3′ and 5′ GTACACTTGCTTCTCGCTCAGCAC 3′. The primers span the intron between the first and the second exons, and generated a PCR product of approximately 300 bp, which was used as a probe to obtain a full-length clone (2.7 kb) by screening a cDNA library prepared from NMECs (76N).Citation34 The cloned Cav-1 gene was used in northern blot analysis. a-actin was used as a control using a primer set that has been previously used in our lab.Citation35
Quantitative PCR (Q-PCR) was performed with the SYBR® Green PCR Core Reagents Kit using the Cav-1-specific primers 5′-ACATCTCTACACCGTTCCCAT-3′ and 5′-TGTGTGTCCCTTCTGGTTCTG-3′, and analyzed using an ABI Prism 7700 Sequence Detector System (Perkin-Elmer). a-actin was used as a control. Each sample is represented as the average of three cell cultures. There was a significant difference in the expression of Cav-1 mRNA in 2852 and 2673 cells (p < 0.01).
RT-PCR
cDNA was synthesized from poly(A)+ RNA with Superscript reverse transcriptase (Invitrogen) according to the manufacturer’s instructions. A 1:100 stock of cDNA from all three cell-lines was prepared for the amplification of actin and a direct cDNA (1:1) was used for the amplification of Cav-1. PCR reactions contained 0.2 mM dNTPs, 1.5 mM MgCl2, 0.25 µl Taq DNA polymerase, 1 µl cDNA and primers in 50 µl PCR buffer. Reactions were incubated at 94°C for 5 min followed by 30 (actin) or 45 (Cav-1) cycles of 94°C for 30 sec, 55°C for 30 sec and 72°C for 1 min.
Microarray analysis
Total RNA was isolated from cell lines 2852 and 2673 using RiboPure RNA Isolation kit (Ambion) and used to prepare first and second strand cDNAs. Biotinylated cRNA target was prepared from the DNA template and fragmented. All RNA samples were verified using an Agilent Bioanalyzer (Agilent Technologies). CodeLink Bioarrays were hybridized with 10 µg of cRNA target and stained with Cy5-streptavidin. Slides were scanned on an Axon GenePix 4000B scanner (Axon). Before any analysis, plots of the fold change vs. the average intensity were examined to look for abnormalities in single-array data according to instructions of the array provider (GenUs Biosystems). Samples were normalized using this intensity-dependent normalization using the S-PLUS function lowess.Citation36 Normalized fold changes (i.e., log ratio of 2673 to 2852) in gene expression were then used to further analyze and cluster the data from the two cell lines (for each cell line duplicate samples were processed). Data were analyzed with CodeLink and GeneSpring software packages (Amersham Biosciences) following the normalized distribution of genes to the median intensity of the array.
Western array analysis
Whole-cell lysates were prepared using boiling lysis buffer [10 mM Tris (pH 7.4), 1.0 mM sodium orthovanadate, 1.0% SDS] followed by sonication for 10 sec. The samples were shipped on dry ice to BD Biosciences/Transduction Laboratories. Specific protein expression was determined by PowerBlot analysis developed as a custom service by BD Biosciences/PharMingen. Details are given at their website.Citation1 Briefly, samples containing 500 µg of protein in 500 µl of sample buffer were loaded atop a 7.5–15% gradient SDS-polyacrylamide slab gel (16 × 16 × 0.1 cm) and run overnight at a constant current. The proteins were then transferred to Immobilon-P nylon membrane (Millipore) and a total of ~800 antibodies (identity of the antibodies is available online) were used for hybridization and analysis.Citation2 The washed blot was then hybridized with goat antimouse antibody conjugated with horseradish peroxidase and developed with a chemiluminescence system (SuperSignal West Pico, Pierce). Each of the samples was analyzed in duplicate.
Immunoblotting
Monolayers of cells were washed with PBS at room temperature and extracted on ice with 2.5 ml/75 cm2 flask of a lysis buffer, containing protease and phosphatase inhibitors (leupeptin, aprotinin, vanadate, phenylmethylsulfonyl fluoride) followed by centrifugation at 15,000 × g for 20 min at 4°C. For immunoblotting, the gel (20 µg protein/lane) was run overnight at a constant current. The proteins were transferred to Immobilon-P nylon membrane (Millipore), which was probed with anti-Cav-1 antibody. Blocking buffer was TBS-T (0.15 M NaCl, 0.1% Tween-20, 50 mM Tris, pH 8.0) with 3% BSA for the anti-caveoline-1 monoclonal antibody (BD Transduction Laboratories). Secondary antibody was goat antimouse immunoglobulin conjugated to horseradish peroxidase, and antibody binding was detected using ECL. Each of the samples was analyzed in duplicate blots. The protein concentration was determined with the Bio-Rad Protein Assay Kit.
Etoposide treatment of cells
Cells were treated with 150 µM etoposide for up to 48 h. Apoptosis was measured using a Cell Death Detection ELISA Kit (Roche Diagnostics Corp.), which is a photometric enzyme-immunoassay for quantitation of histone-associated DNA. A representative experiment of three independent replicates is shown. NIH 3T3 fibroblasts were used as a positive control. Mock refers to the use of saline solution in place of etoposide. The expression of Cav-1 was monitored by western blotting with a specific mAb directed against Cav-1 in 2852 and 2673 fibroblast cell lines at the indicated times after etoposide treatment. A column bar graph representing the relative Cav-1 protein levels (average of three repeats) was determined by densitometric analysis of the immunoblot normalized to the signal of β-actin.
Statistical analysis
In this study, data are expressed as the mean ± SD of at least two runs and were analyzed using Student's t-test. Correlation between variables was evaluated using the Pearson correlation coefficient test and the differences between groups were compared by student t or ANOVA tests when appropriate. P values less than 0.05 are considered significant. All statistical analyses were performed using GraphPad software (GraphPad Software, Inc.).
| Abbreviations: | ||
| Caveolin-1 | = | Cav-1 |
| Li-Fraumeni syndrome | = | LFS |
| normal (non-cancerous) skin fibroblasts | = | NSFs |
Author’s Contributions
Z.A.S. conceived of the study, wrote the manuscript and made substantial contributions to conception and design, or acquisition of data or analysis and interpretation of data and has been the principal driver in drafting the manuscript or revising it critically for important intellectual content; and has given final approval of the version to be published. Z.A.S. also performed most of the molecular genetic studies. A.S.S. performed the immunoassay studies and participated in idea generation. All authors read and approved the final manuscript.
Author’s Information
Z.A.S. and A.S.S. are active cancer researchers with medical backgrounds and are both associate professors in their respective universities. The breast cancer research has been supported by NCI and Susan Komen research grants.
Acknowledgments
The authors are grateful to Dr. Bert Volgiesten (Johns Hopkins University) for providing the colon cancer cell lines. This work has been supported by an NCI grant # 5K01CA087554–04 to ZAS; Susan G. Komen Breast Cancer Foundation grant # BCTR0504208 to A.S.S. Address reprint requests to Z.A.S.
Disclosure of Potential Conflicts of Interest
No potential conflicts of interest were disclosed.
References
- Vogelstein B, Lane D, Levine AJ. Surfing the p53 network. Nature 2000; 408:307 - 10; http://dx.doi.org/10.1038/35042675; PMID: 11099028
- Harris SL, Levine AJ. The p53 pathway: positive and negative feedback loops. Oncogene 2005; 24:2899 - 908; http://dx.doi.org/10.1038/sj.onc.1208615; PMID: 15838523
- Boiko AD, Porteous S, Razorenova OV, Krivokrysenko VI, Williams BR, Gudkov AV. A systematic search for downstream mediators of tumor suppressor function of p53 reveals a major role of BTG2 in suppression of Ras-induced transformation. Genes Dev 2006; 20:236 - 52; http://dx.doi.org/10.1101/gad.1372606; PMID: 16418486
- Sotgia F, Martinez-Outschoorn UE, Howell A, Pestell RG, Pavlides S, Lisanti MP. Caveolin-1 and cancer metabolism in the tumor microenvironment: markers, models, and mechanisms. Annu Rev Pathol 2012; 7:423 - 67; http://dx.doi.org/10.1146/annurev-pathol-011811-120856; PMID: 22077552
- Cohen AW, Hnasko R, Schubert W, Lisanti MP. Role of caveolae and caveolins in health and disease. Physiol Rev 2004; 84:1341 - 79; http://dx.doi.org/10.1152/physrev.00046.2003; PMID: 15383654
- Williams TM, Hassan GS, Li J, Cohen AW, Medina F, Frank PG, et al. Caveolin-1 promotes tumor progression in an autochthonous mouse model of prostate cancer: genetic ablation of Cav-1 delays advanced prostate tumor development in tramp mice. J Biol Chem 2005; 280:25134 - 45; http://dx.doi.org/10.1074/jbc.M501186200; PMID: 15802273
- Galbiati F, Volonté D, Liu J, Capozza F, Frank PG, Zhu L, et al. Caveolin-1 expression negatively regulates cell cycle progression by inducing G(0)/G(1) arrest via a p53/p21(WAF1/Cip1)-dependent mechanism. Mol Biol Cell 2001; 12:2229 - 44; PMID: 11514613
- Palo AK, Sahu P, Choudhury RC. Etoposide-induced cytogenotoxicity in mouse spermatogonia and its potential transmission. J Appl Toxicol 2005; 25:94 - 100; http://dx.doi.org/10.1002/jat.1040; PMID: 15744785
- Bartholomew JN, Volonte D, Galbiati F. Caveolin-1 regulates the antagonistic pleiotropic properties of cellular senescence through a novel Mdm2/p53-mediated pathway. Cancer Res 2009; 69:2878 - 86; http://dx.doi.org/10.1158/0008-5472.CAN-08-2857; PMID: 19318577
- Bist A, Fielding CJ, Fielding PE. p53 regulates caveolin gene transcription, cell cholesterol, and growth by a novel mechanism. Biochemistry 2000; 39:1966 - 72; http://dx.doi.org/10.1021/bi991721h; PMID: 10684646
- Shajahan AN, Wang A, Decker M, Minshall RD, Liu MC, Clarke R. Caveolin-1 tyrosine phosphorylation enhances paclitaxel-mediated cytotoxicity. J Biol Chem 2007; 282:5934 - 43; http://dx.doi.org/10.1074/jbc.M608857200; PMID: 17190831
- Schlegel A, Schwab RB, Scherer PE, Lisanti MP. A role for the caveolin scaffolding domain in mediating the membrane attachment of caveolin-1. The caveolin scaffolding domain is both necessary and sufficient for membrane binding in vitro. J Biol Chem 1999; 274:22660 - 7; http://dx.doi.org/10.1074/jbc.274.32.22660; PMID: 10428847
- Sotgia F, Williams TM, Schubert W, Medina F, Minetti C, Pestell RG, et al. Caveolin-1 deficiency (-/-) conveys premalignant alterations in mammary epithelia, with abnormal lumen formation, growth factor independence, and cell invasiveness. Am J Pathol 2006; 168:292 - 309; http://dx.doi.org/10.2353/ajpath.2006.050429; PMID: 16400031
- Li J, Hassan GS, Williams TM, Minetti C, Pestell RG, Tanowitz HB, et al. Loss of caveolin-1 causes the hyper-proliferation of intestinal crypt stem cells, with increased sensitivity to whole body gamma-radiation. Cell Cycle 2005; 4:1817 - 25; http://dx.doi.org/10.4161/cc.4.12.2199; PMID: 16294037
- Razani B, Altschuler Y, Zhu L, Pestell RG, Mostov KE, Lisanti MP. Caveolin-1 expression is down-regulated in cells transformed by the human papilloma virus in a p53-dependent manner. Replacement of caveolin-1 expression suppresses HPV-mediated cell transformation. Biochemistry 2000; 39:13916 - 24; http://dx.doi.org/10.1021/bi001489b; PMID: 11076533
- Rajjayabun PH, Garg S, Durkan GC, Charlton R, Robinson MC, Mellon JK. Caveolin-1 expression is associated with high-grade bladder cancer. Urology 2001; 58:811 - 4; http://dx.doi.org/10.1016/S0090-4295(01)01337-1; PMID: 11711373
- Fong A, Garcia E, Gwynn L, Lisanti MP, Fazzari MJ, Li M. Expression of caveolin-1 and caveolin-2 in urothelial carcinoma of the urinary bladder correlates with tumor grade and squamous differentiation. Am J Clin Pathol 2003; 120:93 - 100; http://dx.doi.org/10.1309/292NHAYNWAVREJ37; PMID: 12866378
- Kato K, Hida Y, Miyamoto M, Hashida H, Shinohara T, Itoh T, et al. Overexpression of caveolin-1 in esophageal squamous cell carcinoma correlates with lymph node metastasis and pathologic stage. Cancer 2002; 94:929 - 33; http://dx.doi.org/10.1002/cncr.10329; PMID: 11920460
- Yang CP, Galbiati F, Volonte D, Horwitz SB, Lisanti MP. Upregulation of caveolin-1 and caveolae organelles in Taxol-resistant A549 cells. FEBS Lett 1998; 439:368 - 72; http://dx.doi.org/10.1016/S0014-5793(98)01354-4; PMID: 9845355
- Yang G, Truong LD, Wheeler TM, Thompson TC. Caveolin-1 expression in clinically confined human prostate cancer: a novel prognostic marker. Cancer Res 1999; 59:5719 - 23; PMID: 10582690
- Lapshina MA, Parkhomenko II, Terentiev AA. Two forms of the nuclear matrix-bound p53 protein in HEK293 cells. Ann N Y Acad Sci 2006; 1090:177 - 81; http://dx.doi.org/10.1196/annals.1378.019; PMID: 17384260
- Ravid D, Maor S, Werner H, Liscovitch M. Caveolin-1 inhibits anoikis and promotes survival signaling in cancer cells. Adv Enzyme Regul 2006; 46:163 - 75; http://dx.doi.org/10.1016/j.advenzreg.2006.01.022; PMID: 16857240
- Ravid D, Maor S, Werner H, Liscovitch M. Caveolin-1 inhibits cell detachment-induced p53 activation and anoikis by upregulation of insulin-like growth factor-I receptors and signaling. Oncogene 2005; 24:1338 - 47; http://dx.doi.org/10.1038/sj.onc.1208337; PMID: 15592498
- Wiebe JP, Lewis MJ. Activity and expression of progesterone metabolizing 5alpha-reductase, 20alpha-hydroxysteroid oxidoreductase and 3alpha(beta)-hydroxysteroid oxidoreductases in tumorigenic (MCF-7, MDA-MB-231, T-47D) and nontumorigenic (MCF-10A) human breast cancer cells. BMC Cancer 2003; 3:9; http://dx.doi.org/10.1186/1471-2407-3-9; PMID: 12659654
- Anderson WA, Perotti ME, McManaway M, Lindsey S, Eckberg WR. Similarities and differences in the ultrastructure of two hormone-dependent and one independent human breast carcinoma grown in athymic nude mice: comparison with the rat DMBA-induced tumor and normal secretory mammocytes. J Submicrosc Cytol 1984; 16:673 - 90; PMID: 6438351
- Soto AM, Murai JT, Siiteri PK, Sonnenschein C. Control of cell proliferation: evidence for negative control on estrogen-sensitive T47D human breast cancer cells. Cancer Res 1986; 46:2271 - 5; PMID: 3697972
- Xie D, Miller CW, O’Kelly J, Nakachi K, Sakashita A, Said JW, et al. Breast cancer. Cyr61 is overexpressed, estrogen-inducible, and associated with more advanced disease. J Biol Chem 2001; 276:14187 - 94; PMID: 11297518
- Hung KF, Lin SC, Liu CJ, Chang CS, Chang KW, Kao SY. The biphasic differential expression of the cellular membrane protein, caveolin-1, in oral carcinogenesis. J Oral Pathol Med 2003; 32:461 - 7; http://dx.doi.org/10.1034/j.1600-0714.2003.00185.x; PMID: 12901727
- Tanase CP, Dima S, Mihai M, Raducan E, Nicolescu MI, Albulescu L, et al. Caveolin-1 overexpression correlates with tumour progression markers in pancreatic ductal adenocarcinoma. J Mol Histol 2009; 40:23 - 9; http://dx.doi.org/10.1007/s10735-008-9209-7; PMID: 19160064
- Bender FC, Reymond MA, Bron C, Quest AF. Caveolin-1 levels are down-regulated in human colon tumors, and ectopic expression of caveolin-1 in colon carcinoma cell lines reduces cell tumorigenicity. Cancer Res 2000; 60:5870 - 8; PMID: 11059785
- Glait C, Tencer L, Ravid D, Sarfstein R, Liscovitch M, Werner H. Caveolin-1 up-regulates IGF-I receptor gene transcription in breast cancer cells via Sp1- and p53-dependent pathways. Exp Cell Res 2006; 312:3899 - 908; http://dx.doi.org/10.1016/j.yexcr.2006.08.016; PMID: 17014845
- Williams TM, Lisanti MP. Caveolin-1 in oncogenic transformation, cancer, and metastasis. Am J Physiol Cell Physiol 2005; 288:C494 - 506; http://dx.doi.org/10.1152/ajpcell.00458.2004; PMID: 15692148
- Waldman T, Kinzler KW, Vogelstein B. p21 is necessary for the p53-mediated G1 arrest in human cancer cells. Cancer Res 1995; 55:5187 - 90; PMID: 7585571
- Lee YS, Marks AR, Gureckas N, Lacro R, Nadal-Ginard B, Kim DH. Purification, characterization, and molecular cloning of a 60-kDa phosphoprotein in rabbit skeletal sarcoplasmic reticulum which is an isoform of phosphoglucomutase. J Biol Chem 1992; 267:21080 - 8; PMID: 1328221
- Sherif ZA, Nakai S, Pirollo KF, Rait A, Chang EH. Downmodulation of bFGF-binding protein expression following restoration of p53 function. Cancer Gene Ther 2001; 8:771 - 82; http://dx.doi.org/10.1038/sj.cgt.7700361; PMID: 11687900
- Yang YH, Dudoit S, Luu P, Lin DM, Peng V, Ngai J, et al. Normalization for cDNA microarray data: a robust composite method addressing single and multiple slide systematic variation. Nucleic Acids Res 2002; 30:e15; http://dx.doi.org/10.1093/nar/30.4.e15; PMID: 11842121
- Srivastava S, Zou ZQ, Pirollo K, Blattner W, Chang EH. Germ-line transmission of a mutated p53 gene in a cancer-prone family with Li-Fraumeni syndrome. Nature 1990; 348:747 - 9; http://dx.doi.org/10.1038/348747a0; PMID: 2259385