Abstract
E2F-1, a key transcription factor necessary for cell growth, DNA repair, and differentiation, is an attractive target for development of anticancer drugs in tumors that are E2F “oncogene addicted”. We identified a peptide isolated from phage clones that bound tightly to the E2F-1 promoter consensus sequence. The peptide was coupled to penetratin to enhance cellular uptake. Modeling of the penetratin-peptide (PEP) binding to the DNA E2F-1 promoter demonstrated favorable interactions that also involved the participation of most of the penetratin sequence. The penetratin-peptide (PEP) demonstrated potent in vitro cytotoxic effects against a range of cancer cell lines, particularly against Burkitt lymphoma cells and small cell lung cancer (SCLC) cells. Further studies in the H-69 SCLC cell line showed that the PEP inhibited transcription of E2F-1 and also several important E2F-regulated enzymes involved in DNA synthesis, namely, thymidylate synthase, thymidine kinase, and ribonucleotide reductase. As the PEP was found to be relatively unstable in serum, it was encapsulated in PEGylated liposomes for in vivo studies. Treatment of mice bearing the human small cell lung carcinoma H-69 with the PEP encapsulated in PEGylated liposomes (PL-PEP) caused tumor regression without significant toxicity. The liposome encapsulated PEP has promise as an antitumor agent, alone or in combination with inhibitors of DNA synthesis.
Introduction
Loss of the retinoblastoma protein (RB) is the hallmark of retinoblastoma and small cell lung cancer. In cervical cancer, both p53 and RB are inactivated by papilloma viral infection. RB loss has also been found in a high percent of metastases in castrate-resistant prostate cancers.Citation1 Loss of RB results in elevated levels of one or more of the activating E2Fs which, by activating growth receptor signaling pathways, leads to cell cycle deregulation, uncontrolled cell growth, increased invasiveness of tumors, and an increased ability of tumors to metastasize.Citation2 In other tumors, activating E2Fs can be overexpressed as a result of gene amplification,Citation3-Citation6 or increases in myc protein.Citation7 Inactivation of p53 allows cells to survive the elevated levels of E2F, which otherwise would result in apoptosis. In this context, in cells that lack normal apoptotic function due to mutations in apoptotic genes (i.e., p53) and/or upregulation of anti-apoptotic proteins (particularly Mcl-1Citation8 and survivinCitation9) E2F-1 switches from a tumor suppressor to an oncogene.Citation10
The E2F family of transcription factors is critical to many cellular processes, including development, proliferation, DNA repair, and differentiation.Citation11-Citation15 To date, eight members of the E2F family have been identified. Broadly, E2F-1, -2, and -3a are transcriptional activators of genes, while E2F-4 to -6 are repressors of E2F gene function. E2F-7 and -8 lack activation domains, but have anti-proliferative functions. The canonical binding sequence in the E2F responsive promoters, 5′-TTTSSCGC-3′ (S = C or G) is present in genes important for DNA synthesis, including dihydrofolate reductase (DHFR), thymidine kinase (TK), thymidylate synthase (TS), DNA polymerase α, and the R2 subunit of ribonucleotide reductase (RR). A critical player in the regulation of E2F is the retinoblastoma gene product (RB), which forms heterodimers with E2F-1, -2, and -3a, thereby suppressing E2F activity.Citation1,Citation11 In response to signals favoring cell cycle progression, RB is phosphorylated by CDK 4, 6, and 2, and as a consequence, E2F is freed from this repressor complex and transcribes many target genes. Given the critical proliferative functions of E2F target genes, it is not surprising that both E2F-1 and E2F-3 are overexpressed in many tumors and is associated with poor prognosis.Citation16-Citation18 Given this critical regulation by free E2F, targeting overexpression of one or more activating E2Fs, which can act as driver(s) for proliferation, has been recognized as an important and selective antitumor strategy. Various E2F targeting approaches have been attempted, including oligonucleotide decoys to trap E2F-1, peptides that prevent the dimerization between E2F-1 and its DP partners, which results in subsequent inhibition of E2F-1 transcription.Citation19,Citation20 However, none have advanced to clinical trials for the treatment of cancer.
“Oncogene Addiction” and the rationale for targeting E2F expression
The term “oncogene addiction” was first coined by the late Bernard Weinstein to indicate that some tumors are dependent on the activity of a particular oncogene for survival, despite the complexity and variation of the genetic changes that are present in most tumor types.Citation21 Identification and subsequent inhibition of the function of certain oncogenes that act as drivers for tumor proliferation in specific tumors results in dramatic tumor regression (e.g., mutated B-Raf in melanoma). Nevertheless, resistance to the drug or antibody that targets the oncogene eventually arises, necessitating strategies to combine targeted drugs with other therapeutic measures that may increase initial cell kill and/or circumvent target resistance.
Previous studies suggest that tumor cells that overexpress E2F activating proteins are “addicted” to these E2F oncogenes. In this study, small cell lung cancer (SCLC) was selected as an example of a human malignancy that lacks RB, has mutant p53, and may require E2F-1 or 3 for survival. Although SCLC is often responsive to current drug treatments, these responses are short lived, and patients are not curable once tumors have metastasized.
Herein, we show that a peptide, isolated by phage display that bound tightly to an immobilized consensus E2F-1 promoter sequence, when coupled to penetratin, was cytotoxic to many malignant cell lines. In particular, Burkitt lymphoma and RB negative SCLC cells were killed at low micromolar concentrations, while the penetratin-peptide (PEP) was much less cytotoxic to bone marrow hematopoietic and mesenchymal stem cells. Treatment of xenografts of the human small cell lung tumor H-69 propagated in nude mice with PEGylated liposome encapsulated PEP (PL-PEP) to enhance in vivo stability, caused tumor regression without significant toxicity. As a consequence of targeting E2F, the PEP also decreased levels of E2F-1 regulated enzymes that are targeted by clinically useful drugs, indicating that the combination of the PEP with these agents would be additive or synergistic.
Results
Generation of an E2F-1 inhibitory peptide
We used phage display to find heptapeptides that bound tightly to an immobilized consensus E2F-1 sequence, shown below in bold.Citation22
5′-ATTTAAGTTT CGCGCCCTTT CTCAA-3′
3′-TAAATTCAAA GCGCGGGAAA GAGTT-5′.
After stringent washing conditions, 8 phage clones were isolated, and the DNA sequenced and peptide sequences were determined as shown:
His-Arg-Pro-Trp-Ile-Ala-His
His-His-His-Arg-Leu-Ser-His
His-Ala-Ile-Tyr-Pro-Arg-His
Pro-Glu-Tyr-Asp-Pro-Tyr-Phe
As the sequence His-His-His-Arg-Leu-Ser-His appeared in 5 of the 8 tight binding clones, we selected this peptide for further study.
Modeling studies
In order to identify the role of the individual amino acids as well as contribution of the penetratin peptide to binding to the E2F consensus site, we initiated modeling studies using docking methods followed by refinement of the resulting complexes using molecular dynamics in a water box (see Materials and Methods). The homology model of E2F-1-DP1 complex with DNA (see ) served as our reference for development of an increased understanding of peptide-DNA interactions in this system. The homology model also serves as a starting point for design/development of novel small peptides, which might bind competitively to the promoter region. The binding free energy estimates shown in were obtained from the water box simulations using the MM-PBSA approach.Citation23
Figure 1. The left panel (A) shows a cutout view of the α3 helix RRIYD motif (residues 165 to 169) interactions with the DNA (from the homology model of E2F-1-DP1 complex with DNA). The middle panel (B) shows the model of penetratin-HHHRLSH peptide built from the X-ray crystal structure of Antennapedia homeodomain (9ANT). Illustrations prepared using Pymol.57 The binding interactions of the α3 helix motif (RRIYD) with the DNA are illustrated In the right panel (C). Illustration prepared using UCSF Chimera.58 Both arginine residues (R165 and R166) have interactions with phosphate backbone and DNA base pairs. The tyrosine residue, Y168, interacts with phosphate backbone and the aspartate residue, D169, interacts with a DNA base pair. The E2F-1-DP1 hetero-dimer winged helix fold places the α3 helices of the two proteins in the major groove of the DNA.
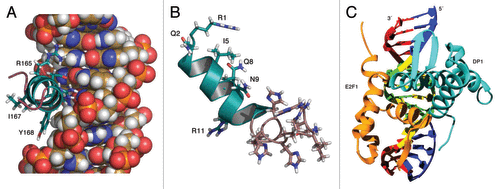
Table 1. Estimates of thermodynamic properties (kcal/mol) and DNA helical axis bend for the penetratin linked peptides.
The curvature of the penetratin-HHHRLSH (3) (see ), penetratin-AAAVLSA (1) and penetratin-AAAVLVA (4) peptides match the curvature of the DNA major groove and the abundance of basic residues (arginine, lysine and histidine) in the penetratin-HHHRLSH (3) sequence interact very well with the bases and phosphate backbone of the DNA. The penetratin-GGGALSA peptide (2) lacks curvature and has fewer interactions with the DNA. The penetratin linked HHHRLSH peptide (3) is predicted to be the best DNA binder compared with the penetratin-GGGALSA peptide (2) or the penetratin-AAAVLSA (1) peptide; however, only marginally better than penetratin-AAAVLVA (4). The helical bend for the DNA in the crystal structure of the E2F4-DP2 complex is small 7.3° compared with the bend found in the penetratin-HHHRLSH peptide (3) complex, 27.9°. DNA bending may play a role in blocking the transcription factor. The binding free energy estimates did not correlate as well as we had hoped for the cytotoxicity data of peptide (3) compared with peptide (4). There are a number of reasons for this shortcoming. The binding free energy estimates are best related to in vitro data as the model does not account for the differential ability of these peptides to penetrate cell membranes. The docking method uses a rigid, shape-based scoring approach, which may not be the best approach for peptide-DNA docking. The docking approach here assumes rigid peptide interacting with rigid DNA upon binding. Our best guess for this system was to use the bound conformation of DNA from the crystal structure as receptor and pre-equilibrated peptide models. At best, our docked models might represent a preliminary binding step before a conformational induced fit into the major groove. The single trajectory approach used to estimate ΔGbind might not have sampled enough conformational space. Despite these limitations, the models in a qualitative sense underscore the importance of the bend in the penetratin helix afforded by the heptapeptide extensions. In addition, the models also illustrate the importance of the additional interaction with nucleic acid phosphate backbone provided by the arginine residue (R20) in the HHHRLSH sequence in (3). In comparing our model penetratin linked peptides with the RRXYD motif of the E2F protein’s α3 helix, we note the penetratin-linked peptides bind in a slightly different manner than the RRXYD motif. The models indicate that salt bridge interactions between the arginine and lysine residues and the DNA phosphate backbone is predominant in these complexes; whereas, the RRXYD motif in the E2F proteins rely more on direct hydrogen bond interactions with the purine and pyrimidine rings of the GC DNA base pairs (see ) in addition to van der Waals interactions.
The PEP binds to the E2F-1, -2, and -3 but not to the E2F-4 promoter
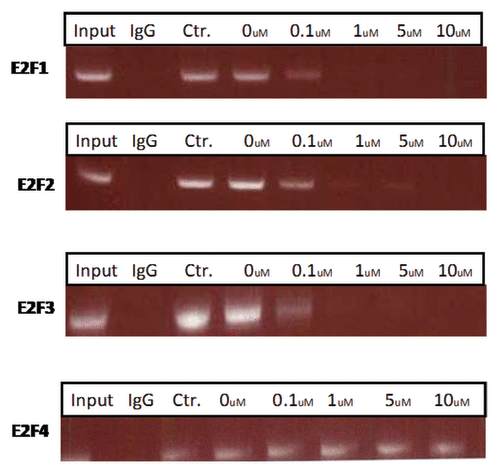
To determine if the PEP bound to its promoter in vivo, a chromatin immunoprecipitation (ChIP) assay was performed using H-69 cells with a pair of primers flanking two E2F binding sites in the E2F-1, -2, -3, and -4 promoters. As shown in , compared with the control peptide, the PEP significantly reduced binding of E2F-1 at low micromolar doses. Binding to the E2F-2 and -3 promoters was also demonstrated, while no binding to the E2f-4 promoter or control IgG was noted.
Figure 2. The PEP inhibits E2F-1, 2, and 3 protein binding to its promoter. Serum-starved H-69 cells were treated with different concentrations of the PEP and control peptide for 24 h. A ChIP assay was performed with antibody against E2F-1, 2, 3, and 4 and control IgG. The primers used in PCR flank the binding site in the E2F promoters (see Materials and Methods).
The PEP downregulated E2F-1 and E2F-3 mRNA and protein and downstream E2F targets
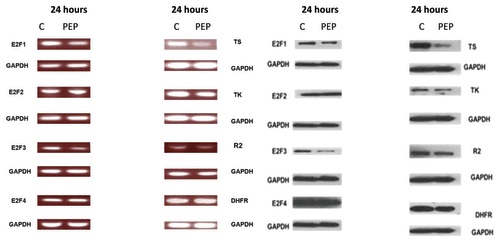
As all the promoters of E2F-1, 2, 3, and TS, DHFR, TS, TK, and the R-2 subunit of RR have E2F binding sites we examined the effect of the PEP on the expression of these genes. (left panel) shows that E2F-1 and 3 message RNA and protein levels were downregulated in H-69 cells 24 h after exposure to IC50 levels of the PEP (10 µM). Of interest, E2F-2 and E2F-4 protein levels were not downregulated after 24 h of exposure to the PEP (, right panel). Decreases in the mRNA levels of TK, RR, and TS were observed following incubation with the PEP as well as protein levels of these enzymes. Interestingly, DFHR mRNA and protein levels did not decrease appreciably following PEP treatment.
Figure 3. The PEP downregulates mRNA and protein levels of target genes. mRNA and protein levels were measured following a 24 h exposure of H-69 cells to the PEP. Left panel shows results of RT-PCR for E2F-1 targets TS, RR2, E2F-2, E2F-3, E2F-4, and DHFR using mRNA isolated from H-69 cells treated with PEP or control peptide (C) at the indicated concentrations for 24 h. Right panel shows result of western blots using antibodies against these proteins.
PEP inhibition effect of cancer and non-malignant cells
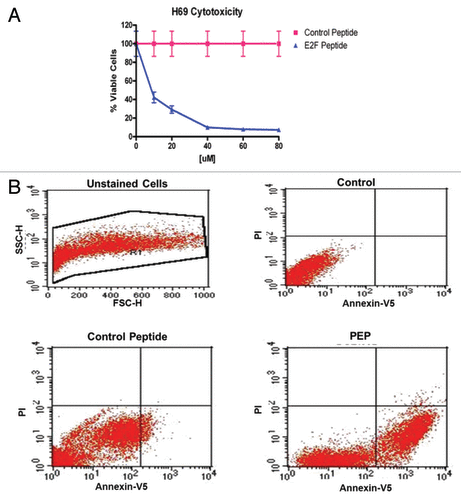
To determine whether the PEP antitumor effects, we tested the peptide against to a wide range of different cell lines including both malignant and non-malignant cells. Initial studies with the naked peptide at a concentration of 80 µM, did not inhibit growth of several tumor cell lines, and likely was not taken up by tumor cells. Therefore we coupled the peptide to penetratin, the peptide from Drosophila, shown to enhance uptake of compounds into mammalian cells.Citation22 The penetratin coupled peptide (PEP) was found to be cytotoxic to a wide range of tumor cell lines, with variable effectiveness (). Among them, the Ramos (Burkitt lymphoma) cell line and the H-69 (small cell lung cancer) cell line had the lowest IC50 values (, cytotoxicity profile of PEP vs. control peptide). Interestingly, H865, another human small cell lung cancer cell line that unlike the H-69 cell line, expresses RB, was much less sensitive to the PEP. Importantly, normal human CD34 positive cells, containing hematopoeitic stem cells (HSC) were insensitive to the PEP (IC50 > 80 µM) as were as human marrow mesenchymal stem cells (HMSC) and primary mouse fibroblasts (). A control PEP, with the 4 histidines in the septamer replaced by alanines, had little or no effect on cell growth when assayed against the H-69 cell line () as well as two other cell lines, DU145 and Ramos (data not shown).
Table 2. Relative IC50 values for the PEP in various tumor cells lines IC50 data are from cells incubated with the Pep for 24 h
Figure 4. (A) Toxicity of the PEP compared with a control PEP. H-69 cells in mid log phase were plated in 96-well plates and incubated with increasing doses of the PEP or control peptide. Cells were enumerated at 96 h using the Vicell counter. Assays were performed in triplicate for 3 independent experiments. (B) The PEP induces apoptosis in H-69 cells. The percentage of apoptotic cells increased from 20.3% to 52.3% following a 24 h exposure to PEP as compared with control peptide in H-69 cells.
The PEP induces apoptosis
To test whether the PEP induced cell death is through the apoptosis pathway, we treated H-69 cells and a range of other cancer cell lines with the PEP. Even at 4 h after PEP treatment, cancer cells began to show morphologic changes including loss of cell–cell contact and disintegration of the cellular and nuclear membrane indicating that the PEP was inducing apoptosis (data not shown). To confirm that treated cells underwent apoptosis, H-69 cells were treated with peptide for 4 h at the IC50 concentration and cells analyzed after Annexin V and propidium iodide (PI) staining and flow cytometry. Annexin V staining alone indicates early apoptotic cells, while double staining by both Annexin V and PI indicates late apoptotic cells. Staining by PI alone indicates necrotic cells. As shown in , the percentage of early apoptotic cells was significantly increased in the presence of PEP, as compared with no treatment or treatment with the control PEP. PEP induced apoptosis was confirmed by cleavage of markers such as PARP and caspase 3 (data not shown). Similar results were seen in Du-145 human prostate cancer cells and the Burkitt cell line, Ramos.
Body distribution, tumor accumulation, and internalization studies with the PEP encapsulated with PEGylated liposomes
To test PEP stability, the PEP was incubated in cell-free media with FBS for 24 h, followed by the addition of cells and toxicity assayed. Under these conditions there was a marked decrease in cytotoxicity. To confirm that the PEP was relatively unstable in RPMI media and FBS, fresh peptide was added every 24 h for 2 additional days to H-69 cells and cell viability measured every 24 h for 3 d. Daily PEP addition × 3 resulted in a 4-fold increase in potency (not shown). Thus the IC50 values, from a single exposure, is much less when compared with administration of fresh peptide daily for 3 d.
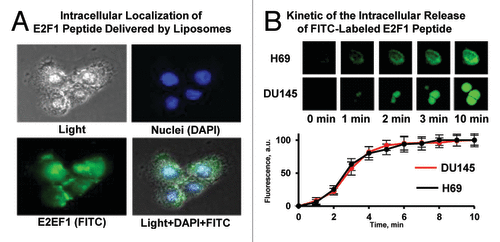
As the PEP had limited stability in vitro, we elected to encapsulate the peptide in PEGylated liposomes to enhance stability and targeting to tumor in vivo. The liposome encapsulated PEP (PL-PEP) was found to rapidly accumulate and localize to the nucleus in both H-69 and Du-145 cells (). Previous electron microscopic studies have shown that PEGylated liposomes accumulated in tumor tissue. For these experiments, in addition to encapsulating the PEP in PEGylated liposomes we also modified the PEP by replacing the methionine in the PEP by isoleucine, as this substitution allowed the PEP to be generated recombinantly (unpublished). No differences in binding or cytotoxicity between this modified PEP and the unmodified PEP were observed.
Figure 5. Intracellular localization and release of E2F-1 penetratin-peptide delivered with liposomes. (A) Representative images of Du-145 human prostate cancer cells incubated within 5 min with PEGylated liposomes containing E2F-1 peptide. Cell nuclei were stained with nuclear-specific dye DAPI (blue fluorescence), peptide was labeled with FITC (green fluorescence). Superimposition of images allows for detecting of cytoplasmic (green) and nuclear (cyan) localization of peptide. (B) Kinetics of the intracellular release of FITC-labeled E2F-1 peptide from PEGylated liposomes. H-69 human small cell lung cancer (peptide most sensitive) and DU145 human prostate (peptide less sensitive) cancer cells were incubated for different periods of time with PEGylated liposomes containing E2F-1 peptide. Upper panel: representative fluorescence images of cells. Bottom panel: Time course of the fluorescence intensity of FITC-labeled E2F-1 pentratin-peptide released from liposomes. Means ± SD from 6 independent measurements are shown.
The peptide has potent antitumor effects in a xenograft mouse model
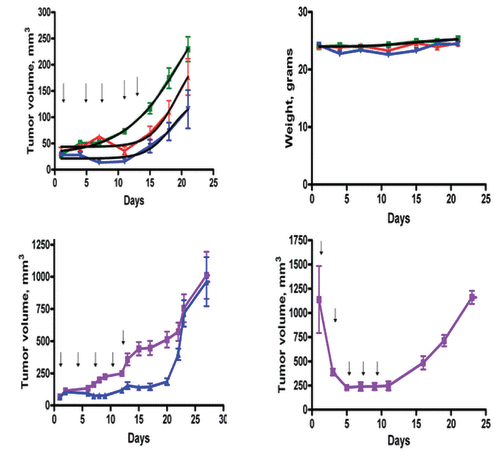
The improved stability and tumor targeting ability of the PL-PEP encouraged us to evaluate the anti-tumor effect of the PL-PEP in vivo. Xenografts of the human small cell carcinoma cell line H-69 were used to test the anti-tumor effects of the PL-PEP. In the first experiment, two doses of the PL-PEP were used, 30 and 60 mg/kg (0.03 mL and 0.06 mL of liposomes, respectively), to test the toxicity and possible antitumor effects of the PL-PEP. There was a dose dependent effect on tumor growth without weight loss (top left panel, ). As the 60 mg/kg dose had no toxicity, we tested the effect of a more frequent administration of the PL-PEP (i.p. every other day × 6).Tumor inhibition as compared with untreated control again was observed, again without weight loss (bottom left panel, ). These results encouraged us to administer a larger dose (100 mg/kg) also given every other day to animals with large tumors (>1000 mm3). Even with advanced tumors, regression without significant weight loss was noted (bottom right panel, ). At this dose, transient distress was noted, likely due to liposome accumulation in lung, but animals quickly recovered. As before, tumors re-grew when the PL-PEP treatments were stopped.
Figure 6. Treatment of nude mice bearing the H-69 small cell carcinoma xenografts with the PEP encapsulated in PEGylated liposomes. Female mice (20−22 g) were inoculated intraperitoneally with 10 million cells and an equal volume of matrigel. When the tumors were approximately 50mm3, the animals were randomized into groups of 6 and either treated with 0.06 mL of empty PEGylated liposomes (control) or 0.03 mL of PEGylated liposomes (30 mg/m2 of PEP, red) or 0.06 mL of PEGylated liposomes (60 mg/m2 of PEP, blue), every 4 d. Tumor size (top left) and animal weight (top right) was measured every three days (control, purple; treated, blue). As little toxicity was observed, a dose of 60mg/kg given every other day was also tested in tumor bearing animals with (bottom left). The effects of the liposome encapsulated PEP given every other day × 5 at a higher dose (100 mg/kg) on large tumors at the time they would be sacrificed because of tumor size was also tested (bottom right). Tumor regression was noted even after the first dose of drug, without weight loss.
Discussion
A strong rationale exists for targeting E2F-1 for cancer therapy. E2F-1 levels or E2F-3 levels are high in several human cancers associated with lack of RB and mutant p53.Citation2 In some tumors overexpression has been linked to gain in copy number of the E2F-1 gene, which maps to 20q11.2 in the human genome.Citation3 Lack of RB and Increased E2F-1 expression correlated with a poorer outcome in patients with small cell lung cancer,Citation24 breast cancer,Citation25 prostate cancerCitation1 and malignant melanoma.Citation26 Given the role of the E2F family of transcription factors not only in proliferation and tumor progression and metastasis, there have been several efforts to target one or more of the E2Fs as an antitumor strategy (reviewed inCitation19,Citation20). Ma et al.Citation27 screened a small molecule library using the crystal structure of E2F-4 /DP-2 bound to DNA and found a compound that inhibited E2F-4 binding and growth of several tumor cell lines. The growth of E2F-4-deficient MEFs was still partially inhibited by this compound, indicating that downregulation of other E2Fs, in addition to E2F-4, likely also contributed to cell death
Specificity of binding of the PEP to the promoter of E2F was shown by CHiP assays and the effect of the PEP on known E2F targets and the modeling studies. E2F inhibition by the PEP resulted in downstream regulation of proteins that are targets for clinically useful chemotherapeutic drugs including 5-fluoropyrimidines and pemetrexed that target TS; and hydroxyurea, which targets RR. Drugs that target these enzymes together with the PEP that lowers E2F-1 activity would be predicted to result in enhanced anti-tumor effects. Studies in progress will determine the effect of combinations of the peptide with TS and RR inhibitors, as well as with DNA damaging agents, given the role of E2F-1 in DNA repair.Citation15,Citation28
The modeling studies indicate that these penetratin-linked peptides might interact with DNA in a different manner (most likely due to the unique curvature of the peptide helical structure which fits the curvature of the DNA major groove) compared with the more linear helix of the conserved RRXYD motif in the E2Fs. In addition, the models also illustrate the potential importance of the additional interaction with nucleic acid phosphate backbone provided by the arginine residue in the HHHRLSH sequence in peptide 3 as shown in . The more effective binding peptides (1, 3 and 4) as predicted by the MM-PBSA method in produced a pronounced bend in the helical axis of the DNA. However, the MM-GBSA method predicts peptides 1 and 2 to be about the same in terms of binding affinity. Future modeling studies will be correlated with the individual contribution of each amino acid to the cytotoxic effects of the PEP, in an attempt to increase stability and potency.
To enhance stability and the half -life of the PEP for in vivo studies we encapsulated the PEP into PEGylated liposomes. Treatment of nude mice bearing the human H-69 small cell lung tumor with the encapsulated peptide showed tumor regression without significant toxicity. Regression of even far advanced tumors was noted with a non-toxic dose of drug. However, re-growth of tumors occurred when the treatment was stopped for all doses tested. It is likely that more frequent dosing or an increase in dose will be more effective. Further in vivo studies of the PL-PEP will explore additional doses and schedules as well as combinations of the PL-PEP with antimetabolites.
Materials and Methods
Cell culture
All cell lines were obtained from ATCC and cultured in RPMI media supplemented with 10% heat inactivated bovine serum, penicillin, and streptomycin. CD34+ cells were isolated from cord blood (Elie Katz Umbilical Cord Blood, CB 7015744) as previously described. The effect of the penetratin-peptide (PEP) on CD34+ cells was measured by colony formation using X-VIVO™ 10 medium supplemented with human SCF (50 ng/mL, PeproTech), human TPO (10 ng/mL, PeproTech), and human FLT-3L (50 ng/mL, Immunex). Methylcellulose colony culture was performed in 35-mm culture dishes.
Cell viability assay
Cells were plated in 24-well plates and treated with the PEP and control PEP respectively at various concentrations. Cells were enumerated at 96 h using the Vicell counter.
Chromatin immunoprecipitation assay (CHIP)
Chromatin immunoprecipitation was performed according to Cell Signaling chromatin IP procedures with some modifications. Briefly, three T25 flasks containing 1.2 × 10⁷ cells were treated with 1% formaldehyde for 10 min at room temperature. Cross-linking was stopped by the addition of glycine to a final concentration of 125 mM. Cells were washed with cold phosphate-buffered saline and resuspended in PBS containing protease inhibitors, pelleted by centrifugation, resuspended in buffer B (Cell Signaling) with Micrococcal Nuclease and incubated at 37 °C for 20 min and nuclease activity stopped by addition of EDTA. Cell nuclei were pelleted, washed once in ChIP buffer (Cell Signaling) incubated for 10 min on ice and resuspended in sonication buffer with protease inhibitors (Cell Signaling). After 10 min incubation on ice, the solution was sonicated using Fisher sonic Dismembrator 50 by three sets of 20 sec pulses on ice. The chromatin solution was cleared for 10 min at 14 000 rpm and a small aliquot (approximately 2−5% of the sample) was frozen in liquid nitrogen. The supernatant of this aliquoted sample was later processed in parallel with the immunoprecipitates starting with the RNase A and proteinase K digest (this sample is referred to as “input”) and stored at −80 °C. After thawing, the solution was microcentrifuged as before and then pre-cleared by the addition of a mixture of protein G Magnetic beads. Aliquots of the pre-cleared chromatin were incubated with 2.5 μg of each antibody overnight at 4 °C. The immunoprecipitates and the input sample were digested with 10 μg each of RNase A and proteinase K at 55 °C for 3 h. After incubation at 65 °C 2 h DNA was purified using spin columns and the supernatant containing the co-precipitated DNA was applied to a PCR purification column (Cell Signaling). The purified DNA was eluted in 50 μl of 10 mM Tris. One microliter of the eluted DNA was used for PCR. The following antibodies were used: anti-E2F antibodies anti-E2F-1, anti-E2F2, anti-E2F3 (Santa Cruz), and IgG (Cell Signaling).The PCR product for the chromatin immunoprecipitation with protein-specific antibodies were separated on an SDS page gel and stained with ethidium bromide.
The following primers were used:
E2F-1: 5′-AATGAATGAG TTCAAGCAGA T-3′ and 5′-TCAGCTTAGA TTTCCCAGAG A-3′;
E2F2: 5′-TACAAAGAAG TATAGGTTT-3′ and 5′-TTCCGGGATT CACAGTGCAG-3′;
E2F3: 5′-CACATGCTTC TGTCTATCA-3′ and 5′-AAGGGAACAC TCTTTCCTTT GT-3′.
E2F4: 5′-AGGCAGAGAA AGACTCAATG CTGCAA-3′ and 5′-AGCCGGCCTG CCGGCAGGCA TCGCACAACT-3′
The PCR amplifications were run for 40 cycles
mRNA determinations of E2Fs, TS, TK, DHFR, and the R2 subunit of ribonucleotide reductase
Untreated and cells treated with PEP were collected 24 h later and RNA was prepared with TRIZOL reagent (Invitrogen). PCR amplification of the E2F-1, 2, 3, and 4 and the R2 subunit of RR, DHFR, TS, and TK-1 was performed with the following forward and reverse primer pairs respectively:
E2F-1F, 5′-AGGCTGGACC TGGAAACTGA CCAT-3′ and
E2F-1R, 5′-AGCTGCGTAG TACAGATATT CATCA-3′;
E2F-2F, 5′-AAGTGCATCA GAGTGGATGG CC-3′
E2F-2R, 5′-AAGTTGCCAA CAGCACGGAT A-3′
E2F3a-F, 5′-AGAAAGGGAA TCCAGCCCGC TC-3′
E2F3a-R, 5′-CTAGCTCCAG CCTTCGCTTT GC-3′
E2F-4-F, 5′-TGCTCACCAC CAAGTTCGTG TC-3′
E2F-4-R, 5′-GTACTTCTTC TGCCCATTGA G-3′
R2-F, 5′-TGGAGGATGA GCCGCTGCTG AGA-3′
R2-R, 5′-TTGACACAAG GCATCGTTTC AATGG-3′;
TS-F, 5′-GCGCTACAGC CTGAGAGATG AATT-3′
TS-R, 5′-CTTCTGTCGT CAGGGTTGGT TTTG-3′;
TK-1-F, 5′-GCATTAACCT GCCCACTGTG CTGC-3′
TK-1-R, 5′-GTGCCGAGCC TCTTGGTATA GGC-3′.
DHFR-F, 5′-TAAACTGCAT CGTCGCTGTG T-3′,
DHFR-R, 5′-AGGTTGTGGT CATTCTCTGG AAA-3′
Western blot analysis
Western blots were performed according to standard procedures with 30 μg of whole-cell extracts. Antibodies used were: anti-E2F-1 (KH95 Santa Cruz), E2F-2, E2F-3, E2F-4; anti-TK (3B3.E11 Santa Cruz); anti-R2 (I-15 Santa Cruz); anti-TS and anti DHFR antibody; Anti-PARP .Ab-2 (Oncogene) and anti-caspase 3 (Cell Signaling).
Apoptosis assay
Apoptosis assays were performed using an Annexin V-FITC apoptosis detection kit 1 according to the manufacturer’s instructions (BD PharMingen). All analyses were performed in triplicate.
Liposome preparation and loading with E2F-1 peptide
PEGylated liposomes were prepared as previously described.Citation29-Citation33 Briefly, lipids: Egg phosphatidylcholine (EPC), cholesterol (Chol), and 1,2,-distearoyl-sn-glycero-3-phosphoethanolamine-N-aminopolyethelenglycol ammonium salt (DSPE-PEG) purchased from Avanit Polar Lipids were dissolved in chloroform, evaporated to a thin film layer using a rotary evaporator Rotavapor® R-210/R-215 (BUCHI Corp.) and rehydrated with 0.9% NaCl to final lipid concentration 20 mM. The lipid mole ratio for this formulation was 51:44:5 EPC:Chol: DSPE-PEG respectively. E2F-1 peptide (labeled with fluoroescein isothiocyanate [FITC], purchased from Bio Basin Inc.) was loaded into liposomes by dissolving in rehydration buffer in a concentration of 20 mM. Liposomes were stored at room temperature for an hour followed by sequential extrusion through 200 nm and 100 nm polycarbonate membranes, using the extruder device (Northern Lipids Inc.). Free peptide was separated from liposomes by dialysis using dialysis membrane with pore size 12–14 kDa (Spectrum Labs) against 100 volumes of 0.9% NaCl overnight.
Characterization of liposomes
Liposomes were characterized by assessing their size and charge by dynamic light scattering and zeta-potential measurements, respectively. The liposomes were neutral with an average size of 100 nm.
Computational methods
Homology modeling
To explore important structural motifs in E2F-1 required for selectivity in binding to human DNA, we needed a model of the protein-DNA complex based on the human sequence. The homology model was built using the Modeler (9v5) program.Citation34-Citation37 The DNA binding domains of the E2F-1 and DP1 sequences (NCBI accession #’s AAC50719 and NP009042 respectively) were used for modeling the E2F-1-DP1 transcription factor complex with DNA. A single template approach was employed using the X-ray crystal structure of the human E2F4-DP2 complex with DNA (1CF7.pdb) as the template structure.Citation38 The DNA from the crystal structure was modeled in place using the default spatial constraints in the Modeler program. The E2F-1-DP1 heterodimer winged helix fold places the α3 helices of the two proteins in the major groove of the DNA. The conserved RRXYD motif found in the α3 helices of E2F-1 and DP1 is important for DNA recognition.
E2F-1: RFLELLSHSA DGVVDLNWAA EVLKVQ-KRRI YDITNVLEGI QLIAKKSKN
E2F2: KFIYLLSESE DGVLDLNWAA EVLDVQ-KRRI YDITNVLEGI QLIRKKAKN
E2F3: KFIQLLSQSP DGVLDLNKAA EVLKVQ-KRRI YDITNVLEGI HLIKKKSKN
E2F4: KFVSLLQEAK DGVLDLKLAA DTLAVRQ-KRR IYDITNVLEG IGLIEKKSKN
E2F5: KFVSLLQEAK DGVLDLKAAA DTLAVRQ-KRR IYDITNVLEG IDLIEKKSKN
E2F6: KFMDLVRSAP GGILDLNKVA TKLGVR-KRRV YDITNVLDGI DLVEKKSKN
Docking of HHHRLSH peptides to a DNA E2F promoter region
All of the E2F proteins can bind to a similar DNA sequence motif (TTTXXCGC) where XX can be either G or C. Our initial lead, HHHRLSH (3), was modeled linked to “penetratin” (RQIKIWFQNRRMKWKK).Citation39 For comparison study, we used GGGALSA (2) AAAVLSA (1) and AAAVLVA (4) to compare flexible in the case of (2) and more rigid non-polar (1 and 4) analogs of (3). We docked these peptides (i.e., with penetratin linked) to a model of the following DNA sequence built as the B-form using the Amber nucleic acid builderCitation40: 5′-AGTTTGGCGC GAAAT-3′ as a double helix with its complement. The penetratin-linked peptides (e.g., peptide 3 is RQIKIWFQNR RMKWKKHHHR LSH) were built from 9ANT.pdb (template)Citation41 using the Modeler program and the resulting models were protected on their N-terminal (ACE or acetyl) and C-terminal (NME or N-methyl) ends. All peptide models were pre-equilibrated in a water box at 300 K and 1 atm for 6 ns using the Amber 10 biomolecular simulation programsCitation42 prior to docking (molecular dynamics methods follows). Docking of the peptides to DNA was performed based on shape similarity using the PatchDock program.Citation43 The resulting top ten hits of each docking was re-scored using simple interaction energies () with infinite non-bonded cutoffs based on the Amber ff99SB force field.Citation44
Molecular dynamics
All peptide models were pre-equilibrated in a water box at 300 K and 1 atm for 6 ns using the Amber 10 biomolecular simulation package prior to docking.Citation42 All models of the peptide-DNA complexes were immersed in a periodic cubic box of TIP3P water using a 10 Å spacing.Citation45 The overall net charge of the system was neutralized by insertion of the appropriate number of Na+ ions. A 10 Å non-bonded cutoff was used for all simulations. Long-range electrostatics were accounted for using the Particle-mesh Ewald method.Citation46,Citation47 Bonds to hydrogen atoms were constrained using the SHAKE methodCitation48 as all molecular dynamics runs were performed using a 2 fs time step. Temperature in the system was maintained at 300 K using a Langevin integrator with collision frequency, γ = 1.0. Pressure in the system was regulated to 1 atm using a Berendsen barostat.Citation49 Each model was energy minimized using 500 steps of steepest descents followed by 500 steps of conjugate gradients while keeping the peptide-DNA restrained using a restraining force of 250 kcal/mol•Å. This was followed by energy minimization of the entire system using 750 steps of steepest descent followed by 750 steps of conjugate gradient. The solvent in each model was equilibrated from 0 to 300 K while keeping the peptide-DNA restrained with a force of 10 kcal/mol•Å for a period of 50 ps. Unrestrained production runs were run for 15 ns collecting snapshots every 10 ps. The binding free energy estimates were calculated from the last 2 ns of trajectory (200 snapshots) using the MM-PBSACitation44 and GBSACitation23,Citation50 methods provided in the Amber bio-simulation package. The estimates of the entropy values were computed using the nucleic acid builderCitation40 from 20 evenly spaced snapshots from the last 2 ns of simulation and DNA axis bend calculated using the Curves+ software packageCitation51 from the refined structure average. The results of the modeling studies are shown in .
Acknowledgments
Supported by grant NIH NCI CA 08010 and NIH NCI RO-1 CA 100098 and a grant from the Lung Cancer Research Foundation.
Authors' Contributions
XX designed and conducted experiments and helped to write the manuscript. JEK designed experiments, conducted modeling studies, and helped to write manuscript. TM designed and constructed liposomes and participated in writing of the manuscript. OG designed and conducted experiments with liposomes. KCL conducted CHiP assays and expression assays. AS isolated the peptides from phage clones. EEA designed experiments and helped in writing the manuscript. TBA performed studies with CD34+ cells and designed experiments. NJF conducted cell culture studies. DB designed experiments and helped write the manuscript. KWS designed experiments and helped write the manuscript. JRB had overall responsibility for the studies, designed experiments, and wrote the manuscript.
Disclosure of Potential Conflicts of Interest
No potential conflict of interest was disclosed.
References
- Sharma A, Yeow WS, Ertel A, Coleman I, Clegg N, Thangavel C, et al. The retinoblastoma tumor suppressor controls androgen signaling and human prostate cancer progression. J Clin Invest 2010; 120:4478 - 92; http://dx.doi.org/10.1172/JCI44239; PMID: 21099110
- Udayakumar T, Shareef MM, Diaz DA, Ahmed MM, Pollack A. The E2F1/Rb and p53/MDM2 pathways in DNA repair and apoptosis: understanding the crosstalk to develop novel strategies for prostate cancer radiotherapy. [Review] Semin Radiat Oncol 2010; 20:258 - 66; http://dx.doi.org/10.1016/j.semradonc.2010.05.007; PMID: 20832018
- Iwamoto M, Banerjee D, Menon LG, Jurkiewicz A, Rao PH, Kemeny NE, et al. Overexpression of E2F-1 in lung and liver metastases of human colon cancer is associated with gene amplification. Cancer Biol Ther 2004; 3:395 - 9; http://dx.doi.org/10.4161/cbt.3.4.733; PMID: 14726656
- Nelson MA, Reynolds SH, Rao UN, Goulet AC, Feng Y, Beas A, et al. Increased gene copy number of the transcription factor E2F1 in malignant melanoma. Cancer Biol Ther 2006; 5:407 - 12; http://dx.doi.org/10.4161/cbt.5.4.2512; PMID: 16481740
- Alonso MM, Alemany R, Fueyo J, Gomez-Manzano C. E2F1 in gliomas: a paradigm of oncogene addiction. Cancer Lett 2008; 263:157 - 63; http://dx.doi.org/10.1016/j.canlet.2008.02.001; PMID: 18334281
- Huang CL, Liu D, Nakano J, Yokomise H, Ueno M, Kadota K, et al. E2F1 overexpression correlates with thymidylate synthase and survivin gene expressions and tumor proliferation in non small-cell lung cancer. Clin Cancer Res 2007; 13:6938 - 46; http://dx.doi.org/10.1158/1078-0432.CCR-07-1539; PMID: 18056168
- O’Donnell KA, Wentzel EA, Zeller KI, Dang CV, Mendell JT. c-Myc-regulated microRNAs modulate E2F1 expression. Nature 2005; 435:839 - 43; http://dx.doi.org/10.1038/nature03677; PMID: 15944709
- Croxton R, Ma Y, Song L, Haura EB, Cress WD. Direct repression of the Mcl-1 promoter by E2F1. Oncogene 2002; 21:1359 - 69; http://dx.doi.org/10.1038/sj.onc.1205157; PMID: 11857079
- Jiang Y, Saavedra HI, Holloway MP, Leone G, Altura RA. Aberrant regulation of survivin by the RB/E2F family of proteins. J Biol Chem 2004; 279:40511 - 20; http://dx.doi.org/10.1074/jbc.M404496200; PMID: 15271987
- Engelman D, Putzer BM. The dark side of E2F-1: In transit beyond apoptosis. Cancer Res 2012; 72:2012; http://dx.doi.org/10.1158/0008-5472.CAN-11-2575
- Weinberg RA. The retinoblastoma protein and cell cycle control. Cell 1995; 81:323 - 30; http://dx.doi.org/10.1016/0092-8674(95)90385-2; PMID: 7736585
- Harbour JW, Dean DC. Rb function in cell-cycle regulation and apoptosis. Nat Cell Biol 2000; 2:E65 - 7; http://dx.doi.org/10.1038/35008695; PMID: 10783254
- Hallstrom TC, Mori S, Nevins JR. An E2F-1 gene expression program that determines the balance between proliferation and cell death. Cancer Cell 2008; 13:1311 - 22; http://dx.doi.org/10.1016/j.ccr.2007.11.031
- Kong LJ, Chang JT, Bild AH, Nevins JR. Compensation and specificity of function within the E2F family. Oncogene 2007; 26:321 - 7; http://dx.doi.org/10.1038/sj.onc.1209817; PMID: 16909124
- Stevens C, La Thangue NB. The emerging role of E2F-1 in the DNA damage response and checkpoint control. DNA Repair (Amst) 2004; 3:1071 - 9; http://dx.doi.org/10.1016/j.dnarep.2004.03.034; PMID: 15279795
- Vuaroqueaux V, Urban P, Labuhn M, Delorenzi M, Wirapati P, Benz CC, et al. Low E2F1 transcript levels are a strong determinant of favorable breast cancer outcome. Breast Cancer Res 2007; 9:R33; http://dx.doi.org/10.1186/bcr1681; PMID: 17535433
- Reimer D, Sadr S, Wiedemair A, Stadlmann S, Concin N, Hofstetter G, et al. Clinical relevance of E2F family members in ovarian cancer--an evaluation in a training set of 77 patients. Clin Cancer Res 2007; 13:144 - 51; http://dx.doi.org/10.1158/1078-0432.CCR-06-0780; PMID: 17200349
- De Meyer T, Bijsmans IT, Van de Vijver KK, Bekaert S, Oosting J, Van Criekinge W, et al. E2Fs mediate a fundamental cell-cycle deregulation in high-grade serous ovarian carcinomas. J Pathol 2009; 217:14 - 20; http://dx.doi.org/10.1002/path.2452; PMID: 18991331
- Kaelin WG Jr.. E2F1 as a target: promoter-driven suicide and small molecule modulators. Cancer Biol Ther 2003; 2:Suppl 1 S48 - 54; PMID: 14508080
- Bertino JRD, Banerjee D. E2F-1 as an anticancer drug target. Oncology Reviews 2009; 3:207 - 14; http://dx.doi.org/10.1007/s12156-009-0028-1
- Weinstein IB. Cancer. Addiction to oncogenes--the Achilles heal of cancer. Science 2002; 297:63 - 4; http://dx.doi.org/10.1126/science.1073096; PMID: 12098689
- Bertrand JR, Malvy C, Auguste T, Tóth GK, Kiss-Ivánkovits O, Illyés E, et al. Synthesis and studies on cell-penetrating peptides. Bioconjug Chem 2009; 20:1307 - 14; http://dx.doi.org/10.1021/bc900005j; PMID: 19552459
- Hawkins GD, Cramer CJ, Truhlar DG. Parametrized models of aqueous free energies of solvation based on pairwise descreening of solute atomic charges from a dielectric medium. J Phys Chem 1996; 100:19824 - 39; http://dx.doi.org/10.1021/jp961710n
- Eymin B, Gazzeri S, Brambilla C, Brambilla E. Distinct pattern of E2F1 expression in human lung tumours: E2F1 is upregulated in small cell lung carcinoma. Oncogene 2001; 20:1678 - 87; http://dx.doi.org/10.1038/sj.onc.1204242; PMID: 11313916
- Zhang SY, Liu SC, Al-Saleem LF, Holloran D, Babb J, Guo X, et al. E2F-1: a proliferative marker of breast neoplasia. Cancer Epidemiol Biomarkers Prev 2000; 9:395 - 401; PMID: 10794484
- Alla V, Engelmann D, Niemetz A, Pahnke J, Schmidt A, Kunz M, et al. E2F1 in melanoma progression and metastasis. J Natl Cancer Inst 2010; 102:127 - 33; http://dx.doi.org/10.1093/jnci/djp458; PMID: 20026813
- Ma Y, Kurtyka CA, Boyapalle S, Sung SS, Lawrence H, Guida W, et al. A small-molecule E2F inhibitor blocks growth in a melanoma culture model. Cancer Res 2008; 68:6292 - 9; http://dx.doi.org/10.1158/0008-5472.CAN-08-0121; PMID: 18676853
- Di Cresce C, Figueredo R, Ferguson PJ, Vincent MD, Koropatnick J. Combining small interfering RNAs targeting thymidylate synthase and thymidine kinase 1 or 2 sensitizes human tumor cells to 5-fluorodeoxyuridine and pemetrexed. J Pharmacol Exp Ther 2011; 338:952 - 63; http://dx.doi.org/10.1124/jpet.111.183178; PMID: 21673071
- Pakunlu RI, Wang Y, Saad M, Khandare JJ, Starovoytov V, Minko T. In vitro and in vivo intracellular liposomal delivery of antisense oligonucleotides and anticancer drug. J Control Release 2006; 114:153 - 62; http://dx.doi.org/10.1016/j.jconrel.2006.06.010; PMID: 16889867
- Garbuzenko OB, Saad M, Betigeri S, Zhang M, Vetcher AA, Soldatenkov VA, et al. Intratracheal versus intravenous liposomal delivery of siRNA, antisense oligonucleotides and anticancer drug. Pharm Res 2009; 26:382 - 94; http://dx.doi.org/10.1007/s11095-008-9755-4; PMID: 18958402
- http://www.ema.europa.eu/docs/en_GB/document_library/EPAR__Scientific_Discussion/human/000564/WC500025606.pdf
- Minko T, Pakunlu RI, Wang Y, Khandare JJ, Saad M. New generation of liposomal drugs for cancer. Anticancer Agents Med Chem 2006; 6:537 - 52; http://dx.doi.org/10.2174/187152006778699095; PMID: 17100558
- Wang Y, Saad M, Pakunlu RI, Khandare JJ, Garbuzenko OB, Vetcher AA, et al. Nonviral nanoscale-based delivery of antisense oligonucleotides targeted to hypoxia-inducible factor 1 alpha enhances the efficacy of chemotherapy in drug-resistant tumor. Clin Cancer Res 2008; 14:3607 - 16; http://dx.doi.org/10.1158/1078-0432.CCR-07-2020; PMID: 18519795
- Sali A, Blundell TL. Comparative protein modelling by satisfaction of spatial restraints. J Mol Biol 1993; 234:779 - 815; http://dx.doi.org/10.1006/jmbi.1993.1626; PMID: 8254673
- Martí-Renom MA, Stuart AC, Fiser A, Sánchez R, Melo F, Sali A. Comparative protein structure modeling of genes and genomes. Annu Rev Biophys Biomol Struct 2000; 29:291 - 325; http://dx.doi.org/10.1146/annurev.biophys.29.1.291; PMID: 10940251
- Sánchez R, Sali A. Comparative protein structure modeling. Introduction and practical examples with modeller. Methods Mol Biol 2000; 143:97 - 129; PMID: 11084904
- Marti-Renom MA, Madhusudhan MS, Fiser A, Rost B, Sali A. Reliability of assessment of protein structure prediction methods. Structure 2002; 10:435 - 40; http://dx.doi.org/10.1016/S0969-2126(02)00731-1; PMID: 12005441
- Zheng N, Fraenkel E, Pabo CO, Pavletich NP. Structural basis of DNA recognition by the heterodimeric cell cycle transcription factor E2F-DP. Genes Dev 1999; 13:666 - 74; http://dx.doi.org/10.1101/gad.13.6.666; PMID: 10090723
- Lamazière A, Chassaing G, Trugnan G, Ayala-Sanmartin J. Tubular structures in heterogeneous membranes induced by the cell penetrating peptide penetratin. Commun Integr Biol 2009; 2:223 - 4; http://dx.doi.org/10.4161/cib.2.3.8073; PMID: 19641736
- Macke T, Case DA. Modeling unusual nucleic acid structures. Molecular Modeling of Nucleic Acids. N. Leontes and J. SantaLucia, Jr. Washington, DC, ACS 1998; 379-393.
- Fraenkel E, Pabo CO. Comparison of X-ray and NMR structures for the Antennapedia homeodomain-DNA complex. Nat Struct Biol 1998; 5:692 - 7; PMID: 9699632
- Case DA, Cheatham TE 3rd, Darden T, Gohlke H, Luo R, Merz KM Jr., et al. The Amber biomolecular simulation programs. J Comput Chem 2005; 26:1668 - 88; http://dx.doi.org/10.1002/jcc.20290; PMID: 16200636
- Schneidman-Duhovny D, Inbar Y, Nussinov R, Wolfson HJ. Geometry-based flexible and symmetric protein docking. Proteins 2005; 60:224 - 31; http://dx.doi.org/10.1002/prot.20562; PMID: 15981269
- Hornak V, Abel R, Okur A, Strockbine B, Roitberg A, Simmerling C. Comparison of multiple Amber force fields and development of improved protein backbone parameters. Proteins 2006; 65:712 - 25; http://dx.doi.org/10.1002/prot.21123; PMID: 16981200
- Jorgensen W, Chandrasekhar J, Madura J, Klein M. Comparison of Simple Potential Functions for Simulating Liquid Water. J Chem Phys 1983; 79:926 - 35; http://dx.doi.org/10.1063/1.445869
- Darden T, York D, Pedersen L. Particle Mesh Ewald: An N-log(N) method for Ewald sums in large systems. J Chem Phys 1993; 98:10089 - 92; http://dx.doi.org/10.1063/1.464397
- Essmann U, Perera L, Berkowitz ML, Darden T, Lee H, Pedersen L. A smooth particle mesh ewald potential. J Chem Phys 1995; 103:8577 - 92; http://dx.doi.org/10.1063/1.470117
- Miyamoto S, Kollman P. SETTLE: An Analytical Version of the SHAKE and RATTLE Algorithms for Rigid Water Models. J Comput Chem 1992; 13:952 - 62; http://dx.doi.org/10.1002/jcc.540130805
- Berendsen HJC, Postma JPM, vanGunsteren WF, DiNola A, Haak JR. Molecular dynamics with coupling to an external bath. J Chem Phys 1984; 81:3584 - 90; http://dx.doi.org/10.1063/1.448118
- Wang J, Morin P, Wang W, Kollman PA. Use of MM-PBSA in reproducing the binding free energies to HIV-1 RT of TIBO derivatives and predicting the binding mode to HIV-1 RT of efavirenz by docking and MM-PBSA. J Am Chem Soc 2001; 123:5221 - 30; http://dx.doi.org/10.1021/ja003834q; PMID: 11457384
- Lavery R, Moakher M, Maddocks JH, Petkeviciute D, Zakrzewska K. Conformational analysis of nucleic acids revisited: Curves+. Nucleic Acids Res 2009; 37:5917 - 29; http://dx.doi.org/10.1093/nar/gkp608; PMID: 19625494