
Abstract
The present studies determined whether the antibiotic salinomycin interacted with HDAC inhibitors to kill primary human GBM cells. Regardless of PTEN, ERBB1, or p53 mutational status salinomycin interacted with HDAC inhibitors in a synergistic fashion to kill GBM cells. Inhibition of CD95/Caspase 8 or of CD95/RIP-1/AIF signaling suppressed killing by the drug combination. Salinomycin increased the levels of autophagosomes that correlated with increased p62 and LC3II levels; valproate co-treatment correlated with reduced LC3II and p62 expression, and increased caspase 3 cleavage. Molecular inhibition of autophagosome formation was protective against drug exposure. The drug combination enhanced eIF2α phosphorylation and decreased expression of MCL-1 and phosphorylation of mTOR and p70 S6K. Activation of p70 S6K or mTOR promoted cell survival in the face of combined drug exposure. Overexpression of BCL-XL or c-FLIP-s was protective. Collectively our data demonstrate that the lethality of low nanomolar concentrations of salinomycin are enhanced by HDAC inhibitors in GBM cells and that increased death receptor signaling together with reduced mitochondrial function are causal in the combinatorial drug necro-apoptotic killing effect.
Introduction
GBM has an abysmal 5-y survival rate and is an incurable malignancy. Even under optimal circumstances, in which essentially all of a glial tumor can be surgically removed and the patients are maximally treated with radiation and “state of the art” chemotherapeutic agents such as temozolomide (Temodar®) or BCNU (Gliadel® wafers), the median survival of this disease is only extended from ~3 mo to 12–15 mo.Citation1,Citation2 New radical approaches are needed to control the disease and prolong patient survival. Standard of care therapy for GBM patients involves either oral drug administration or drug placement at the site of the tumor, combined with XRT. Other approaches to treat GBM include infusion of drug at the site of the tumor via catheter under slow delivery or positive pressure (i.e., convection enhanced delivery) or use of a re-fillable subcutaneous pump.
Salinomycin is a polyether anti-bacterial and coccidiostat potassium ionophore drug isolated from Streptomyces albus.Citation3 In 2009 Gupta et al., after screening a library of ~16 000 compounds, expanded the potential utility of salinomycin positing its use as an anti-cancer stem cell drug in breast cancer.Citation4,Citation5 It was stated that salinomycin was 100× more potent at killing breast cancer stem cells than a standard of care agent such as paclitaxel. Others have shown similar anti-cancer stem cell effects with salinomycin in different tumor cell types, as well as salinomycin killing drug resistant tumor cells. Despite the initial report in 2009, no phase I clinical trials using the antibiotic have been listed in http://www.clinicaltrials.gov in the last four years and the probable reason for this lack of clinical investigation is that salinomycin, when administered systemically to humans, dogs, cats, cows, and pigs, has significant lethal morbidity issues associated with rhabdomyolysis of cardiac and skeletal muscle.Citation6,Citation7 An additional tissue toxicity is transient peripheral neuropathy, with low (μM) levels transiently altering the biology/inducing “anergy” of peripheral neurons.Citation8 Thus it is unfortunate that many published in vitro studies using ≥1 μM salinomycin probably have little biologic relevance vis-à-vis anti-cancer translational usefulness for humans or many other mammals. i.e., clinical use of salinomycin as an anti-cancer drug could only be contemplated in relatively localized tumors wherein the drug can be directly administered to the site of a tumor, at a dose that kills tumor but does not cause systemic normal tissue complications. In regard to localized tumor and drug delivery, one tumor type in particular stands out; glioblastoma multiforme tumors localized in the brain.
The molecular mechanisms by which salinomycin kills tumor cells are at present poorly understood. Salinomycin is an ionophore and part of its mechanism of action is thought to involve the formation of lipid-soluble complexes with cations, thereby facilitating bi-directional ion flux through lipid barriers by passive diffusion.Citation9 Salinomycin can alter cytosolic calcium concentrations in rabbit hearts and was shown to inhibit mitochondrial function in isolated mitochondria.Citation7,Citation10 Another study argued that salinomycin-induced increase of cytosolic Ca2+ was partially mediated by influx through the plasma membrane and partially by release of Ca2+ stored in mitochondria.Citation11 Salinomycin has also been shown to induce reactive oxygen/nitrogen (ROS/RNS) and to increase autophagy and mitophagy (the levels of early autophagosomes).Citation12,Citation13
Sodium valproate is an anti-convulsant used in the treatment of epilepsy, migraine, bipolar disorder, and prevention of seizures in GBM patients.Citation14 Side effects of the drug can include somnolence, tremors, and nausea. Valproate is a histone deacetylase (HDAC) inhibitor of class I, but weakly of class II, HDACs.Citation15 HDAC inhibitors modify the acetylation of proteins thereby altering the function of histones as well as multiple non-nuclear proteins; altering protein structure and function, and gene transcription. Genes whose expression is increased by HDAC inhibitors include the death receptor and ligand CD95/FAS-L and toxic BH3 domain proteins.Citation16,Citation17 HDAC inhibitors also increase ROS levels in cells and promote autophagy.Citation17,Citation18 All of the above shifts in cell biology tend to pre-dispose tumor cells toward cell death in response to HDAC inhibitors. HDAC inhibitors have also been claimed to re-program tumor cells into a more stem-like biological state.Citation19 Importantly it has recently been shown that GBM patients receiving valproate have extended survival.Citation20 As salinomycin can increase cytosolic Na+ and Ca2+ levels into the toxic range it is of note that valproate is also a weak blocker of sodium and calcium channels, arguing that normal tissues may be protected against salinomycin toxicity by valproate.
We have studied whether clinically relevant HDAC inhibitors at clinically relevant doses (valproate, vorinostat) interact with low doses of salinomycin (≤200 nM) to kill primary human glioblastoma cells. We have found in vitro that low doses of salinomycin interact with valproate or vorinostat to kill multiple primary human GBM isolates. Isolates were killed regardless of whether they expressed PDGFRα, mutant active ERBB1, ERBB1 vIII, or lacked PTEN function. The combination killed ERBB2+ breast cancer cells, regardless of anoikis resistance. Cell killing was dependent on increased autophagy and required apoptotic and necrotic proteases. Primary human CNS cell types were not killed by the drug combination. These studies argue that low doses of salinomycin, delivered directly to the site of the tumor by catheter or a similar mechanism, could have therapeutic utility for recurrent glioblastoma patients.
Results
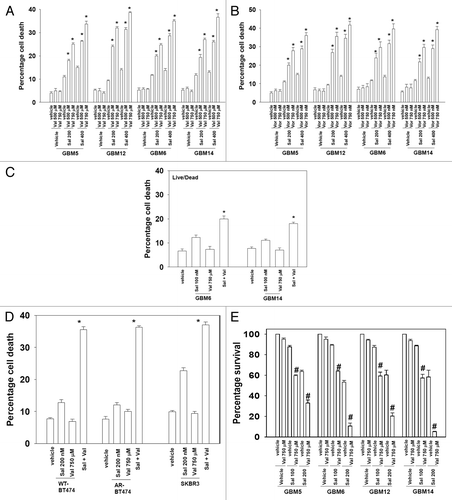
Initial studies examined the interaction of salinomycin with sodium valproate in multiple primary human glioma cells. In a dose-dependent fashion salinomycin and valproate interacted to kill multiple primary human GBM isolates regardless of whether they expressed PDGFRα, mutant active ERBB1, ERBB1 vIII, or lacked either p53 or PTEN function (). Similar data were obtained when vorinostat, a pan-HDAC inhibitor, was substituted for valproate (). Of particular note was that at single agent salinomycin concentrations at or below 200 nM no obvious changes were apparent in tumor cell membrane morphology or overall appearance (data not shown). Similar killing data with the drug combination were obtained using a live/dead assay kit and fluorescent microscopy (). Salinomycin and valproate killed breast cancer cells, including anoikis-resistant versions of these cells (). Non-transformed CNS cells were not killed by this drug combination (data not shown). In colony formation assays, salinomycin doses as low as 100 nM interacted with valproate to kill GBM cells with combination index values below 0.7 ().
Figure 1. Histone deacetylase inhibitors enhance salinomycin toxicity in multiple genetically diverse primary human GBM cells. (A) Primary human GBM cells (GBM5, overexpresses PDGFRA; GBM6 expresses EGFR vIII; GBM12 expresses mutant active EGFR; GBM14 lacks PTEN function), 24 h after plating were treated with vehicle (DMSO), sodium valproate (500 μM; 750 μM), salinomycin (200 nM; 400 nM), or the drugs combined. Cells were isolated 24 h after drug exposure. Cell viability was determined by trypan blue exclusion (n = 3, ± SEM). *P < 0.05 greater than corresponding vehicle control. (B) Primary human GBM cells, 24 h after plating were treated with vehicle (DMSO), vorinostat (500 nM; 750 nM), salinomycin (200 nM; 400 nM), or the drugs combined. Cells were isolated 24 h after drug exposure. Cell viability was determined by trypan blue exclusion (n = 3, ± SEM). *P < 0.05 greater than corresponding vehicle control. (C) GBM6 and GBM14 cells, 24 h after plating were treated with vehicle (DMSO), sodium valproate (750 μM), salinomycin (100 nM), or the drugs combined. Cells were isolated 24 h after drug exposure. Cell viability was determined in a Vector 3 plate reader using a live/dead assay kit (n = 3, ± SEM). *P < 0.05 greater than corresponding vehicle control. (D) Wild-type (WT) and anoikis-resistant (AR) BT474 and SKBR3 cells, 24 h after plating were treated with vehicle (DMSO), sodium valproate (750 μM), salinomycin (200 nM), or the drugs combined. Cells were isolated 24 h after drug exposure. Cell viability was determined by trypan blue exclusion (n = 3, ± SEM). *P < 0.05 greater than corresponding vehicle control. (E) GBM5/6/12/14 cells plated as single cells in sextuplicate and 12 h after plating were treated with vehicle (DMSO), sodium valproate (750 μM), salinomycin (100 nM; 200 nM), or the drugs combined. The media was changed 24 h later to drug free media and colonies permitted to form for the next ~10 d. Colonies were fixed, stained, and counted (>50 cells/colony). Percentage survival is defined based on the plating efficiency of vehicle treated cells (= 100%) (n = 3, ± SEM). #P < 0.05 less than corresponding cells not treated with salinomycin.
Salinomycin has been reported to increase LC3II levels in tumor stem cells and cause “autophagy”. In our system salinomycin increased LC3II processing and formation of LC3-GFP and LC3-RFP vesicles in cells in a time dependent fashion that could be blocked using the VPS34 inhibitor 3-methyl adenine (). Changes in LC3II processing by salinomycin, however, correlated with increased p62 levels. Valproate treatment reduced both LC3II and p62 levels and the number of LC3-GFP/RFP+ vesicles suggesting that valproate facilitated autophagic flux to occur more rapidly (). The induction of autophagy correlated with increased levels of caspase 3 cleavage. In parallel, it was noted that the small molecule inhibitors of autophagy (3MA), the pan-caspase inhibitor (zVAD), and the RIP1 inhibitor (necrostatin) all suppressed drug combination toxicity (). As cell death was correlating with both caspase 3 cleavage and a toxic form of autophagy we also examined cell killing in our system using DAPI staining to assess nuclear DNA fragmentation (). Salinomycin and valproate treatment increased the numbers of aberrant and disintegrated nuclei as judged by their size and morphology, but the appearance of “classic” apoptotic nuclear morphology was absent. Our data suggests a necro-apoptotic form of killing is taking place. In agreement for a role of autophagy in the cell killing process, molecular knock down of ATG5 or Beclin1 suppressed the induction of LC3-GFP vesicles as well as the toxic interaction between valproate and salinomycin (). Similar data to that using molecular tools were obtained using the drug chloroquine, that blocks autophagic vesicle fusion with acidic lysosomes (). Knockdown of Beclin 1 suppressed the lethal interaction between salinomycin and valproate in colony formation assays ().
Figure 2. Valproate enhances salinomycin toxicity through multiple mechanisms. (A) GBM5 cells were transfected with a plasmid to express LC3-GFP. Twenty-four hours after transfection cells were treated with vehicle or with 3-methyl adenine (3MA) (10 mM) followed 30 min later by vehicle (DMSO), sodium valproate (750 μM), salinomycin (100 nM), or the drugs combined. Cells were examined 12 h after drug exposure and the mean number of LC3-GFP punctae per cell were determined (n = 3, ± SEM). #P < 0.05 greater than salinomycin value. (B) GBM6 and GBM12 cells were transfected with a plasmid to express LC3-GFP-RFP. Twenty-four hours after transfection cells were treated with vehicle or with chloroquine (CQ) (25 μM) followed 30 min later by vehicle (DMSO) or sodium valproate (750 μM) and salinomycin (100 nM) combined. Cells were examined 12 h after drug exposure and the mean number of LC3-GFP/LC3-RFP punctae per cell were determined (n = 3, ± SEM). #P < 0.05 less than [sal + val] vehicle control value. (C) GBM5 cells were treated with vehicle or 3-methyl adenine (3MA, 10 mM); the pan-caspase inhibitor zVAD (50 μM) or the RIP-1 inhibitor necrostatin (10 μM) followed 30 min later by vehicle (DMSO) or sodium valproate (750 μM) and salinomycin (100 nM) combined. Cells were isolated 24h after drug exposure. Cell viability was determined by trypan blue exclusion (n = 3, ± SEM). #P < 0.05 less than corresponding vehicle treated; ##P < 0.05 less than corresponding 3MA value. Upper inset: vehicle (DMSO) and/or sodium valproate (750 μM) and/or salinomycin (100 nM)-treated cells were isolated after 12 h and immunoblotting performed to determine LC3I/II, p62, and cleaved caspase 3 levels. (D) GBM12 cells in chamber slides were treated with vehicle (DMSO), sodium valproate (750 μM), salinomycin (100 nM), or the drugs combined. Cells were fixed in place 18 h after drug treatment, and stained with DAPI. Representative images are shown of each condition (n = 3). (E) GBM5 cells were transfected with a plasmid to express LC3-GFP in parallel with scrambled siRNA (siSCR) or molecules to knock down expression of Beclin1 (siBeclin1) or ATG5 (siATG5). Twenty-four hours after transfection cells were treated with vehicle (DMSO), sodium valproate (750 μM), salinomycin (100 nM), or the drugs combined. Cells were examined 24 h after drug exposure and the mean number of LC3-GFP punctae per cell were determined (n = 3, ± SEM). #P < 0.05 less than salinomycin value. (F and G) GBM5 and GBM6 cells were transfected with scrambled siRNA (siSCR) or molecules to knock down expression of Beclin1 (siBeclin1) or ATG5 (siATG5). Twenty-four hours after transfection cells were treated with vehicle (DMSO), sodium valproate (750 μM), salinomycin (100 nM), or the drugs combined. Cells were isolated 24 h after drug exposure. Cell viability was determined by trypan blue exclusion (n = 3, ± SEM). #P < 0.05 less than corresponding siSCR treated. (H) GBM6 and GBM12 cells were treated with vehicle (PBS) or with chloroquine (25 μM) followed 30 min later by vehicle (DMSO), sodium valproate (750 μM), salinomycin (100 nM), or the drug combination. Cells were isolated 24 h after drug exposure. Cell viability was determined by trypan blue exclusion (n = 3, ± SEM). #P < 0.05 less than corresponding vehicle-treated. (I) GBM6 and GBM12 cells were transfected with either scrambled siRNA (siSCR) or an siRNA to knock down expression of Beclin 1 (siBeclin1). Twenty-four hours after transfection cells were re-plated as single cells in sextuplicate. Cells were permitted to adhere for 12 h after which time they were treated with vehicle, salinomycin (100 nM), valproate (750 μM), or the drugs in combination. The media was changed 24 h later to drug free media and colonies permitted to form for the next 7 d. Colonies were fixed, stained, and counted (>50 cells/colony). Percentage survival is defined based on the plating efficiency of vehicle treated cells (= 100%) (± SEM). *P < 0.05 greater than corresponding value in siSCR cells.
![Figure 2. Valproate enhances salinomycin toxicity through multiple mechanisms. (A) GBM5 cells were transfected with a plasmid to express LC3-GFP. Twenty-four hours after transfection cells were treated with vehicle or with 3-methyl adenine (3MA) (10 mM) followed 30 min later by vehicle (DMSO), sodium valproate (750 μM), salinomycin (100 nM), or the drugs combined. Cells were examined 12 h after drug exposure and the mean number of LC3-GFP punctae per cell were determined (n = 3, ± SEM). #P < 0.05 greater than salinomycin value. (B) GBM6 and GBM12 cells were transfected with a plasmid to express LC3-GFP-RFP. Twenty-four hours after transfection cells were treated with vehicle or with chloroquine (CQ) (25 μM) followed 30 min later by vehicle (DMSO) or sodium valproate (750 μM) and salinomycin (100 nM) combined. Cells were examined 12 h after drug exposure and the mean number of LC3-GFP/LC3-RFP punctae per cell were determined (n = 3, ± SEM). #P < 0.05 less than [sal + val] vehicle control value. (C) GBM5 cells were treated with vehicle or 3-methyl adenine (3MA, 10 mM); the pan-caspase inhibitor zVAD (50 μM) or the RIP-1 inhibitor necrostatin (10 μM) followed 30 min later by vehicle (DMSO) or sodium valproate (750 μM) and salinomycin (100 nM) combined. Cells were isolated 24h after drug exposure. Cell viability was determined by trypan blue exclusion (n = 3, ± SEM). #P < 0.05 less than corresponding vehicle treated; ##P < 0.05 less than corresponding 3MA value. Upper inset: vehicle (DMSO) and/or sodium valproate (750 μM) and/or salinomycin (100 nM)-treated cells were isolated after 12 h and immunoblotting performed to determine LC3I/II, p62, and cleaved caspase 3 levels. (D) GBM12 cells in chamber slides were treated with vehicle (DMSO), sodium valproate (750 μM), salinomycin (100 nM), or the drugs combined. Cells were fixed in place 18 h after drug treatment, and stained with DAPI. Representative images are shown of each condition (n = 3). (E) GBM5 cells were transfected with a plasmid to express LC3-GFP in parallel with scrambled siRNA (siSCR) or molecules to knock down expression of Beclin1 (siBeclin1) or ATG5 (siATG5). Twenty-four hours after transfection cells were treated with vehicle (DMSO), sodium valproate (750 μM), salinomycin (100 nM), or the drugs combined. Cells were examined 24 h after drug exposure and the mean number of LC3-GFP punctae per cell were determined (n = 3, ± SEM). #P < 0.05 less than salinomycin value. (F and G) GBM5 and GBM6 cells were transfected with scrambled siRNA (siSCR) or molecules to knock down expression of Beclin1 (siBeclin1) or ATG5 (siATG5). Twenty-four hours after transfection cells were treated with vehicle (DMSO), sodium valproate (750 μM), salinomycin (100 nM), or the drugs combined. Cells were isolated 24 h after drug exposure. Cell viability was determined by trypan blue exclusion (n = 3, ± SEM). #P < 0.05 less than corresponding siSCR treated. (H) GBM6 and GBM12 cells were treated with vehicle (PBS) or with chloroquine (25 μM) followed 30 min later by vehicle (DMSO), sodium valproate (750 μM), salinomycin (100 nM), or the drug combination. Cells were isolated 24 h after drug exposure. Cell viability was determined by trypan blue exclusion (n = 3, ± SEM). #P < 0.05 less than corresponding vehicle-treated. (I) GBM6 and GBM12 cells were transfected with either scrambled siRNA (siSCR) or an siRNA to knock down expression of Beclin 1 (siBeclin1). Twenty-four hours after transfection cells were re-plated as single cells in sextuplicate. Cells were permitted to adhere for 12 h after which time they were treated with vehicle, salinomycin (100 nM), valproate (750 μM), or the drugs in combination. The media was changed 24 h later to drug free media and colonies permitted to form for the next 7 d. Colonies were fixed, stained, and counted (>50 cells/colony). Percentage survival is defined based on the plating efficiency of vehicle treated cells (= 100%) (± SEM). *P < 0.05 greater than corresponding value in siSCR cells.](/cms/asset/aed76edb-cbdf-4283-ae4c-4d9c93f15d49/kcbt_a_10927309_f0002.gif)
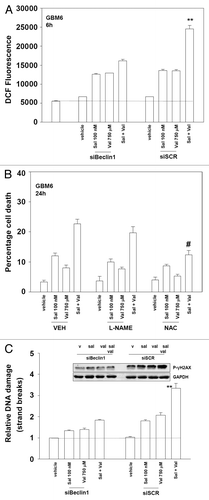
We next determined whether the drug combination altered the levels of reactive oxygen species (ROS) in GBM cells as well as the levels of DNA damage. ROS levels were enhanced by the drug combination that was reduced by inhibition of autophagy (). Suppression of ROS, but not reactive nitrogen species, reduced cell killing by salinomycin and valproate (). The drug combination enhanced DNA damage prior to the observation of cell death processes as judged in Comet assays and by γH2AX phosphorylation, which also was reduced by inhibition of autophagy (). Thus autophagy also regulates markers of cellular toxicity, i.e., ROS and DNA damage levels, upstream of any measured level of cell death.
Figure 3. Valproate enhances salinomycin toxicity through reactive oxygen species generation. (A) GBM6 cells were plated (2500 cells per well, 96-well dish in sextuplicate). Cells were transfected with scrambled siRNA (siSCR) or a molecule to knock down expression of Beclin1 (siBeclin1). Twenty-four hours after transfection cells were treated with vehicle (DMSO), sodium valproate (750 μM), salinomycin (100 nM), or the drugs combined. Six hours after treatment cells were loaded with DCFH2 and the generation of ROS determined over 10 min (n = 3, ± SEM). **P < 0.05 greater than corresponding value in siBeclin1 cells. (B) GBM6 cells were treated with vehicle or the RNS scavenger L-NAME (10 mM); or the ROS scavenger NAC (10 mM) followed 30 min later by vehicle (DMSO) or sodium valproate (750 μM) and salinomycin (100 nM) combined. Cells were isolated 24 h after drug exposure. Cell viability was determined by trypan blue exclusion (n = 3, ± SEM). #P < 0.05 less than corresponding vehicle-treated. (C) GBM6 cells plated in soft agar were transfected with scrambled siRNA (siSCR) or a molecule to knockdown expression of Beclin1 (siBeclin1). Twenty-four hours after transfection cells were treated with vehicle (DMSO), sodium valproate (750 μM), salinomycin (100 nM), or the drugs combined. Six h after treatment cells were subjected to COMET assay. The tail moments of >100 cells were graded (n = 3, ± SEM). **P < 0.05 greater than corresponding value in siBeclin1 cells. Upper Inset: Cells were transfected with scrambled siRNA (siSCR) or a molecule to knock down expression of Beclin1 (siBeclin1). Twenty-four hours after transfection cells were treated with vehicle (DMSO), sodium valproate (750 μM), salinomycin (100 nM), or the drugs combined. Six hours after treatment cells were isolated and immunoblotting performed to determine phosphorylated γ-H2AX levels.
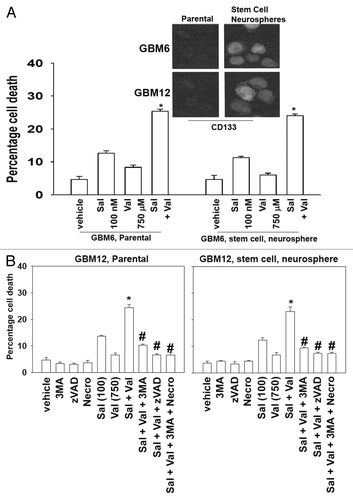
It has been claimed that salinomycin preferentially kills tumor stem cells compared with the bulk population of tumor cells, and that this property makes the antibiotic a potentially useful therapeutic agent.Citation4,Citation5 From our primary human GBM cells we developed two stem cell-like derived isolates of the GBM6 and the GBM12 lines that grew as neurospheres in suspension. GBM12-stem cells grew more robustly than GBM6-stem cells. These stem like isolates had higher basal cell surface expression of the putative stem cell marker CD133 (). Despite being selected for stem-ness and growing as neurospheres, neither GBM6-stem nor GBM12-stem cells were more effectively killed by salinomycin alone or combined salinomycin and valproate treatment than unselected tumor cells (). The cell death response of parental or stem cells to (salinomycin and valproate) treatment was blocked by 3MA, zVAD, and by necrostatin ().
Figure 4. Valproate enhances salinomycin toxicity in primary human GBM cells regardless of stem-ness. (A). GBM6 parental and GBM6 stem cell neurospheres were treated with vehicle (DMSO) and/or with sodium valproate (750 μM), and/or salinomycin (100 nM). Cells were isolated 24 h after drug exposure and viability was determined by trypan blue exclusion (n = 3, ± SEM). *P < 0.05 greater than corresponding vehicle control. Inset: GBM6 and GBM12 cells were fixed in place or cytospun onto slides. Cells were immunostained for CD133 (n = 3, representative). (n.b., CD133 is one of several claimed putative GBM stem cell markers; some other groups claim it is not a marker). (B) GBM12 cells were treated with vehicle or 3-methyl adenine (3MA, 10 mM); the pan-caspase inhibitor zVAD (50 μM), or the RIP-1 inhibitor necrostatin (10 μM) followed 30 min later by vehicle (DMSO) or sodium valproate (750 μM) and salinomycin (100 nM) combined. Cells were isolated 24 h after drug exposure. Cell viability was determined by trypan blue exclusion (n = 3, ± SEM). #P < 0.05 less than corresponding vehicle treated; *P < 0.05 greater than vehicle treated.
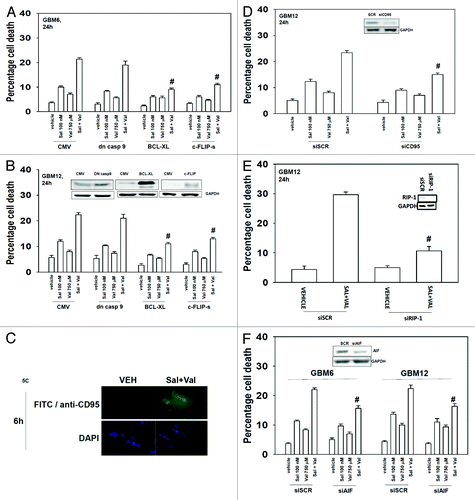
Expression of dominant negative caspase 9, to our surprise, was not particularly protective against drug combination lethality (). However, overexpression of the protective mitochondrial protein BCL-XL or the caspase 8 inhibitor c-FLIP-s did significantly suppress drug-induced killing. As c-FLIP-s is a caspase 8 inhibitor we next determined whether death receptors play a killing role in the drug combination. Drug combination treatment increased the cell surface expression of the death receptor CD95 (). Knock down of CD95 significantly reduced the toxicity of (salinomycin and valproate) treatment (). HDAC inhibitors are known in a variety of cell types to increase expression of CD95 and other proteins that predispose a tumor cell to undergoing cell death. As we were observing cell killing through an autophagic process downstream of CD95 we investigated whether the proteins RIP-1 and AIF played a role in killing. Knockdown of RIP-1 and to a lesser extent AIF suppressed drug combination toxicity ().
Figure 5. Valproate enhances salinomycin toxicity through CD95, caspase 8, and RIP-1. (A and B) GBM6 and GBM12 cells were infected with recombinant adenoviruses (50 moi): empty vector (CMV; to express: dominant negative caspase 9; BCL-XL; or c-FLIP-s. Twenty-four hours after infection cells were treated with vehicle (DMSO) and/or with sodium valproate (750 μM), and/or salinomycin (100 nM). Cells were isolated 24 h after drug exposure. Cell viability was determined by trypan blue exclusion (n = 3, ± SEM). #P < 0.05 less than corresponding vehicle treated. (C) GBM6 cells grown in chamber slides were treated with vehicle (DMSO) or with sodium valproate (750 μM), and salinomycin (100 nM). Cells were fixed 6 h after treatment and immunohistochemistry performed to determine CD95 cell surface levels (n = 3). (D) GBM6 cells were transfected with scrambled siRNA (siSCR) or a molecule to knock down expression of CD95 (siCD95). Twenty-four hours after transfection cells were treated with vehicle (DMSO), sodium valproate (750 μM), salinomycin (100 nM), or the drugs combined. Cells were isolated 24 h after drug exposure. Cell viability was determined by trypan blue exclusion (n = 3, ± SEM). #P < 0.05 less than corresponding siSCR-treated. (E) GBM12 cells were transfected with scrambled siRNA (siSCR) or a molecule to knock down expression of RIP-1 (siRIP-1). Twenty-four hours after transfection cells were treated with vehicle (DMSO) or sodium valproate (750 μM) and salinomycin (100 nM) combined. Cells were isolated 24 h after drug exposure. Cell viability was determined by trypan blue exclusion (n = 3, ± SEM). #P < 0.05 less than corresponding siSCR treated. (F) GBM6 and GBM12 cells were transfected with scrambled siRNA (siSCR) or a molecule to knock down expression of AIF (siAIF). Twenty-four hours after transfection cells were treated with vehicle (DMSO) and/or sodium valproate (750 μM) and/or salinomycin (100 nM). Cells were isolated 24 h after drug exposure. Cell viability was determined by trypan blue exclusion (n = 3, ± SEM). #P < 0.05 less than corresponding siSCR-treated.
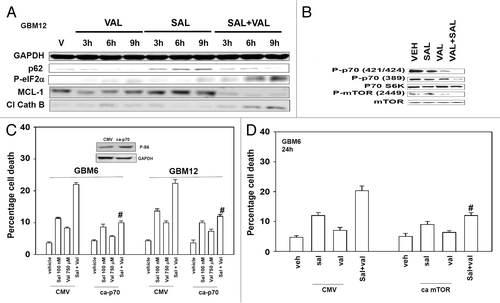
Finally, we determined whether the drug combination induced changes in cell signaling processes and the expression of apoptosis regulatory molecules. The drug combination inactivated ERK1/2 and modestly reduced AKT phosphorylation (, data not shown). Salinomycin increased p62 levels that were reduced in combination treated cells. The drug combination increased eIF2α phosphorylation that correlated with reduced MCL-1 expression and cleavage of cathepsin B. The drug combination also decreased the phosphorylation of p70 S6K and of mTOR (). Based on these findings, we expressed activated forms of mTOR and p70 S6K in GBM cells. Activated mTOR, to a greater extent than activated p70 S6K, protected GBM cells from (salinomycin and valproate) toxicity ().
Figure 6. The induction of autophagic flux correlates with cathepsin B cleavage, increased P-eIF2α phosphorylation, and reduced MCL-1 expression. (A) GBM12 cells were treated with vehicle (DMSO) or with sodium valproate (750 μM), and/or salinomycin (100 nM). Cells were isolated 3, 6, and 9 h after drug exposure and protein expression determined by SDS PAGE and immunoblotting against the indicated proteins. (B) GBM6 cells were treated with vehicle (DMSO) or with sodium valproate (750 μM), and/or salinomycin (100 nM). Cells were isolated 12 h after drug exposure and protein expression determined by SDS PAGE and immunoblotting against the indicated proteins. (C) GBM6 and GBM12 cells were transfected with empty vector plasmid (CMV) or a plasmid to express activated p70S6K (ca-p70). Twenty-four hours after transfection cells were treated with vehicle (DMSO) and/or sodium valproate (750 μM) and/or salinomycin (100 nM). Cells were isolated 24 h after drug exposure. Cell viability was determined by trypan blue exclusion (n = 3, ± SEM). #P < 0.05 less than corresponding CMV-treated. (D) GBM6 and GBM12 cells were transfected with empty vector plasmid (CMV) or a plasmid to express activated mTOR (ca-mTOR). Twenty-four hours after transfection cells were treated with vehicle (DMSO) or sodium valproate (750 μM) and salinomycin (100 nM) combined. Cells were isolated 24 h after drug exposure. Cell viability was determined by trypan blue exclusion (n = 3, ± SEM). #P < 0.05 less than corresponding CMV treated.
Discussion
Salinomycin has been proposed to kill the “difficult to treat” tumor stem cell population within a tumor, however, little progress has been made with clinical translation of this agent due to high systemic toxicity in mammals. The present studies were designed to determine whether a more tissue localized tumor type, glioblastoma multiforme, was sensitive to low concentrations of salinomycin and to define, using standard of care agents, whether salinomycin toxicity could be enhanced in this tumor cell type.
We discovered that salinomycin killed, to a modest extent, primary human GBM cells in the low (~100–200 nM) concentration range without any apparent gross changes in tumor cell plasma membrane morphology. Stem cell isolates of these GBM cells were killed as effectively as parental GBM cells. The toxicity of salinomycin was enhanced in a synergistic fashion by HDAC inhibitors, sodium valproate or vorinostat. Mechanisms of interaction between salinomycin and HDAC inhibitors were found to be increased expression of, and activation of, the death receptor CD95, reduced expression of protective mitochondrial proteins such as MCL-1, and enhanced autophagic flux. Cell killing by the drug combination occurred through both apoptotic pathways, viz. the noted protective effect of the pan-caspase inhibitor zVAD and overexpression of BCL-XL, and through necro-apoptotic pathways, viz. RIP-1, AIF, autophagy, cathepsin B cleavage. Further studies beyond the scope of the present manuscript will be required to fully dissect the molecular mechanisms downstream of CD95 and the mitochondria by which salinomycin and HDAC inhibitors synergize to kill.
The induction of autophagy by a variety of chemical agents has been noted by many investigators in the last 5–10 y. Many of these studies have not determined whether changes in autophagic flux have occurred or whether only changes in the relative number of autophagosomes has been stimulated. Thus some studies have attributed elevated numbers of LC3-GFP vesicles as a protective effect against drug toxicity whereas others have argued that this observation correlates with enhanced cell killing. We discovered that salinomycin increased the levels of LC3-GFP vesicles but also increased protein levels of processed LC3II and p62. This could argue that salinomycin stimulated formation of autophagosomes but did not permit fusion of these vesicles with acidic endosomes to allow protein digestion. However, use of chloroquine, which blocks autophagosome fusion with acidic lysosomes reduced killing demonstrating that stalled autophagy was not a killing mechanism. Treatment of salinomycin-treated cells with valproate reduced the numbers of LC3-GFP vesicles that correlated with reduced protein levels of LC3II and of p62, suggesting that valproate facilitated autophagic flux or that valproate caused rupture of the autophagosome with release of its contents into the cell; in both instances this could lead to inappropriate release of toxic proteases into the cytosol where they would act to promote cell death. Further detailed studies will be required to fully understand the mechanisms by which valproate interacts with the salinomycin-induced autophagy process.
Prior studies by this group have shown that HDAC inhibitors can enhance the expression of toxic BH3 domain proteins as well as the death receptor CD95 and its ligand FAS-L.Citation21,Citation22 We have also shown that HDAC inhibitors can facilitate the tyrosine phosphorylation of CD95 thereby promoting its ligand independent activation.Citation23 The mechanisms by which CD95 tyrosine phosphorylation can be increased include elevated levels of ROS, which is in agreement with our data showing that drug combination killing correlated with increased ROS and that quenching of ROS was protective. Autophagy also impacted on ROS levels and the generation of DNA strand breaks in our system. We found that increased autophagy correlated with increased ROS and increased DNA damage; as autophagy was part of the toxic killing process we again concluded that quenching of ROS was protective. Further studies will be required to define the molecular mechanisms by which salinomycin and HDAC inhibitors control ROS generation, and how ROS generation regulates CD95 in our system.
ER stress/the unfolded protein response is a conserved mechanism to prevent protein overload in tumor cells. In one arm of the ER stress response the protein eIF2α becomes phosphorylated thereby suppressing protein translation. Reduced production of proteins reduces overall protein expression and is most obviously observed in proteins that have short half-lives, such as MCL-1. Treatment with the drug combination of salinomycin and HDAC inhibitors increased eIF2α phosphorylation and decreased MCL-1 levels. Overexpression of the related mitochondrial protective protein BCL-XL protected cells from the drug combination. How the drug combination promotes eIF2α phosphorylation e.g., inhibition of GRP78 and/or activation of PKR/PERK, will be the subject of future studies.
Treatment with salinomycin and HDAC inhibitors caused a necro-apoptotic form of cell killing as judged by the partial requirements of RIP-1 and AIF for killing, as well as the observation of cathepsin B cleavage. However, killing also clearly required the actions of caspase 8 as judged by the protective effect of c-FLIP-s, the pan-caspase inhibitor zVAD was protective, and cleavage of pro-caspase 3 was noted. Killing also required the actions of the death receptor CD95 and it is well known that RIP-1 activity can be controlled by CD95.Citation24 Our data also tend to suggest that both death receptor signaling, and as judged by the protective effect of BCL-XL overexpression, mitochondrial dysfunction collectively regulate the death response. Further studies will be required to understand the regulation of CD95/caspase pathways and their interactions with CD95/autophagy/cathepsin/AIF pathways in GBM cells.
Chemotherapeutic drug treatments are known to alter the activities of multiple cell signaling pathways. Treatment with salinomycin and HDAC inhibitors caused decreased mTOR/p70 S6K activity and expression of activated mTOR or p70 S6K was protective. The possible action of activated mTOR may be to suppress autophagy, which is a toxic process in this system. In the case of p70 S6K it is possible that phosphorylation of proteins such as BAD and BIM could be altered which will lead to additional mitochondrial dysfunction.
Salinomycin is widely used as a food additive within the poultry industry. Unfortunately salinomycin when administered systemically to humans, dogs, cats, cows, and pigs has significant lethal morbidity issues associated with rhabdomyolysis of cardiac and skeletal muscle. Residual levels of salinomycin have been found in chicken eggs arguing that understanding the biology of low salinomycin doses may have importance beyond the oncology field.
Collectively, our data argue that salinomycin and HDAC inhibitors represent a novel drug combination which utilizes multiple modes of killing to cause a form of necro-apoptosis in primary human GBM cells. Further studies will be required to determine whether this drug combination is effective in vivo without causing significant normal toxicity issues.
Materials and Methods
Materials
Phospho-/total antibodies were purchased from Cell Signaling Technologies and Santa Cruz Biotech. Drugs were purchased from Selleckchem; Sigma-Aldrich. Commercially available validated short hairpin RNA molecules to knock down RNA/protein levels were from Qiagen. Antibody reagents, other kinase inhibitors, caspase inhibitors cell culture reagents, and non-commercial recombinant adenoviruses have been previously described.Citation21-Citation23,Citation25-Citation28
Methods
Cell culture and in vitro exposure of cells to drugs
Primary human GBM cells were cultured at 37 °C (5% (v/v CO2) in vitro using RPMI supplemented with 2% (v/v) fetal calf serum and 10% (v/v) non-essential amino acids, then at 37 °C (5% [v/v] CO2) in vitro using RPMI supplemented with 5% (v/v) fetal calf serum and 10% (v/v) non-essential amino acids. For short-term cell killing assays and immunoblotting, cells were plated at a density of 3 × 10³ per cm2 and 24 h after plating were treated with various drugs, as indicated. In vitro small molecule drug treatments were from a 100 mM stock solution of each drug and the maximal concentration of vehicle (DMSO) in media was 0.02% (v/v). Cells were not cultured in reduced serum media during any study.
Cell treatments, SDS-PAGE, and western blot analysis
Cells were treated with various drug concentrations, as indicated in the figure legends. SDS PAGE and immunoblotting was performed as described in references Citation21–Citation23 and Citation25–Citation28.
Recombinant adenoviral vectors; infection in vitro
We generated and purchased previously noted recombinant adenoviruses as per references Citation21–Citation23 and Citation25–Citation28. Cells were infected with these adenoviruses at an approximate m.o.i. as indicated in the figure and legend. Cells were incubated for 24 h to ensure adequate expression of transduced gene products prior to drug exposures.
Analysis of ROS levels
ROS levels were determined in a vector 3 plate reader (PerkinElmer Life and Analytical Sciences). In brief, cancer cells were plated in 96-well plates. 2,7-Dichlorodihydro-fluorescein diacetate, which is non-fluorescent in its dihydro form but becomes highly fluorescent upon reaction with ROS to 2,7-dichlorofluorescin, was used to monitor production of cellular ROS. Cells were pre-incubated with dichlorodihydro-fluorescein diacetate (5 mmol/dm3 for 10 min; Invitrogen). Fluorescence measurements were obtained 0 to 10 min after drug addition with a vector 3 plate reader. Data are presented corrected for basal fluorescence of vehicle-treated cells at each time point.
Detection of cell death by trypan blue, Hoechst, TUNEL, and flow cytometric assays
Cells were harvested by trypsinization with Trypsin/EDTA for ~10 min at 37 °C. Cell death assays were performed as described in refs. Citation21–Citation23 and Citation25–Citation28.
Assessment of autophagy
Cells were transfected with a plasmid to express a green fluorescent protein (GFP) tagged form of LC3 (ATG8). For analysis of cells transfected with the GFP-LC3 construct, the GFP-LC3-positive vesicularized cells were examined under the 40× objective of a Zeiss Axiovert fluorescent microscope.
Alkaline and neutral single cell gel electrophoresis assay
The comet assay was performed as in reference Citation29. Essentially, 85 μl molten agarose in PBS was dropped on to a microscope slide pre-coated with 1% agarose, covered with a 18 × 18 mm No.1 glass coverslip and placed on ice to allow the agarose to set. The coverslip was then removed. Following appropriate treatment, 5 µl of the sample of cells (5 × 10⁴ cells) was mixed with 85 μl of 1% low melting agarose and immediately pipetted onto the layer of 1% agarose on the microscope slide. The coverslip was replaced and the slide placed on ice to allow the agarose to set. The coverslip was then removed and the slide immersed in 150 ml of ice cold lysis buffer (2.5 M sodium chloride, 85 mM EDTA, 10 mM Trizma base and adjusted to pH 10 with sodium hydroxide pellets), containing 1% Triton-X 100 (v/v) and 10% DMSO (v/v). The cells were incubated in the lysis buffer at 4 °C for 60 min. All steps following the lysis procedure were performed under dim light conditions. On removal from the lysis buffer, slides were incubated in the electrophoresis buffer (containing 0.3 M sodium hydroxide and 1 mM EDTA, for 20 min prior to electrophoresis at 20 V/32 mA for 24 min. The 20 min pre-incubation period prior to electrophoresis allows the alkaline pH of the electrophoresis buffer to destroy the remains of the chromatin structure and allow the DNA to “uncoil”. Following electrophoresis the slides were transferred to an absorbent surface and washed three times with neutralizing buffer, (100 mM Trizma base, pH 7.5). Remaining nucleoids and any extra-cellular DNA were stained using 10 μl of a 50 μg/ml stock solution of the fluorescent stain, ethidium bromide. A coverslip was immediately replaced and the slides were analyzed immediately or stored overnight in humidified atmosphere at 4 °C.
The nucleiods were analyzed microscopically using a manual scoring system ranging from 1 to 5, with 1 representing undamaged cells and 5 representing severe damage as demonstrated in reference Citation30. One hundred cells/slide or experimental point were analyzed, with damage detection varying from 100 to 500. Experimental results were divided by vehicle control values in each experiment to produce relative values for comparison between individual experiments.
Plasmid transfection
Plasmids
Cells were plated as described above and 24 h after plating, transfected. Plasmids (0.5 μg) expressing a specific mRNA or appropriate vector control plasmid DNA was diluted in 50 μl serum-free and antibiotic-free medium (1 portion for each sample). Concurrently, 2 μl Lipofectamine 2000 (Invitrogen), was diluted into 50 μl of serum-free and antibiotic-free medium. Diluted DNA was added to the diluted Lipofectamine 2000 for each sample and incubated at room temperature for 30 min. This mixture was added to each well/dish of cells containing 200 μl serum-free and antibiotic-free medium for a total volume of 300 μl and the cells were incubated for 4 h at 37 °C. An equal volume of 2× medium was then added to each well. Cells were incubated for 48 h, then treated with drugs. To assess transfection efficiency of plasmids we used a plasmid to express GFP and defined the percentage of cells being infected as the percentage of GFP+ cells. For all cell lines the infection efficiency was >70%.
siRNA
Cells were plated in 60 mm dishes from a fresh culture growing in log phase as described above, and 24 h after plating transfected. Prior to transfection, the medium was aspirated and 1 ml serum-free medium was added to each plate. For transfection, 10 nM of the annealed siRNA, the positive sense control doubled stranded siRNA targeting GAPDH or the negative control (a “scrambled” sequence with no significant homology to any known gene sequences from mouse, rat, or human cell lines) were used (predominantly Qiagen; occasional alternate siRNA molecules were purchased from Ambion, Inc.). Ten nanomolar siRNA (scrambled or experimental) was diluted in serum-free media. Four microliters Hiperfect (Qiagen) was added to this mixture and the solution was mixed by pipetting up and down several times. This solution was incubated at room temp for 10 min, then added drop-wise to each dish. The medium in each dish was swirled gently to mix, then incubated at 37 °C for 2 h. One milliliter of 10% (v/v) serum-containing medium was added to each plate, and cells were incubated at 37 °C for 24–48 h before re-plating (50 × 103 cells each) onto 12-well plates. Cells were allowed to attach overnight, then treated with drugs (0–48 h). Trypan blue exclusion assays, SDS PAGE/immunoblotting analyses and colony formation assays were then performed at the indicated time points.
Data analysis
Comparison of the effects of various treatments was performed using one way analysis of variance and a the two-tailed Student t test. Differences with a P value of <0.05 were considered statistically significant. Experiments shown are the means of multiple individual points from multiple experiments (± SEM).
| Abbreviations: | ||
| ERK | = | extracellular regulated kinase |
| MEK | = | mitogen activated extracellular regulated kinase |
| PI3K | = | phosphatidyl inositol 3 kinase |
| MAPK/ERK | = | mitogen activated protein kinase |
| ca | = | constitutively active |
| dn | = | dominant negative |
| CMV | = | empty vector plasmid or virus |
| si | = | small interfering |
| SCR | = | scrambled |
| Ad | = | adenovirus |
| VEH | = | vehicle |
| VAL | = | valproate |
| VOR | = | vorinostat |
| SAL | = | salinomycin |
| CQ | = | chloroquine |
| GFP | = | green fluorescent protein |
| RFP | = | red fluorescent protein |
Disclosure of Potential Conflicts of Interest
No potential conflicts of interest were disclosed.
Acknowledgments
Support for the present study was provided; from PHS grants (R01-DK52825; R01-CA141703; R01-CA150214), The Jim Valvano “V” foundation, and Department of Defense Award (W81XWH-10-1-0009). Thanks to Mrs Grizzard for her support of this research manuscript. P Dent is The Universal Inc. Professor in Signal Transduction Research.
References
- Field KM, Rosenthal MA, Yilmaz M, Tacey M, Drummond K. Comparison between poor and long-term survivors with glioblastoma: Review of an Australian dataset. Asia Pac J Clin Oncol 2013; Forthcoming http://dx.doi.org/10.1111/ajco.12076; PMID: 23701649
- Juratli TA, Schackert G, Krex D. Current status of local therapy in malignant gliomas--a clinical review of three selected approaches. Pharmacol Ther 2013; 139:341 - 58; http://dx.doi.org/10.1016/j.pharmthera.2013.05.003; PMID: 23694764
- Jiang C, Wang H, Kang Q, Liu J, Bai L. Cloning and characterization of the polyether salinomycin biosynthesis gene cluster of Streptomyces albus XM211. Appl Environ Microbiol 2012; 78:994 - 1003; http://dx.doi.org/10.1128/AEM.06701-11; PMID: 22156425
- Gupta PB, Onder TT, Jiang G, Tao K, Kuperwasser C, Weinberg RA, Lander ES. Identification of selective inhibitors of cancer stem cells by high-throughput screening. Cell 2009; 138:645 - 59; http://dx.doi.org/10.1016/j.cell.2009.06.034; PMID: 19682730
- Dong TT, Zhou HM, Wang LL, Feng B, Lv B, Zheng MH. Salinomycin selectively targets ‘CD133+’ cell subpopulations and decreases malignant traits in colorectal cancer lines. Ann Surg Oncol 2011; 18:1797 - 804; http://dx.doi.org/10.1245/s10434-011-1561-2; PMID: 21267784
- Rollinson J, Taylor FG, Chesney J. Salinomycin poisoning in horses. Vet Rec 1987; 121:126 - 8; http://dx.doi.org/10.1136/vr.121.6.126; PMID: 3672848
- Oehme FW, Pickrell JA. An analysis of the chronic oral toxicity of polyether ionophore antibiotics in animals. Vet Hum Toxicol 1999; 41:251 - 7; PMID: 10434384
- Boehmerle W, Endres M. Salinomycin induces calpain and cytochrome c-mediated neuronal cell death. Cell Death Dis 2011; 2:e168; http://dx.doi.org/10.1038/cddis.2011.46; PMID: 21633391
- Szkudlarek-Mikho M, Saunders RA, Yap SF, Ngeow YF, Chin KV. Salinomycin, a polyether ionophoric antibiotic, inhibits adipogenesis. Biochem Biophys Res Commun 2012; 428:487 - 93; http://dx.doi.org/10.1016/j.bbrc.2012.10.080; PMID: 23123626
- Lattanzio FA Jr., Pressman BC. Alterations in intracellular calcium activity and contractility of isolated perfused rabbit hearts by ionophores and adrenergic agents. Biochem Biophys Res Commun 1986; 139:816 - 21; http://dx.doi.org/10.1016/S0006-291X(86)80063-8; PMID: 3767987
- Kim KY, Yu SN, Lee SY, Chun SS, Choi YL, Park YM, Song CS, Chatterjee B, Ahn SC. Salinomycin-induced apoptosis of human prostate cancer cells due to accumulated reactive oxygen species and mitochondrial membrane depolarization. Biochem Biophys Res Commun 2011; 413:80 - 6; http://dx.doi.org/10.1016/j.bbrc.2011.08.054; PMID: 21871443
- Verdoodt B, Vogt M, Schmitz I, Liffers ST, Tannapfel A, Mirmohammadsadegh A. Salinomycin induces autophagy in colon and breast cancer cells with concomitant generation of reactive oxygen species. PLoS One 2012; 7:e44132; http://dx.doi.org/10.1371/journal.pone.0044132; PMID: 23028492
- Jangamreddy JR, Ghavami S, Grabarek J, Kratz G, Wiechec E, Fredriksson BA, Rao Pariti RK, Cieślar-Pobuda A, Panigrahi S, Łos MJ. Salinomycin induces activation of autophagy, mitophagy and affects mitochondrial polarity: differences between primary and cancer cells. Biochim Biophys Acta 2013; 1833:2057 - 69; http://dx.doi.org/10.1016/j.bbamcr.2013.04.011; PMID: 23639289
- Michaelis M, Doerr HW, Cinatl J Jr.. Valproic acid as anti-cancer drug. Curr Pharm Des 2007; 13:3378 - 93; http://dx.doi.org/10.2174/138161207782360528; PMID: 18045192
- Atadja PW. HDAC inhibitors and cancer therapy. Prog Drug Res 2011; 67:175 - 95; PMID: 21141730
- Barbone D, Cheung P, Battula S, Busacca S, Gray SG, Longley DB, Bueno R, Sugarbaker DJ, Fennell DA, Broaddus VC. Vorinostat eliminates multicellular resistance of mesothelioma 3D spheroids via restoration of Noxa expression. PLoS One 2012; 7:e52753; http://dx.doi.org/10.1371/journal.pone.0052753; PMID: 23300762
- Premkumar DR, Jane EP, Agostino NR, DiDomenico JD, Pollack IF. Bortezomib-induced sensitization of malignant human glioma cells to vorinostat-induced apoptosis depends on reactive oxygen species production, mitochondrial dysfunction, Noxa upregulation, Mcl-1 cleavage, and DNA damage. Mol Carcinog 2013; 52:118 - 33; http://dx.doi.org/10.1002/mc.21835; PMID: 22086447
- Shubassi G, Robert T, Vanoli F, Minucci S, Foiani M. Acetylation: a novel link between double-strand break repair and autophagy. Cancer Res 2012; 72:1332 - 5; http://dx.doi.org/10.1158/0008-5472.CAN-11-3172; PMID: 22422989
- Jeong SG, Ohn T, Kim SH, Cho GW. Valproic acid promotes neuronal differentiation by induction of neuroprogenitors in human bone-marrow mesenchymal stromal cells. Neurosci Lett 2013; 554:22 - 7; http://dx.doi.org/10.1016/j.neulet.2013.08.059; PMID: 24021810
- Guthrie GD, Eljamel S. Impact of particular antiepileptic drugs on the survival of patients with glioblastoma multiforme. J Neurosurg 2013; 118:859 - 65; http://dx.doi.org/10.3171/2012.10.JNS12169; PMID: 23176328
- Cruickshanks N, Hamed HA, Booth L, Tavallai S, Syed J, Sajithlal GB, Grant S, Poklepovic A, Dent P. Histone deacetylase inhibitors restore toxic BH3 domain protein expression in anoikis-resistant mammary and brain cancer stem cells, thereby enhancing the response to anti-ERBB1/ERBB2 therapy. Cancer Biol Ther 2013; 14:982 - 96; http://dx.doi.org/10.4161/cbt.26234; PMID: 24025251
- Tang Y, Yacoub A, Hamed HA, Poklepovic A, Tye G, Grant S, Dent P. Sorafenib and HDAC inhibitors synergize to kill CNS tumor cells. Cancer Biol Ther 2012; 13:567 - 74; http://dx.doi.org/10.4161/cbt.19771; PMID: 22406992
- Park MA, Reinehr R, Häussinger D, Voelkel-Johnson C, Ogretmen B, Yacoub A, Grant S, Dent P. Sorafenib activates CD95 and promotes autophagy and cell death via Src family kinases in gastrointestinal tumor cells. Mol Cancer Ther 2010; 9:2220 - 31; http://dx.doi.org/10.1158/1535-7163.MCT-10-0274; PMID: 20682655
- Geserick P, Hupe M, Moulin M, Wong WW, Feoktistova M, Kellert B, Gollnick H, Silke J, Leverkus M. Cellular IAPs inhibit a cryptic CD95-induced cell death by limiting RIP1 kinase recruitment. J Cell Biol 2009; 187:1037 - 54; http://dx.doi.org/10.1083/jcb.200904158; PMID: 20038679
- Booth L, Cruickshanks N, Ridder T, Dai Y, Grant S, Dent P. PARP and CHK inhibitors interact to cause DNA damage and cell death in mammary carcinoma cells. Cancer Biol Ther 2013; 14:458 - 65; http://dx.doi.org/10.4161/cbt.24424; PMID: 23917378
- Sajithlal GB, Hamed HA, Cruickshanks N, Booth L, Tavallai S, Syed J, Grant S, Poklepovic A, Dent P. Sorafenib/regorafenib and phosphatidyl inositol 3 kinase/thymoma viral proto-oncogene inhibition interact to kill tumor cells. Mol Pharmacol 2013; 84:562 - 71; http://dx.doi.org/10.1124/mol.113.088005; PMID: 23877009
- Hamed HA, Yacoub A, Park MA, Archer K, Das SK, Sarkar D, Grant S, Fisher PB, Dent P. Histone deacetylase inhibitors interact with melanoma differentiation associated-7/interleukin-24 to kill primary human glioblastoma cells. Mol Pharmacol 2013; 84:171 - 81; http://dx.doi.org/10.1124/mol.113.086553; PMID: 23661648
- Bareford MD, Hamed HA, Allegood J, Cruickshanks N, Poklepovic A, Park MA, Ogretmen B, Spiegel S, Grant S, Dent P. Sorafenib and pemetrexed toxicity in cancer cells is mediated via SRC-ERK signaling. Cancer Biol Ther 2012; 13:793 - 803; http://dx.doi.org/10.4161/cbt.20562; PMID: 22673740
- Rojas E, Lopez MC, Valverde M. Single cell gel electrophoresis assay: methodology and applications. J Chromatogr B Biomed Sci Appl 1999; 722:225 - 54; http://dx.doi.org/10.1016/S0378-4347(98)00313-2; PMID: 10068143
- Kobayashi H, Sugiyama C, Morikawa Y, Hayashi M, Sofuni T. MMS Commun 1995; 3:103 - 15