 ?Mathematical formulae have been encoded as MathML and are displayed in this HTML version using MathJax in order to improve their display. Uncheck the box to turn MathJax off. This feature requires Javascript. Click on a formula to zoom.
Abstract
TRA-8, a monoclonal antibody targeting death receptor, has demonstrated high therapeutic effect for triple negative breast cancer (TNBC) in preclinical models. Tamoxifen, the standard of care for ERα-positive breast cancer, induces apoptosis via ERβ, which commonly presents in TNBC cells. The current study investigates the combination effects of TRA-8 and tamoxifen for TNBC. In vitro assays were implemented with two ERβ-positive TNBC cell lines, SUM159 and 2LMP, and in vivo therapy studies were followed using orthotopic breast tumor mouse models. IC50 of tamoxifen for SUM159 and 2LMP were 29 μM and 38 μM, respectively. Synergy between TRA-8 (0–1000 ng/mL) and tamoxifen (20 μM) was observed for both the cell lines. Tamoxifen (400 mg/kg diet) markedly suppressed the growth of SUM159 tumors for 6 weeks after therapy initiation, but it did not induce antitumor effect for 2LMP tumors. TRA-8 (0.1 mg, weekly, i.p.) successfully arrested the growth of both SUM159 and 2LMP tumors during therapy, but an antagonistic effect was observed when tamoxifen was combined. TRA-8 uptake into tumors was not changed by tamoxifen treatment. Histological analysis confirmed that caspase-3 activation induced by TRA-8 was significantly decreased when tamoxifen was used in combination. In conclusion, our findings suggest that the combined use of TRA-8 and tamoxifen may cause antagonistic effects for TNBC patients.
Introduction
TRA-8 is a monomeric monoclonal antibody targeting death receptor 5 (DR5) to induce apoptosis.Citation1 DR5 is substantially expressed in most cancer cells, but to a lesser extent in normal cells, so a selective killing of cancer cells is produced by TRA-8 without severe adverse side effects. Death-receptor targeted therapy is particularly effective for triple negative (ERα/PR/Her2 negative) breast cancer (TNBC).Citation2 High anti-tumor efficacy of TRA-8 alone or in combination with various chemotherapies has been demonstrated with TNBC xenogeneic solid-tumor models.Citation3,Citation4 A high likelihood of pathologic complete response (pCR) has been noticed in TNBC following conventional chemotherapy,Citation5 and pCR has been associated with favorable clinical outcomes.Citation6 However, when pCR was not achieved, high recurrence rate was also observed in TNBC patients.Citation6 TRA-8 may leverage the conventional therapeutic modalities to improve pCR rate. Since tigatuzumab (humanized TRA-8) has a long plasma half-life (6–10 d),Citation7 it may also be useful to kill residual and/or circulating cancer cells after surgery.
Tamoxifen is the standard of care for estrogen receptor (ER) positive breast cancer in both neoadjuvant and adjuvant settings.Citation8,Citation9 Two distinguished estrogen receptors, ERα and ERβ, have been identified,Citation10-Citation12 and tamoxifen was perceived as an antagonist targeting ERα to suppress cell proliferation.Citation13 ERβ has been detected in the majority of ERα-negative breast cancer cells, and is associated with good prognosis in TNBC.Citation14-Citation16 Tamoxifen may function as an antagonist for ERβ, raising the density of reactive oxygen species (ROS) in cells,Citation17 and excessive cellular concentration of ROS may result in apoptosis.Citation18 The magnitude of ERβ expression was positively correlated with survival of ERα-negative breast cancer patients following adjuvant tamoxifen therapy.Citation19 Tamoxifen might be readily utilized in combination with TRA-8 for improved treatment since both agents have presented minimal toxicity.Citation7,Citation20
The distribution pattern of TRA-8/DR5 in the cluster might be utilized as a predictive biomarker of treatment with TRA-8 alone or in combination with tamoxifen for TNBC patients. Cellular resistance to TRA-8 was not primarily engaged with either the level of DR5 expression or TRA-8 delivery to target cells,Citation21 but with the degree of TRA-8/DR5 oligomerization.Citation22-Citation24 TRA-8 binding to DR5 induces clustering (oligomerization) of TRA-8/DR5 on the cell membrane, and the TRA-8/DR5 oligomerization is an essential process to trigger apoptosis; the importance of Fas oligomerization for apoptosis induction was validated,Citation23,Citation25 and it was also demonstrated that DR5 aggregation triggered by TRAIL (tumor necrosis factor-related apoptosis-inducing ligand) was essential to drive intracellular signals for death.Citation26,Citation27 We recently demonstrated that TRA-8 sensitivity in pancreatic cancer cells was correlated with the local concentration of TRA-8/DR5 clustering.Citation28
The primary goal of this study was to evaluate the combination therapy with TRA-8 and tamoxifen for TNBC. The secondary goal was to assess the pattern of TRA-8/DR5 oligomerization as an indicator of effective TRA-8 monotherapy or in combination with tamoxifen for TNBC. Therapeutic response was measured in both in vitro and in vivo setups using ERβ-positive TNBC cell lines. In addition to the conventional therapeutic assessment based on tumor size monitoring, diffusion-weighted imaging (DWI) was applied to measure apoptosis in tumors responding to the therapies in vivo, and histological analysis was used to verify the findings. In the early phase of apoptosis, an apoptotic volume decrease (AVD) occurs leading to an increase of extracellular water molecules, which can be quantitated by DWI as apparent diffusion coefficient (ADC). DWI has been used to detect in vivo tumor response to TRA-8 in preclinical studies.Citation29,Citation30
Results
Tamoxifen shows synergy with TRA-8 in in vitro cytotoxicity assays
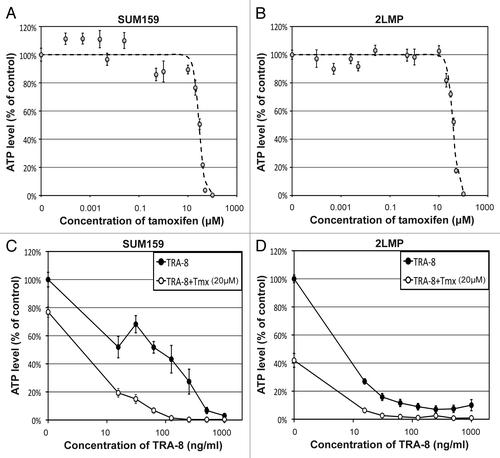
ERβ expression in TNBC cell lines was verified by western blot (). The western blot band intensities of ERβ relative to those of β-actin (control) in 4 TNBC cell lines (MDA-MB-231, SUM159, SUM149, and 2LMP) were 0.60, 0.78, 0.53, and 1.16, respectively. The IC50 of tamoxifen for SUM159 and 2LMP cells were 29 μM and 38 μM, respectively (). TRA-8 showed high killing efficacy for both cell lines, and tamoxifen (20 μM) improved the killing efficacy of TRA-8 at each concentration from 63% to 95% for SUM159 cells, and from 77% to 91% for 2LMP cells ().
Figure 1. Validation of ERα and ERβ expressions in TNBC cell lines (MDA-MB-231, SUM159, SUM149, and 2LMP) and ERα-positive breast cancer cell lines (T47D and MCF7) by western blot analysis using antibody against ERα or ERβ. Beta-actin was used as loading control.
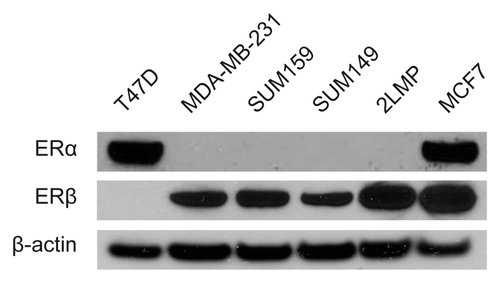
Figure 2. In vitro cytotoxicity assays of tamoxifen and/or TRA-8. In vitro ATP lite assay (mean and SE) to measure killing of (A and C) SUM159 or (B and D) 2LMP cells at increasing concentrations of (A and B) tamoxifen (0–100 μM) or (C and D) TRA-8 (0–1000 ng/mL) with/without tamoxifen (20 μM). The best fitting nonlinear curve for cell viability at increasing concentrations of tamoxifen was indicated with a dotted line for each cell line.
TRA-8/DR5 oligomerization follows Gaussian distribution
Cy5.5-TRA-8/DR5 oligomerization was observed in TNBC cell lines (), and the fluorescent signal intensity on the cluster followed Gaussian distribution (). The mean amplitude of the Gaussian curves in 2LMP cells was about 15% higher than that in SUM159 cells regardless of tamoxifen treatment, but no statistical significance was found (P > 0.05) (). The mean standard deviation of the Gaussian curves in 2LMP cells was 34% lower than that in SUM159 cells with statistical significance (P = 0.030) when Cy5.5-TRA-8 was used alone, but the difference was not significant when tamoxifen was added (P = 0.316). Gaussian curves fit better to Cy5.5-TRA-8 distribution on 2LMP cells than that on SUM159 cells regardless of tamoxifen treatment, but the R2 value was not statistically different (P > 0.05). The mean amplitude of the Gaussian curves presented a positive and linear relationship with the killing efficacy (R2 = 0.85), whereas the mean standard deviation presented a weak negative linear relationship with the killing efficacy (R2 = 0.30) ().
Figure 3. In vitro fluorescence imaging of Cy5.5-TRA-8 and image analysis. (A) Representative fluorescent images of Cy5.5-TRA-8 in SUM159 and 2LMP cells with/without tamoxifen treatment. (B and C) Fluorescent signal intensities of Cy5.5-TRA-8 along the yellow lines crossing the center of TRA-8/DR5 cluster and the best fitting Gaussian curves, when cells were (B) untreated or (C) treated with tamoxifen (20 μM). (D and E) Correlation between the mean killing efficacy (%) and (D) the mean amplitude or (E) the mean standard deviation of the best fitting Gaussian curves, when SUM159 or 2LMP cells were treated with TRA-8 (15.6 ng/mL) with/without tamoxifen (20 μM) (4 samples).
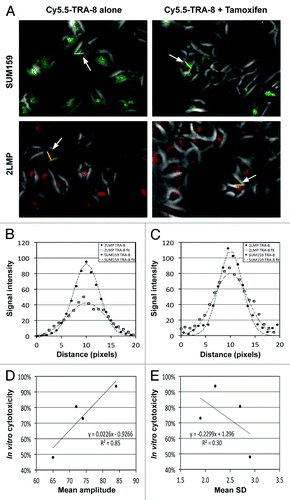
Table 1. The amplitude and standard deviation (SD) of the Gaussian curves fitting to the fluorescent signal intensities on a line crossing the center of Cy-5.5-TRA-8 cluster on either 2LMP or SUM159 cells, together with R2 values
Combination therapy with tamoxifen and TRA-8 yields an antagonistic effect in animal studies
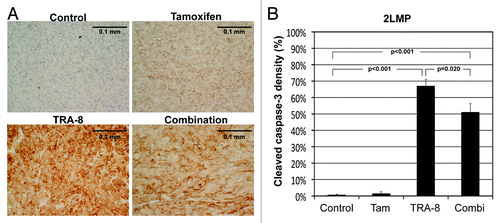
The mean growth of SUM159 tumors was about 60% suppressed at 6 wk after starting tamoxifen treatment (). However, unlike in vitro data, the antitumor efficacy of tamoxifen was not observed in 2LMP tumors (). Of note, the anti-tumor effect of TRA-8 declined when tamoxifen was added in both tumor models. The mean SUM159 tumor volume of animals treated with TRA-8 alone was about 2-fold smaller than that with combination therapy at 6 wk. In 2LMP model, only 1 of 9 animals treated with TRA-8 alone had to be killed due to excessive tumor size for 6 wk after therapy initiation, while 5 among 10 animals under combination therapy were euthanized. The mean 2LMP tumor volume of surviving animals treated with TRA-8 alone was about 7-fold smaller than that with combination therapy at 5 wk. In 2LMP tumors, mean ADC value was significantly increased by TRA-8 monotherapy (P = 0.029), but not by combination therapy (P = 0.298) (). The mean cleaved caspase-3 density of 2LMP tumors treated with TRA-8 alone was 67 ± 4%, which was significantly higher than that treated with combination therapy (51 ± 5%; P = 0.020) ().
Figure 4. Change of TNBC tumor volume during TRA-8 and/or tamoxifen therapy. (A and B) Animals were orthotopically implanted with (A) SUM159 (4 million) or (B) 2LMP (1 million) cells. Therapy started at 3 d after cell implantation with tamoxifen (400 mg/kg diet), TRA-8 (0.1 mg, weekly, i.p.), and combination, respectively, for 3 wk (0–21 d), and no drugs were given thereafter.
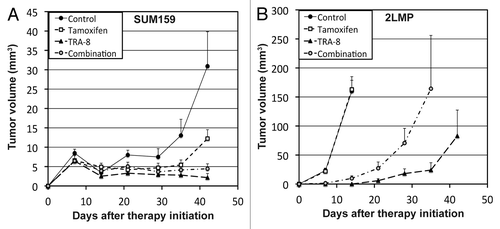
Figure 5. Diffusion-weighted imaging (DWI) of subcutaneous 2LMP tumor xenografts. (A) Representative diffusion weighted images of a 2LMP tumor xenograft prior to therapy initiation with four different b values such as 5, 300, 600, and 1000 s/mm2 with a constant gray scale, while tumor is indicated with a white arrow. (B) ADC maps obtained from the four DW images. (C and D) The changes of (C) tumor volume or (D) apparent diffusion coefficient (ADC), when animals were untreated (served as control) or treated with tamoxifen (200 mg/kg diet), TRA-8 (0.2 mg, days 0 and 3, i.p.), and combination, respectively, for 7 d. Statistical difference from the control group is represented with either asterisk (P < 0.05) or hash mark (P < 0.01).
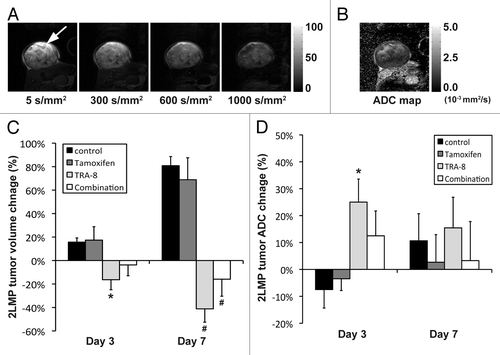
Figure 6. Histological analysis of 2LMP tumor tissues. (A) Representative microphotographs of cleaved caspase-3 stained tumor tissues, when 2LMP tumors were untreated (control) or treated with tamoxifen (200 mg/kg diet), TRA-8 (0.2 mg, days 0 and 3, i.p.), and combination, respectively, for 7 d. The length of each scale bar is 0.1 mm. (B) Cleaved caspase-3 density (%) of 2LMP tumor tissues in each group (mean and SE) with P values presenting statistical difference from the control group or between the two groups treated with TRA-8 monotherapy and combination therapy.
Tamoxifen is unrelated with in vivo delivery of TRA-8
In SUM159 model, the %ID/g of Tc-99 min labeled TRA-8 in leg muscle, liver, blood, and tumor of animals treated with tamoxifen for a week were 0.68 ± 0.17%, 6.58 ± 0.75%, 11.11 ± 0.83%, and 7.15 ± 1.88%, respectively, at 24 h after dose injection, while those of control animals were 0.83 ± 0.12%, 7.50 ± 1.17%, 12.26 ± 1.58%, and 7.78 ± 2.23%, respectively. In 2LMP model, those with tamoxifen treatment were 0.77 ± 0.14%, 7.55 ± 0.43%, 11.63 ± 0.42%, and 13.31 ± 1.00%, respectively, while those of control animals were 0.67 ± 0.17%, 5.97 ± 0.25%, 12.23 ± 0.23%, and 13.45 ± 1.27%, respectively. Tc99m-TRA-8 uptake into each tissue (or blood) was not statistically changed by tamoxifen treatment in either the 2LMP or SUM159 model (P > 0.05).
Discussion
To our knowledge, this is the first report on the combination use of tamoxifen and TRA-8 for TNBC. IC50 of tamoxifen for these TNBC cell lines was about 15 times higher than the median concentration of tamoxifen in human breast cancer tissue (2 μM) at the daily use of a 20-mg oral tablet.Citation31 Thus high dose of tamoxifen (200~400 mg/kg diet) was used for animal studies; if a mouse eats 5 g per day, the daily tamoxifen dose for the mouse was about 10 to 20 times higher than human dose. Tamoxifen markedly suppressed the growth of SUM159 tumors, but it did not induce any therapeutic response from 2LMP tumors. Estrogens present in the non-ovariectomized mice may interfere with tamoxifen on the regulation of ERβ activity in 2LMP tumors. Besides antagonistic effects were observed between tamoxifen and TRA-8 in in vivo experiments, although synergy was demonstrated in vitro. Since tamoxifen did not diminish the tumor delivery of TRA-8, we may reason that tamoxifen within a biological entity would function differently from that in in vitro settings. Tamoxifen is a pro-drug, and is converted into active metabolites such as afimoxifene (4-hydroxytamoxifen) and endoxifen (4-hydroxy-N-desmethyl-tamoxifen) in liver.Citation32,Citation33 One or both of the tamoxifen metabolites may interact with the intracellular caspase activation triggered by TRA-8. We confirmed that the cleaved caspase-3 induced by TRA-8 was significantly decreased when tamoxifen was used in combination.
We demonstrated that the in vitro fluorescent imaging assay of cellular oligomerization of TRA-8/DR5 might be able to determine the tumor sensitivity to TRA-8, enabling precision TRA-8 therapy for each patient. In TNBC cells presenting higher sensitivity to TRA-8, the oligomerization appeared to be more compact; the higher amplitude and lower standard deviation of the Gaussian curves fitting to the distribution of Cy5.5-TRA-8 were observed in 2LMP cells relative to those in SUM159 cells, which are fairly comparable with the higher sensitivity of 2LMP tumors to TRA-8 than SUM159 tumors validated in our current and previous studies.Citation3,Citation4 Therefore, the amplitude and/or standard deviation of the oligomerization may serve as predictive biomarkers of TRA-8 therapy. However, this approach cannot analyze whether TRA-8 affects vascular perfusion/permeability, interstitial fluid pressure, and molecular communication between cancer cells and extracellular matrix in solid tumors, which influence TRA-8 delivery into target cells and/or its cytotoxicity. Moreover, the therapeutic efficacy of TRA-8 in combination with other chemotherapeutic agents may not be accurately evaluated, as demonstrated in this study; the mean amplitude increased 11~14% when tamoxifen was added, but the therapeutic efficacy in in vivo studies did not. Therefore, to implement precision care with TRA-8 alone or in combination with other chemotherapeutic agents, the early tumor response may need to be assessed. Since TRA-8 triggers caspase activation to induce apoptosis, the intratumoral ADC change may be utilized as an early and accurate surrogate biomarker, which has been validated in TNBC animal models.Citation3,Citation4
In summary, these studies show that the combined use of TRA-8 and tamoxifen may result in antagonistic effects. The fluorescence imaging of Cy5.5-TRA-8 might be utilized to identify responding TNBC patients to TRA-8, although early therapy assessment using non-invasive imaging techniques like DWI would be necessary to verify it.
Materials and Methods
Reagents and cell lines
All reagents were from Fisher unless otherwise specified. Dr Tong Zhou (UAB) provided purified TRA-8 (mouse origin). Tamoxifen was purchased from Agvar Chemical, Inc. Teklad mash diet was purchased from Harlan Teklad. Cy5.5 was purchased from GE Healthcare Inc. Fresh Tc-99 min pertechnetate was purchased from Triad Isotopes. Dr Donald Buchsbaum (UAB) provided 4 triple negative (MDA-MB-231, SUM159, SUM149, 2LMP) and two ERα-positive (T47D, MCF7) human breast cancer cell lines. 2LMP is a subclone of MDA-MB-231, and it is more sensitive to TRA-8 than MDA-MB-231.Citation34 MDA-MB-231 and 2LMP cells were cultured in DMEM plus 10% FBS. SUM159 and SUM149 cells were cultured in Ham’s F-12 plus insulin plus hydrocortisone plus HEPES plus 5% FBS. T47D cells were cultured in RPMI plus 10% FBS. MCF-7 cells were cultured in MEM plus 10% FBS plus insulin plus NEAA. All media were phenol red-free.
Western blotting analysis
Log phase cultures of TNBC or ERα-positive human breast cancer cells were lysed by the addition of 1× RIPA buffer (50 mM TRIS-HCl, 150 mM NaCl, 0.1% SDS, 1% NP-40, 0.5% sodium deoxycholate) in the presence of protease inhibitor cocktail. Samples were centrifuged for 30 min at 12,500 RPM at 4 °C. Supernatants were collected and total protein concentration was determined using Lowry assay.Citation35 Fifteen micrograms of total protein extract from each sample was resolved by NuPAGE 4–12% Bis-Tris Gel (Invitrogen Corporation) and electrophoretically transferred to PVDF (polyvinylidene fluoride) membrane (Millipore Corporation). Membrane was washed in TBS (Tris buffered saline) containing 5% non-fat dry milk and 0.1% Tween-20 for 1 h before adding 1:750 ERα (or ERβ) antibody (Millipore Corporation) overnight at 4 °C. After washing the membrane with 3 changes of TBS-T (10 min), the membrane was incubated in 1:1000 goat anti-mouse HRP-conjugated secondary antibody (Santa Cruz Biotechnology, Inc.) for 1 h, followed by washing with TBS-T and chemiluminescent detection with West Pico Chemiluminescent Subtrate. Membrane was placed in an IVIS-100 imaging system (Caliper Life Sciences) for detection; the exposure time was 30 s, the axial field of view (FOV) was 10 cm, and the binning was 2. HRP-conjugated β-actin was also detected to serve as a control using the same method.
Cell viability assay
The half maximal inhibitory concentration (IC50) of tamoxifen for 2LMP or SUM159 cell line was determined as follows. Tamoxifen was diluted at 14 different concentrations (0–100 μM) and was added to 16 wells (1000 cells per well) per tamoxifen concentration. After 24 h of incubation at 37 °C in 5% CO2, the ATP level was determined using the ATPlite assay (Perkin-Elmer). The light emission from the wells of the plates was measured using an IVIS-100 imaging system (Caliper Life Sciences) and quantified using the vendor software. The luminescent exposure time was 60 s, while the binning was 8. Regions of interest (ROIs) were drawn manually around the area of each individual well in the plate, and the intensity of light emitted from each ROI was measured. Data were normalized to light emission of an equal number of untreated cells otherwise incubated under the same conditions as the treated cells. IC50 was determined by fitting a nonlinear curve where Y is the normalized cytotoxicity data, X is the tamoxifen concentration, and a is a constant. Nonlinear curve fitting was implemented using computer software developed by Labview, version 2010 (National Instruments Co.).
In vitro viability assays for 2LMP and SUM159 cells were conducted with TRA-8 alone or in combination with tamoxifen. TRA-8 was diluted to eight different concentrations (0–1000 ng/mL) and was added to 16 wells (1000 cells per well) per TRA-8 concentration. Tamoxifen (20 μM) was added to only 8 wells per TRA-8 concentration. Cell viability was measured as described above.
Fluorescence imaging
Fluorescence imaging was performed to analyze the cellular distributions of Cy5.5-labeled TRA-8. Monofunctional dye Cy5.5 was conjugated to TRA-8 at a 3:1 molar ratio according to manufacturer’s instructions. Both 2LMP and SUM159 cell lines (1 × 10⁵ cells/plate) were seeded onto 35-mm glass bottom culture dishes (MatTek Corp.) and incubated in complete cell culture medium. At 16 h after seeding, the cells were washed with PBS and then treated with Cy5.5-TRA-8 (5 µg/mL) with or without tamoxifen (20 μM). At 24 h post treatment, the cells were washed with PBS and then 3 images (20×) were taken per each treatment with a Leica DMIRE2 inverted microscope equipped with a Nuance camera (CRI Inc.) for randomly selected areas. To quantify the distribution of Cy5.5-TRA-8, a line was drawn on a randomly selected cell (n = 10 per each image), and the signal intensities of the fluorophores located on the line were measured. The signal intensities on the line were subtracted by its minimum value, and then the best fitting Gaussian curve was determined. The amplitude and the standard deviation of the Gaussian curve were retrieved. The signal intensities of fluorophores were measured using ImageJ, version 1.47n (National Institutes of Health).
Animal modeling
Animal experiments were reviewed and approved by the institutional animal care and use committee (IACUC) at the University of Alabama at Birmingham. A total of 16 groups of female athymic nude mice (4–5 wk old) were used. All animals were anesthetized with isoflurane (1–2%) during dosing and imaging.
Groups 1–8 (n = 9–10 per group) were used to assess the therapeutic efficacy for residual tumors. Four million SUM159 cells (or one million 2LMP cells) were injected into the mammary fat pad of left chest in each animal of groups 1–4 (or groups 5–8). Three days after cell implantation, groups 1–4 (or groups 5–8) were untreated (served as control) or treated with TRA-8 (0.1 mg, weekly, i.p.), tamoxifen (400 mg/kg diet), and combination, respectively, for 3 wk, while tumor size was measured weekly using a caliper for 6 wk. Tumor volume was calculated using the equation, Volume = xyz(π / 6), where x, y, and z are three orthogonal dimensions.
Groups 9–12 (n = 5 per group) were used to study whether tamoxifen interfered with TRA-8 delivery into the target cells. Groups 9 and 10 (or groups 11 and 12) were orthotopically implanted with four million SUM159 cells in the left chest per animal (or one million 2LMP cells). When the mean tumor size was about 9 mm in diameter, groups 9 and 11 were treated with tamoxifen (400 mg/kg diet), whereas groups 10 and 12 were fed on regular teklad rodent diet. At 1 wk after therapy initiation, all four groups were intravenously injected with Tc-99m-TRA-8 (0.74 ± 0.03 MBq; 0.58 ± 0.02 µg), and biodistribution study was followed at 24 h thereafter as described in our previous studies.Citation21,Citation36
Groups 13–16 (n = 3–4 per group) were used to assess the intratumoral apoptosis induced by therapy. Groups 13–16 were subcutaneously implanted with 2LMP cells (1 million per site), and therapy started when the mean tumor size was about 9 mm in diameter. Groups 13–16 were untreated (control) or treated with TRA-8 (0.2 mg, days 0 and 3, i.p.), tamoxifen (200 mg/kg diet), and combination, respectively, for a week; different dosing was used to test whether it affects the therapeutic response. T2-weighted (T2W) MRI and DWI were applied at 0, 3, and 7 d after therapy initiation, and tumor volume and ADC value were quantitated as described in our previous studies.Citation29,Citation30 All mice were sacrificed after imaging on day 7, and tumors were collected for histological analysis.
Histological analysis
Cleaved caspase-3 staining was performed for all tumor tissues of groups 13–16 to confirm the apoptosis induced by TRA-8 therapy with or without tamoxifen, as reported previously.Citation30 Two pictures (X200) were randomly taken in a blinded manner for each tumor slice with a camera (SPOT) on a microscope (Nikon Optiphot-2; Nikon). The area occupied by cleaved caspase-3 was identified by color difference between the target region (brown) and background (pale blue). Color thresholding technique was employed to segment the region of interest (ROI), while the threshold was manually determined in histogram for blue color of each image, and the cleaved caspase-3 density (cleaved caspase-3 area/total area) was calculated. The image segmentation was implemented using ImageJ (1.47n; NIH).
Statistical analysis
One-way ANOVA was used to compare the mean tumor volume and ADC values of the established tumor model (groups 13–16) prior to therapy initiation, and the changes that occurred during therapy.Citation37 One-way ANOVA was also used to compare cleaved caspase-3 densities in tumors of groups 13–16, %ID/g of tumor, blood, liver, and leg muscle between groups 9 and 10 (or groups 11 and 12), and the amplitudes (or standard deviations) of best fitting Gaussian curves for the signal intensities of Cy5.5-TRA-8 on 2LMP cells (or SUM159 cells) treated with/without tamoxifen. P values less than 0.05 were considered significant, while applying Bonferroni correction for multiple comparisons.Citation37 Data are presented as means ± standard error. All analyses were performed with SAS, version 9.2 (SAS Institute Inc.).
Disclosure of Potential Conflict of interest
D.J.B. has intellectual property related to TRA-8.
Acknowledgments
The authors thank Dr Clinton Grubbs for providing tamoxifen and Teklad mash diet for this study. This study was financially supported by Komen for the Cure Promise Grant KG090969 and NIH grant 2P30CA013148.
References
- Ichikawa K, Liu W, Zhao L, Wang Z, Liu D, Ohtsuka T, Zhang H, Mountz JD, Koopman WJ, Kimberly RP, et al. Tumoricidal activity of a novel anti-human DR5 monoclonal antibody without hepatocyte cytotoxicity. Nat Med 2001; 7:954 - 60; http://dx.doi.org/10.1038/91000; PMID: 11479629
- Rahman M, Davis SR, Pumphrey JG, Bao J, Nau MM, Meltzer PS, Lipkowitz S. TRAIL induces apoptosis in triple-negative breast cancer cells with a mesenchymal phenotype. Breast Cancer Res Treat 2009; 113:217 - 30; http://dx.doi.org/10.1007/s10549-008-9924-5; PMID: 18266105
- Oliver PG, Lobuglio AF, Zhou T, Forero A, Kim H, Zinn KR, et al. Effect of anti-DR5 and chemotherapy on basal-like breast cancer. Breast Cancer Res Treat 2012; 133:417 - 26; PMID: 21901385
- Zhai G, Kim H, Sarver D, Samuel S, Whitworth L, Umphrey H, et al. Early therapy assessment of combined anti-DR5 antibody and carboplatin in triple-negative breast cancer xenografts in mice using diffusion-weighted imaging and H MR spectroscopy. Journal of magnetic resonance imaging. J Magn Reson Imaging 2014; 39:1588 - 94
- Rouzier R, Perou CM, Symmans WF, Ibrahim N, Cristofanilli M, Anderson K, Hess KR, Stec J, Ayers M, Wagner P, et al. Breast cancer molecular subtypes respond differently to preoperative chemotherapy. Clin Cancer Res 2005; 11:5678 - 85; http://dx.doi.org/10.1158/1078-0432.CCR-04-2421; PMID: 16115903
- Carey LA, Dees EC, Sawyer L, Gatti L, Moore DT, Collichio F, Ollila DW, Sartor CI, Graham ML, Perou CM. The triple negative paradox: primary tumor chemosensitivity of breast cancer subtypes. Clin Cancer Res 2007; 13:2329 - 34; http://dx.doi.org/10.1158/1078-0432.CCR-06-1109; PMID: 17438091
- Forero-Torres A, Shah J, Wood T, Posey J, Carlisle R, Copigneaux C, Luo FR, Wojtowicz-Praga S, Percent I, Saleh M. Phase I trial of weekly tigatuzumab, an agonistic humanized monoclonal antibody targeting death receptor 5 (DR5). Cancer Biother Radiopharm 2010; 25:13 - 9; http://dx.doi.org/10.1089/cbr.2009.0673; PMID: 20187792
- Miller WR, Anderson TJ, Dixon JM, Saunders PT. Oestrogen receptor beta and neoadjuvant therapy with tamoxifen: prediction of response and effects of treatment. Br J Cancer 2006; 94:1333 - 8; http://dx.doi.org/10.1038/sj.bjc.6603082; PMID: 16622466
- Rose DP, Chlebowski RT, Connolly JM, Jones LA, Wynder EL. Effects of tamoxifen adjuvant therapy and a low-fat diet on serum binding proteins and estradiol bioavailability in postmenopausal breast cancer patients. Cancer Res 1992; 52:5386 - 90; PMID: 1394142
- Green S, Walter P, Kumar V, Krust A, Bornert JM, Argos P, Chambon P. Human oestrogen receptor cDNA: sequence, expression and homology to v-erb-A. Nature 1986; 320:134 - 9; http://dx.doi.org/10.1038/320134a0; PMID: 3754034
- Greene GL, Gilna P, Waterfield M, Baker A, Hort Y, Shine J. Sequence and expression of human estrogen receptor complementary DNA. Science 1986; 231:1150 - 4; http://dx.doi.org/10.1126/science.3753802; PMID: 3753802
- Kuiper GG, Enmark E, Pelto-Huikko M, Nilsson S, Gustafsson JA. Cloning of a novel receptor expressed in rat prostate and ovary. Proc Natl Acad Sci U S A 1996; 93:5925 - 30; http://dx.doi.org/10.1073/pnas.93.12.5925; PMID: 8650195
- Osborne CK. Tamoxifen in the treatment of breast cancer. N Engl J Med 1998; 339:1609 - 18; http://dx.doi.org/10.1056/NEJM199811263392207; PMID: 9828250
- Skliris GP, Leygue E, Curtis-Snell L, Watson PH, Murphy LC. Expression of oestrogen receptor-beta in oestrogen receptor-alpha negative human breast tumours. Br J Cancer 2006; 95:616 - 26; http://dx.doi.org/10.1038/sj.bjc.6603295; PMID: 16880783
- Honma N, Horii R, Iwase T, Saji S, Younes M, Takubo K, Matsuura M, Ito Y, Akiyama F, Sakamoto G. Clinical importance of estrogen receptor-beta evaluation in breast cancer patients treated with adjuvant tamoxifen therapy. J Clin Oncol 2008; 26:3727 - 34; http://dx.doi.org/10.1200/JCO.2007.14.2968; PMID: 18669459
- Yan M, Rayoo M, Takano EA, Fox SB, kConFab Investigators. Nuclear and cytoplasmic expressions of ERβ1 and ERβ2 are predictive of response to therapy and alters prognosis in familial breast cancers. Breast Cancer Res Treat 2011; 126:395 - 405; http://dx.doi.org/10.1007/s10549-010-0941-9; PMID: 20490651
- Razandi M, Pedram A, Jordan VC, Fuqua S, Levin ER. Tamoxifen regulates cell fate through mitochondrial estrogen receptor beta in breast cancer. Oncogene 2013; 32:3274 - 85; http://dx.doi.org/10.1038/onc.2012.335; PMID: 22907432
- Ozben T. Oxidative stress and apoptosis: impact on cancer therapy. J Pharm Sci 2007; 96:2181 - 96; http://dx.doi.org/10.1002/jps.20874; PMID: 17593552
- Gruvberger-Saal SK, Bendahl PO, Saal LH, Laakso M, Hegardt C, Edén P, Peterson C, Malmström P, Isola J, Borg A, et al. Estrogen receptor beta expression is associated with tamoxifen response in ERalpha-negative breast carcinoma. Clin Cancer Res 2007; 13:1987 - 94; http://dx.doi.org/10.1158/1078-0432.CCR-06-1823; PMID: 17404078
- Gorin MB, Day R, Costantino JP, Fisher B, Redmond CK, Wickerham L, Gomolin JE, Margolese RG, Mathen MK, Bowman DM, et al. Long-term tamoxifen citrate use and potential ocular toxicity. Am J Ophthalmol 1998; 125:493 - 501; http://dx.doi.org/10.1016/S0002-9394(99)80190-1; PMID: 9559735
- Kim H, Chaudhuri TR, Buchsbaum DJ, Wang D, Zinn KR. High-resolution single-photon emission computed tomography and X-ray computed tomography imaging of Tc-99m-labeled anti-DR5 antibody in breast tumor xenografts. Mol Cancer Ther 2007; 6:866 - 75; http://dx.doi.org/10.1158/1535-7163.MCT-06-0230; PMID: 17363481
- Gajate C, Mollinedo F. The antitumor ether lipid ET-18-OCH(3) induces apoptosis through translocation and capping of Fas/CD95 into membrane rafts in human leukemic cells. Blood 2001; 98:3860 - 3; http://dx.doi.org/10.1182/blood.V98.13.3860; PMID: 11739199
- Cremesti A, Paris F, Grassmé H, Holler N, Tschopp J, Fuks Z, Gulbins E, Kolesnick R. Ceramide enables fas to cap and kill. J Biol Chem 2001; 276:23954 - 61; http://dx.doi.org/10.1074/jbc.M101866200; PMID: 11287428
- Delmas D, Rébé C, Lacour S, Filomenko R, Athias A, Gambert P, Cherkaoui-Malki M, Jannin B, Dubrez-Daloz L, Latruffe N, et al. Resveratrol-induced apoptosis is associated with Fas redistribution in the rafts and the formation of a death-inducing signaling complex in colon cancer cells. J Biol Chem 2003; 278:41482 - 90; http://dx.doi.org/10.1074/jbc.M304896200; PMID: 12902349
- Fanzo JC, Lynch MP, Phee H, Hyer M, Cremesti A, Grassme H, Norris JS, Coggeshall KM, Rueda BR, Pernis AB, et al. CD95 rapidly clusters in cells of diverse origins. Cancer Biol Ther 2003; 2:392 - 5; http://dx.doi.org/10.4161/cbt.2.4.442; PMID: 14508111
- Dumitru CA, Gulbins E. TRAIL activates acid sphingomyelinase via a redox mechanism and releases ceramide to trigger apoptosis. Oncogene 2006; 25:5612 - 25; http://dx.doi.org/10.1038/sj.onc.1209568; PMID: 16636669
- Wagner KW, Punnoose EA, Januario T, Lawrence DA, Pitti RM, Lancaster K, Lee D, von Goetz M, Yee SF, Totpal K, et al. Death-receptor O-glycosylation controls tumor-cell sensitivity to the proapoptotic ligand Apo2L/TRAIL. Nat Med 2007; 13:1070 - 7; http://dx.doi.org/10.1038/nm1627; PMID: 17767167
- Kim H, Zhai G, Samuel SL, Rigell CJ, Umphrey HR, Rana S, Stockard CR, Fineberg NS, Zinn KR. Dual combination therapy targeting DR5 and EMMPRIN in pancreatic adenocarcinoma. Mol Cancer Ther 2012; 11:405 - 15; http://dx.doi.org/10.1158/1535-7163.MCT-11-0581; PMID: 22203731
- Kim H, Morgan DE, Buchsbaum DJ, Zeng H, Grizzle WE, Warram JM, Stockard CR, McNally LR, Long JW, Sellers JC, et al. Early therapy evaluation of combined anti-death receptor 5 antibody and gemcitabine in orthotopic pancreatic tumor xenografts by diffusion-weighted magnetic resonance imaging. Cancer Res 2008; 68:8369 - 76; http://dx.doi.org/10.1158/0008-5472.CAN-08-1771; PMID: 18922909
- Kim H, Morgan DE, Zeng H, Grizzle WE, Warram JM, Stockard CR, Wang D, Zinn KR. Breast tumor xenografts: diffusion-weighted MR imaging to assess early therapy with novel apoptosis-inducing anti-DR5 antibody. Radiology 2008; 248:844 - 51; http://dx.doi.org/10.1148/radiol.2483071740; PMID: 18710978
- Kisanga ER, Gjerde J, Guerrieri-Gonzaga A, Pigatto F, Pesci-Feltri A, Robertson C, Serrano D, Pelosi G, Decensi A, Lien EA. Tamoxifen and metabolite concentrations in serum and breast cancer tissue during three dose regimens in a randomized preoperative trial. Clin Cancer Res 2004; 10:2336 - 43; http://dx.doi.org/10.1158/1078-0432.CCR-03-0538; PMID: 15073109
- Jordan VC. Metabolites of tamoxifen in animals and man: identification, pharmacology, and significance. Breast Cancer Res Treat 1982; 2:123 - 38; http://dx.doi.org/10.1007/BF01806449; PMID: 6184101
- Stearns V, Johnson MD, Rae JM, Morocho A, Novielli A, Bhargava P, Hayes DF, Desta Z, Flockhart DA. Active tamoxifen metabolite plasma concentrations after coadministration of tamoxifen and the selective serotonin reuptake inhibitor paroxetine. J Natl Cancer Inst 2003; 95:1758 - 64; http://dx.doi.org/10.1093/jnci/djg108; PMID: 14652237
- Buchsbaum DJ, Zhou T, Grizzle WE, Oliver PG, Hammond CJ, Zhang S, Carpenter M, LoBuglio AF. Antitumor efficacy of TRA-8 anti-DR5 monoclonal antibody alone or in combination with chemotherapy and/or radiation therapy in a human breast cancer model. Clin Cancer Res 2003; 9:3731 - 41; PMID: 14506165
- Lowry OH, Rosebrough NJ, Farr AL, Randall RJ. Protein measurement with the Folin phenol reagent. J Biol Chem 1951; 193:265 - 75; PMID: 14907713
- Kim H, Chaudhuri TR, Buchsbaum DJ, Wang D, Zinn KR. Single-photon emission computed tomography imaging with a humanized, apoptosis-inducing antibody targeting human death receptor 5 in pancreas and breast tumor xenografts. Cancer Biol Ther 2007; 6:1396 - 402; http://dx.doi.org/10.4161/cbt.6.9.4540
- Neter J, Kutner MH, Nachtsheim JC, Wasserman W. Applied linear statistical models. Columbus: The McGraw-Hill Companies, Inc., 1996.
