Abstract
Papillary thyroid carcinoma (PTC) is the most common endocrine and thyroid malignancy. The urokinase plasminogen activator receptor (uPAR) plays an important role in cancer pathogenesis, including breakdown of the extracellular matrix, invasion, and metastasis. Additionally, there is increasing evidence that uPAR also promotes tumorigenesis via the modulation of multiple signaling pathways. BRAFV600E, the most common initial genetic mutation in PTC, leads to ERK1/2 hyperphosphorylation, which has been shown in numerous cancers to induce uPAR. Treatment of the BRAFV600E-positive PTC cell line, BCPAP, with the MEK/ERK inhibitor U0126 reduced uPAR RNA levels by 90%. siRNA-mediated down-regulation of uPAR in BCPAP cells resulted in greatly decreased activity in the focal adhesion kinase (FAK)/phosphatidylinositol 3-kinase (PI3K)/Akt signaling pathway. This phenomenon was concurrent with drastically reduced proliferation rates and decreased clonigenic survival, as well as demonstrated senescence-associated nuclear morphology and induction of b-galactosidase activity. uPAR-knockdown BCPAP cells also displayed greatly reduced migration and invasion rates, as well as a complete loss of the cells' ability to augment their invasiveness following plasminogen supplementation. Taken together, these data provide new evidence of a novel role for uPAR induction (as a consequence of constitutive ERK1/2 activation) as a central component in PTC pathogenesis, and highlight the potential of uPAR as a therapeutic target.
Introduction
Papillary thyroid carcinoma (PTC) is the most common endocrine malignancy, and annually accounts for more deaths than all other endocrine cancers combined. Additionally, PTC has a rapidly growing incidence worldwide.Citation1 PTC has a marked propensity for early invasion of the surrounding neck tissue, as well as metastasis to central lymph nodes (and other regional lymph nodes).Citation2 In fact, the number of PTC metastases to the central lymph nodes has been correlated with numerous negative prognostic factors, including tumor size, extrathyroidal extension and lateral neck lymph node metastasis.Citation3 Additionally, 10–15% of PTC patients present with distant metastases, which have the greatest impact on patient survival rates (40% over 10 years).Citation4 Currently, the only treatment for inoperable metastatic PTC is radioactive iodine (RAI). In cases where distant metastases have lost the ability to trap or retain iodine, the 10-year survival rate drops to 10%.Citation5 Furthermore, high cumulative activity of RAI has been associated with various unfavorable side effects, including an increased risk of subsequent development of leukemia and other secondary cancers.Citation6 The clinical importance of invasive processes in PTC, as well as the limited availability of tools to combat such disease, has led to the investigation of molecular mediators of invasion in hopes of developing safer, more effective inhibitors of metastatic PTC.
The urokinase plasminogen activator receptor (uPAR), in conjunction with its associated serine protease urokinase plasminogen activator (uPA), plays an important and multifaceted role in cancer pathogenesis. uPAR binds and activates uPA, which is then able to convert plasminogen to active plasmin, which in turn is able to degrade components of the extracellular matrix (ECM), thus facilitating invasion and local/distant metastasis. Additionally, uPAR has also been shown to have important signaling properties (via interactions with membrane-bound integrins) that are capable of affecting malignant phenotypes such as cell migration and proliferation.Citation7 These characteristics have made therapeutic targeting of uPAR (via exogenous inhibitors and/or siRNA) an attractive concept in cancer biology.Citation8
One of the hallmarks of PTC molecular pathogenesis is hyperactivation of the MEK/ERK arm of the MAPK signaling cascade due to a BRAFV600E activating mutation or, less commonly, a RET/PTC rearrangement or RAS activation.Citation9 MEK/ERK hyperactivity then induces numerous genes capable of contributing to a malignant phenotype. One such gene is uPAR, which is induced in several cancers by ERK.Citation10,Citation11 Further, uPAR induction has been well documented in papillary thyroid cancer.Citation12,Citation13 Thus, PTC represents a particularly novel malignancy in which to study the role of uPAR.
Previous work in our laboratory has shown that antibody-based inhibition of the uPAR/uPA system was able to significantly reduce the invasiveness of BRAFV600E-positive papillary thyroid cancer cells.Citation13 However, there have been no studies dealing with the effects of uPAR downregulation in PTC cells. Given the near-universal prevalence of ERK-activating mutations in PTC, and the degree to which ERK activity is able to induce uPAR expression in other cancers, we postulated that uPAR is a critically important component of ERK-mediated transformation in PTC. Here we report the reduction in malignant phenotypes (and accompanying signaling cascade modulation) associated with the downregulation of uPAR (via siRNA) in the BRAFV600E-positive PTC cell line BCPAP.
Results
Inhibition of ERK1/2 phosphorylation causes decreased expression of uPAR in BCPAP cells.
As ERK hyperphosphorylation is known to induce uPAR in a variety of cancers,Citation7,Citation10,Citation11 we first sought to verify that uPAR expression is positively regulated by MEK/ERK activity in PTC. Treatment of BCPAP cells for 12 hours with the synthetic MEK inhibitor U0126 (10 µM) reduced p-ERK1/2Thr202/Tyr204 levels by 93% compared to control cells (). No variation in the total amount of ERK1/2 was observed. This was concurrent with a 90% reduction in uPAR mRNA levels, as detected by qRT-PCR ().
siRNA-mediated downregulation of uPAR causes the reduction of uPAR RNA and protein expression.
As uPAR is induced by the characteristic ERK1/2 hyperactivity of PTC, we sought to determine the phenotypic consequences of inhibiting uPAR expression in PTC. Transfection of BCPAP cells with uPAR siRNA (utilizing the Thermo-Dharmacon Accell siRNA delivery system) reduced uPAR mRNA levels by 90% 72 hours after siRNA treatment (). This was associated with a reduction in corresponding uPAR protein levels 96 hours after siRNA treatment as measured by western blot (). No differences were observed in uPAR mRNA or protein levels in BCPAP cells which were transfected with non-targeting siRNA or control cells which had been grown in Accell siRNA delivery media.
Downregulation of uPAR causes a decrease in p-FAKTyr397, PI3K and p-AktSer473.
Following our validated knockdown of uPAR at the RNA and protein levels, we sought to determine if established uPAR signaling pathways had been similarly disrupted. shows the protein levels of total FAK, p-FAKTyr397, total PI3K, total Akt and p-AktSer473. Total FAK levels remained unchanged in all BCPAP cell populations. In uPAR-knockdown cells, however, almost undetectable levels of p-FAKTyr397, the autophosphorylated form of FAK,Citation14 were observed. Total p85-PI3K levels were also diminished, in correlation with the reduced levels of its recruitment domain, p-FAKTyr397.Citation15 p-Aktser473 levels were also greatly reduced in the uPAR-knockdown BCPAP cells, while total Akt levels remained comparable to those observed in the control cells.
Downregulation of uPAR inhibits BCPAP cell colony formation and proliferation.
To investigate the relative importance of uPAR and its associated signaling pathways in cell growth and proliferation, we examined the effects of uPAR downregulation on these processes in BCPAP cells. uPAR-knockdown BCPAP cells displayed a significantly decreased (p < 0.05) capacity to form colonies (). While control and non-targeting siRNA-transfected BCPAP cells were able to form similar numbers of colonies after 14 days (44 ± 8.6 and 42 ± 7.9, respectively), uPAR-knockdown BCPAP cells were only able to form an average of 6.5 colonies per well (±5.8), representing an ∼85% reduction in colony-forming capacity.
Additionally, the uPAR-knockdown BCPAP cells displayed significantly altered growth profiles when compared to the non-targeting siRNA-transfected control cells (). While the uPAR-knockdown growth curves plateaued at approximately 24 hours following seeding (i.e., 96 hours post-transfection, concurrent with the previously established time of uPAR protein reduction), the non-targeting transfectants displayed a steadily increasing population level. Total cell number became significantly different (p < 0.05) between the two populations at 48 hours following seeding for these assays (i.e., 120 hours post-transfection). Both cell populations consistently displayed ≥95% viability as determined by trypan blue exclusion throughout the time-course studied (data not shown).
Downregulation of uPAR causes BCPAP cells to display increased senescence-associated nuclear morphology and induction of β-galactosidase activity.
Following our observation that uPAR downregulation results in decreased proliferation and colony-formation capacity in BCPAP cells, we sought to further characterize this growth phenotype by examining the changes in nuclear morphology and cell cycle via laser scanning cytometry (LSC). uPAR knockdown had no discernible effect on cell cycle distribution, as measured by DNA frequency histograms ( inset). However, when the nuclear size (represented by the area of the DNA-associated DAPI fluorescence) was plotted versus the maximal pixel of DNA/DAPI fluorescence on bivariate distribution scatterplots (), it was apparent that uPAR-knockdown BCPAP cells had increased nuclear area and distinctly decreased intensity of DNA/DAPI fluorescence (maximal pixel). Since DNA/DAPI area was increased and the intensity of DNA/DAPI fluorescence decreased in senescent cells, the ratio of maximal pixel to area (max/area) was decreased to an even greater degree in uPAR-knockdown BCPAP cells (). These nuclear morphometric characteristics (decrease in DNA/DAPI fluorescence, increase in DNA/DAPI area, and decrease in ratio of maximal pixel of DAPI fluorescence to DAPI area) have previously been established as sensitive indicators of cell senescence.Citation16
To further validate the observation that uPAR-knockdown induces senescence in BCPAP cells, we tested for the presence of β-galactosidase activity at pH 6, an established, specific marker of cellular senescence ().Citation17 While BCPAP cells transfected with non-targeting siRNA displayed minimal β-galactosidase staining (3.2% ± 1.1), such staining patterns were greatly increased in uPAR-knockdown cells (67.3% ± 4.3, p < 0.01), providing additional proof that downregulation of uPAR drives BCPAP cells into replicative senescence.
Downregulation of uPAR inhibits BCPAP cell migration and invasion.
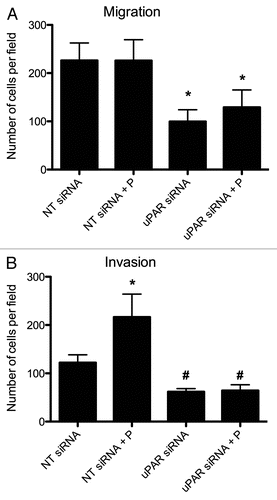
To investigate the role of uPAR in PTC cell migratory and invasive processes, transwell migration and invasion assays were performed using BCPAP cells transfected with non-targeting or uPAR siRNA. uPAR downregulation resulted in a significant reduction (55.8% ± 10.8, p < 0.05) of BCPAP cell migration compared to non-targeting siRNA transfectants (). Plasminogen supplementation had no discernable effect on the migratory potentials of either cell population. In keeping with the migratory patterns, uPAR-knockdown cells displayed a significantly reduced ability (51% ± 5.3, p < 0.05) to invade and migrate through a matrigel barrier relative to non-targeting siRNA-treated cells (). Additionally, non-targeting siRNA transfectants were able to augment their invasiveness by 80% ± 20.5 (p < 0.05) when supplemented with plasminogen, a phenotype we previously described as being attributed to conversion of plasminogen to plasmin and subsequent degradation of the matrigel barrier.Citation13 Conversely, uPAR-knockdown cells' invasiveness was unaffected by the presence or absence of plasminogen.
Discussion
The growing incidence of PTC worldwide has largely been due to increased detection of small (≤20 mm) malignant nodules.Citation18 While PTC typically has a good prognosis following thyroidectomy, substantial recurrence rates and post-surgical morbidity (lifelong thyroid hormone-replacement therapy, risk of recurrent laryngeal nerve damage, hypocalcemia) remain a problem.Citation3 Additionally, distant metastases have a profoundly negative impact on patient survival rates, significantly more so if such metastases are inoperable or resistant to RAI therapy.Citation4,Citation5 In recent years, the association between BRAFV600E and poor clinical-pathological outcome (including distant metastases) has been reported in many PTC populations.Citation18 Furthermore, PTC samples harboring BRAFV600E mutations have been shown to have higher transcriptional levels of uPAR (compared to RET/PTC), as well as gene expression profiles that preferentially favor the remodeling and degradation of the ECM.Citation19 This underscores the need for development of new PTC therapies capable of targeting BRAFV600E-induced mediators of proliferation and invasion.
With the ability to silence specific genes without the side effects or toxicity of conventional gene-suppression therapeutics (such as chemical inhibitors and ribozymes/deoxyribozymes), RNA interference (RNAi) is widely recognized for its therapeutic potential in human diseases. While clinical implementation of RNAi remains in the early experimental stages,Citation20 the potential for such a technique in cancer treatment has been widely demonstrated.Citation21 RNAi against certain molecular targets in cancer has been shown to cause tumor growth arrest, kill cancer cells or sensitize malignant cells to subsequent drug or radiation therapy.Citation22,Citation23
In this study, we demonstrate that siRNA targeting of uPAR in the PTC cell line BCPAP leads to the efficient and specific inhibition of endogenous uPAR mRNA and protein in vitro; this was following confirmation that uPAR overexpression in these cells is closely correlated with ERK hyperphosphorylation. This is the first time that MEK/ERK inhibition has been shown to result in the downregulation of uPAR in a PTC cell line, demonstrating the importance of studying uPAR in the context of a malignancy characterized by ERK hyperactivity.Citation9
The activation of FAK/PI3K/Akt signaling by uPAR (via integrin interactions) has been well documented; indeed, this has been demonstrated by downregulating uPAR in other cancers.Citation7,Citation23 Our observation of uPAR-knockdown cells' decreased migratory and invasive ability is also consistent with these previous studies, as FAK/PI3K/Akt signaling is known to directly modulate these behaviors.Citation7,Citation24 Of note is the fact that, in addition to decreased migration and invasion rates, uPAR-knockdown BCPAP cells displayed a complete loss of ability to augment their baseline invasiveness following supplementation with plasminogen, a phenotype of these cells which we had previously characterized using antibody-based inhibition of uPAR.Citation13
While our observation that uPAR downregulation inhibits cell proliferation and colony formation has been corroborated by such studies in other cancers,Citation23,Citation25 this is the first time that such data has been reported for a PTC cell line. Additionally, this is the first study to report that uPAR downregulation can induce senescence in malignant cells. Senescent cells possess several distinct morphological characteristics, including a “flattened” appearance, enlarged, often irregular nuclei and increase in cellular, nuclear and nucleolar size.Citation26,Citation27 Utilizing morphometric analysis techniques using LSC which have previously been described and validated,Citation16 we were able to measure large samples of cells for the alterations in nuclear and chromatin structure that accompany senescence. The observed decrease in intensity of DNA/DAPI fluorescence (maximal pixel) and the increase in nuclear area is a consequence of the extensive “flattening” of the cell. The decrease in DNA/DAPI fluorescence is also due to the reduced thickness of the nucleoplasm in senescent cells. The analysis of nuclear area and DNA/DAPI fluorescence intensity is a sensitive biomarker of the characteristic change in cell morphology considered to be indicative of senescence.Citation16 Additionally, uPAR-knockdown cells displayed a robust increase in β-galactosidase staining, which is considered to be the hallmark of senescence.Citation17
Of note is the observation that uPAR-knockdown cells have been driven into senescence and cessation of proliferation in the absence of a significant change in the pattern of DNA content frequency histograms. Such growth arrests characterized by the. presence of cells with G1, S and G2M content of DNA that do not progress through the cell cycle (“frozen in the cycle”) have been previously documented.Citation28,Citation29 The presence of cells with an S-phase DNA content undergoing senescence was recently reported by Pospelova et al.Citation30 and it was explained by the induction of DNA replication stress that leads to stalling replication forks.Citation31
The observation that suppression of proliferative PI3K/Akt signaling can result in cellular senescence has been well established.Citation32,Citation33 Furthermore, hyperactive ERK or mTOR signaling has been shown to lead to cellular senescence in normal and cancerous cell lines,Citation34–Citation37 including benign tumors where ERK activation is secondary to a mutation in the Ras-Raf-MAPK signaling cascade, such as BRAFV600E.Citation38 It has even been demonstrated that inhibition of PI3K/Akt signaling is sufficient to induce senescence, even in the face of persistent ERK activity.Citation39 It is tempting to speculate that in PTC, the presence of ERK-hyperactivity is able to induce uPAR as a means of activating FAK/PI3K/Akt signaling, thus staving off senescence and allowing for a more hyperproliferative state (as well as facilitating cellular migration and invasion).
In summary, we have shown for the first time that downregulation of uPAR (which we demonstrated to be induced by ERK hyperphosphorylation) causes significantly decreased activity in the FAK/PI3K/Akt signaling cascade in BCPAP cells. Disruption of this signaling pathway was correlated with significant decreases in migration and invasion capacities, colony-forming ability and proliferation. The decrease in proliferative capacity was shown to be due to the induction of cellular senescence. These results provide new evidence that uPAR is a fundamentally important component of BRAFV600E/ERK-mediated malignant phenotypes in PTC, and further highlight the attractiveness of uPAR as a molecular target for therapy.
Materials and Methods
Cell culture
The invasive papillary thyroid carcinoma cell line BCPAP was purchased from DSMZ (Braunschweig, Germany), and was cultured and maintained in RPMI 1640 (Mediatech, Inc., Herndon, VA) supplemented with 10% fetal bovine serum (FBS) as previously described in reference Citation13. Where indicated, cells were treated with the MEK inhibitor U0126 (suspended in DMSO) at a final concentration of 10 µM for 12 hours; control cells were treated with DMSO only for the same amount of time.
siRNA transfection.
BCPAP cells were plated on 96-well plates or 75 cm2 flasks at a density of 104 cells/mL or 105 cells/mL, respectively. The media was replaced with Accell siRNA delivery media (containing 0.5% FBS) containing 1.5 µM siRNA oligonucleotide pools directed against uPAR or a non-targeting control scrambled siRNA which had been designed and confirmed to have minimal targeting toward known human genes (Dharmacon, Chicago, IL). Cells were also cultured in parallel using only the Accell media as an additional control. For protein and RNA studies, protein or RNA was isolated from transfected cells at 96 hours and 72 hours post-transfection, respectively. For cell proliferation studies, at 72 hours post-transfection, the media was replaced with standard RPMI 1640 (as described above). For cellular invasion/migration studies, cells were transferred to invasion/migration chambers at 72 hours post-transfection as described below.
RNA extraction/analysis and qRT-PCR.
Total RNA was isolated from cell cultures using TRIzol reagent (Invitrogen, Carlsbad, CA) according to the instructions of the supplier. RNA purity/concentration and integrity were evaluated as previously described in reference Citation13.
The Applied Biosystems 7900HT Real Time PCR system (AppliedBiosystems, Foster City, CA) and SuperScript III Platinum SYBR Green One-Step qRT-PCR system (Invitrogen) were employed for qRT-PCR. Primer sets for were purchased from Integrated DNA Technologies and designed using their PrimerQuest software (IDT, Coralville, IA). The reactions were performed using the following thermocycling conditions: 50°C for 5 min, 95°C for 15 min and 40 cycles of 95°C for 15 s, 60°C for 30 s, 72°C for 30 s. Samples were run in triplicate with test primer sets for uPAR (P1: 5′-AAG ATC ACC AGC CTT ACC GAG GTT-3′, P2: 5′-ATT CGA GGT AAC GGC TTC GGG AAT-3′) or the endogenous control glyceraldehyde-3-phosphate dehydrogenase (GAPDH) (P1: 5′-ACC ACA GTC CAT GCC ATC AC-3′, P2: 5′-TCC ACC ACC CTG TTG CTG TA-3′). Data were analyzed according to the comparative Ct method. qRT-PCR product specificity was verified by both agarose gel electrophoresis and melting curve analysis.
Western blot analysis.
Cell cultures were harvested, lysed, electrophoresed and transferred to Immobilon-P membranes (Millipore, Billeriac, MA) as previously described in reference Citation13. Membranes were blocked and incubated as previously described with mouse anti-human uPAR (R&D Systems, Minneapolis, MN), or rabbit anti-human ERK1/2, phospho-ERK1/2Thr202/Tyr204, focal adhesion kinase (FAK), phospho-FAKTyr397, p85 phosphatidylinositol-3-kinase (PI3K), Akt, phospho-AktSer473 or β-actin antibodies (Cell Signaling, Beverly, MA).Citation13 Membranes were subsequently washed and incubated with appropriate goat anti-mouse or goat anti-mouse IgG secondary antibodies (ThermoScientific, Rockford, IL), after which they were washed and developed as previously described in reference Citation13.
Colony-formation assay.
Control, non-targeting siRNA-treated and uPAR siRNA-treated BCPAP cells were plated in duplicate on 20 mm culture wells at a density of 200 cells/well. Culture medium was subsequently changed every 3 days. After 2 weeks, the resulting colonies were fixed and stained with 0.4% Crystal Violet and counted as a measure of clonogenicity.
Cell proliferation assay.
Control, non-targeting siRNA-treated and uPAR siRNA-treated BCPAP cells were plated in triplicate on 10 mm culture wells at a density of 5,000 cells/well. Parallel culture wells were harvested at 24, 48, 72 and 96-hours post-seeding, at which points the cells were trypsinized and counted via trypan blue exclusion, which also served as a measure of cell viability.
Laser scanning cytometry.
Dual-chambered Nunc Lab-Tek II slides (Fisher Scientific, Pittsburgh, PA) were seeded with 1.5 ml of 104 cells/mL cell suspension per chamber 24 h before siRNA transfection, which was performed for 96 hours as described above. At the end of incubation, the medium was replaced with 1 mL of 1% methanol-free formaldehyde in PBS, and the cells fixed at 4°C for 15 minutes. Following aspiration of the fixative, the chamber slides were disassembled and the fixed slides were stored in 70% ethanol at 4°C until analysis. Prior to fluorescence measurement, the cells were counterstained with 2.8 µg/ml 4,6-diamidino-2-phenylindole (DAPI; Sigma, St. Louis, MO) in PBS for 15 min.
The blue emission of DAPI-stained DNA was measured using a laser scanning cytometer (iCys; CompuCyte, Cambridge, MA) utilizing standard filter settings; fluorescence was excited with a 405 nm violet laser. The intensities of maximal pixel and integrated fluorescence were measured and recorded for each cell. At least 3,000 cells were measured per sample. The standard deviation was estimated based on Poisson distribution of cell populations. Other details of this methodology are presented in reference Citation16.
Senescence-associated β-galactosidase staining.
Control, non-targeting siRNA and uPAR-knockdown BCPAP cells were plated on 20 mm culture wells at a density of 20,000 cells/well. Senescence-associated β-galactosidase staining was then performed at pH 6 with a cellular senescence assay kit (Millipore, Billerica, MA) according to the instructions of the manufacturer. The kit detects β-galactosidase activity at pH 6, which is present only in senescent cells. Percentages of senescence-associated β-galactosidase-positive cells (which accumulate a distinctive blue-green staining pattern) were determined for each sample at 100x magnification using phase-contrast microscopy (average number of total cells counted per sample = 200).
Cellular migration and invasion assays.
To assess cell migration in vitro, control, non-targeting siRNA and uPAR siRNA-transfected BCPAP cells (25,000 cells in 500 µL RPMI 1640 without FBS) were placed in the top chamber of transwell migration chambers (8 µm BioCoat Control Inserts, Becton Dickinson Labware, Bedford, MA) and supplemented with PBS or recombinant human plasminogen (10 ng/µL; Sigma). The lower chamber was filled with 750 µL RPMI 1640 supplemented with 5% FBS. After 24 hours, non-migratory cells were removed from the upper surface of the transwell membrane with a cotton swab, and migratory cells on the lower membrane surface were fixed with methanol, stained with 1% toluidine blue (Acros), photographed and counted under (50x) magnification using brightfield microscopy.
To assess invasion, in vitro invasion assays were performed in the same manner as above, but in Matrigel-coated transwells (BioCoat Matrigel Invasion Chamber, Becton Dickinson Labware). All conditions were assayed in triplicate, and assays were performed twice.
Statistical analysis.
Data were analyzed using GraphPad Prism 5.0 (GraphPad, San Diego, CA) according to the Student's t-test.
Financial Support
This work was supported by grants from the National Cancer Institute (1R01CA131946-01A2) and the Department of Otolaryngology, New York Medical College, Valhalla, NY USA.
Figures and Tables
Figure 1 Effect of the MEK inhibitor U0126 on ERK1/2 phosphorylation (A) and uPAR mRNA levels (B) in BCPAP cells. Cells were treated with 10 µM U0126 for 12 hours, at which point protein and RNA were collected for immunoblotting or qRT-PCR, respectively, as described in Materials and Methods. uPAR mRNA levels are expressed as a fraction relative to GAPDH expression (i.e., 2−ΔCt). *indicates a significant (p < 0.05) decrease in uPAR mRNA levels relative to control BCPAP cells.
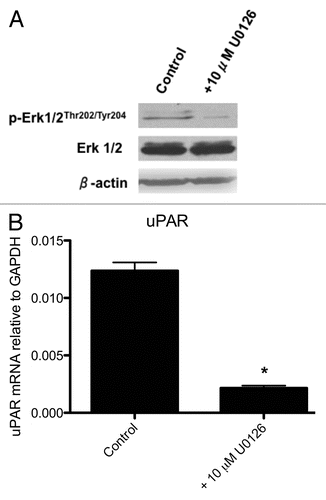
Figure 2 qRT-PCR (A) and western blot (B) analyses of uPAR expression in BCPAP control cells, non-targeting (NT) siRNA transfectants and uPAR siRNA transfectants. Cells were grown in Accell delivery media for at least 72 hours with the appropriate siRNA oligonucleotides as described in Materials and Methods. uPAR mRNA levels are expressed as a fraction relative to GAPDH expression (i.e., 2−ΔCt). *indicates a significant (p < 0.05) decrease in uPAR mRNA levels relative to control or NT-siRNA-transfected BCPAP cells. Data shown are representative of three experiments.
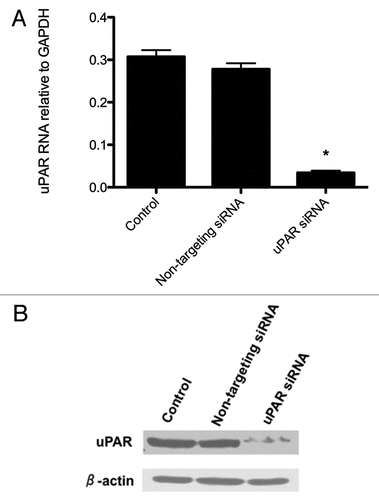
Figure 3 Downregulation of uPAR leads to decreased levels of p-FAKTyr397, PI3K and p-AktSer473. Protein lysates from control, non-targeting siRNA or uPAR siRNA-transfected BCPAP cells were subjected to SDS-PAGE and immunoblotted as described in Materials and Methods. Blots shown are representative of at least three experiments.
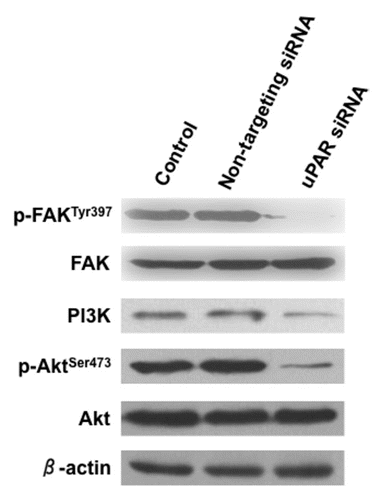
Figure 4 (A) Clonogenic assays demonstrating decreased ability of uPAR siRNA transfectant cells to form colonies compared to control or non-targeting (NT) siRNA transfectants. The accompanying graph summarizes (from independent replicate experiments) the colony-forming capacities of the various transfectants. *indicates a significantly lower (p < 0.05) number of colonies formed by the uPAR siRNA transfectants. (B) Effect of uPAR siRNA on BCPAP cell proliferation. Cells were grown in Accell delivery media with the appropriate siRNA for 72 hours, at which point the media was replaced with standard RPMI media (10% FBS) as described in Material and Methods. Cells counts were determined in triplicate for each time point via trypan blue exclusion. *indicates a significant difference (p < 0.05) in cell number for a given time-point.
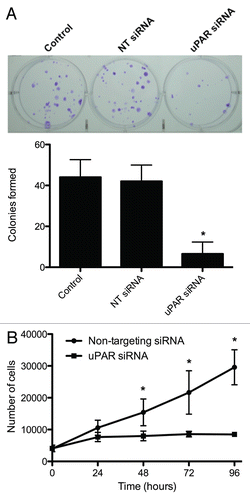
Figure 5 (A) Representative LSC-assisted morphometric analysis of nuclear changes of BCPAP cells transfected with non-targeting siRNA or uPAR siRNA. Intensity of maximal (max) pixel of DNA/DAPI reports degree of chromatin condensation and in untreated cells has the highest value. In the senescing cells, while nuclear area increases, the intensity of maximal pixel decreases, likely due to the “flattening” of the cell. The insets in the top left panels show DNA frequency histograms of cells from the respective cultures. (B) The bar plots show the mean values (±SD) of DNA/DAPI maximal pixel intenxity, nuclear DNA/DAPI area (in pixels), and the ratio of maximal pixel to nuclear area. The ratio of maximal pixel/nuclear area of the uPAR-siRNA cells is expressed as a fraction of the average ratio of the respective controls (which is set at 1.0). *indicates a significant difference (p < 0.05) in DAPI maximal pixel, DAPI area or ratio of DAPI maximal pixel/DAPI area. (C) Senescence-associated β-galactosidase staining (blue-green) in BCPAP cells transfected with non-targeting siRNA (NT-siRNA) or uPAR-siRNA for 96 hours. 67.3% (±4.3%) of BCPAP cells treated with uPAR-siRNA displayed positive staining for senescence-associated β-galactosidase, compared to 3.2% (±1.1%) of the NT-siRNA tranfectants (p < 0.01). Figures are representative of three separate experiments, each with similar results.
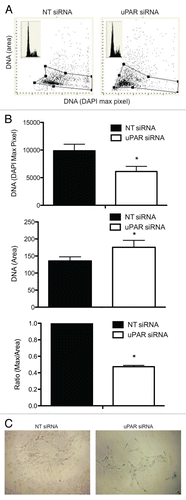
Figure 6 Effect of uPAR downregulation on BCPAP cell migration (A) and invasion (B). Cells were grown in Accell delivery media with the appropriate siRNA oligonucleotides for 72 hours, at which point they were trysinized and re-seeded in migration/invasion transwell chambers (with or without supplemental plasminogen) as described in Materials and Methods. uPAR siRNA-transfected BCPAP cells had significantly lower (*) migratory potentials than the corresponding non-targeting (NT) siRNA-transfected controls (p < 0.05). The plasminogen-supplemented NT siRNA-transfected BCPAP cells' increased invasiveness was statistically significant (*) when compared to the control NT siRNA-transfected and both populations of uPAR siRNA-transfected cells (p < 0.05). uPAR siRNA-trasnfected cells' invasiveness was also significantly lower (#) than the NT siRNA-transfectants', regardless of the presence or absence of plasminogen. Figures are representative of two separate experiments with similar results. P = plasminogen.
Acknowledgements
The authors wish to thank Dr. Radha Iyer for technical assistance with the qRT-PCR, as well as Melanie MacEwan for helpful discussions regarding the manuscript.
References
- Wartofsky L. Increasing world incidence of thyroid cancer: increased detection or higher radiation exposure?. Hormones (Athens) 2010; 9:103 - 108; PMID: 20687393
- Roh JL, Park JY, Park CI. Total thyroidectomy plus neck dissection in differentiated papillary thyroid carcinoma patients. Ann Surg 2007; 245:604 - 610; PMID: 17414610; http://dx.doi.org/10.1097/01.sla.0000250451.59685.67
- Lee YS, Lim YS, Lee JC, Wang SG, Kim IJ, Lee BJ. Clinical implication of the number of central lymph node metastasis in papillary thyroid carcinoma: preliminary report. World J Surg 2010; 34:2558 - 2563; PMID: 20703463; http://dx.doi.org/10.1007/s00268-010-0749-0
- Schlumberger MJ. Papillary and follicular thyroid carcinoma. N Engl J Med 1998; 338:297 - 306; PMID: 9445411
- Fagin JA, Tuttle RM, Pfister DG. Harvesting the low-hanging fruit: kinase inhibitors for therapy of advanced medullary and nonmedullary thyroid cancer. J Clin Endocrinol Metab 2010; 95:2621 - 2624; DOI: 20525911 PMID: 20525911
- Rubino C, de Vathaire F, Dottorini ME, Hall P, Schvartz C, Couette JE, et al. Secondary primary malignancies in thyroid cancer patients. Br J Cancer 2003; 89:1638 - 1644; PMID: 12973856; http://dx.doi.org/10.1038/sj.bjc.6601319
- Smith HW, Marshall CJ. Regulation of cell signaling by uPAR. Nat Rev Mol Cell Bio 2010; 11:23 - 36; PMID: 20027185; http://dx.doi.org/10.1038/nrm2821
- Gondi CS, Rao JS. Therapeutic potential of siRNA-mediated targeting of urokinase plasminogen activator, its receptor and matrix metalloproteinases. Methods Mol Biol 2009; 487:267 - 281; PMID: 19301652
- Soares P, Trovisco V, Rocha AS, Lima J, Castro P, Preto A, et al. BRAF mutations and RET/PTC rearrangements are alternative events in the etiopathogenesis of PTC. Oncogene 2003; 22:4578 - 4580; PMID: 12881714; http://dx.doi.org/10.1038/sj.onc.1206706
- Lengyel E, Wang H, Stepp E, Juarez J, Wang Y, Doe W, et al. Requirement of an upstream AP-1 motif for the constitutive and phorbol ester-inducible expression of the urokinase-type plasminogen activator receptor gene. J Biol Chem 1996; 271:23176 - 23184; PMID: 8798512; http://dx.doi.org/10.1074/jbc.271.38.23176
- Bessard A, Frémin C, Ezan F, Coutant A, Baffet G. MEK/ERK-dependent uPAR expression is required for motility via phosphorylation of P70S6K in human hepatocarcinoma cells. J Cell Physiol 2007; 212:526 - 536; PMID: 17427199; http://dx.doi.org/10.1002/jcp.21049
- Ulisse S, Baldini E, Toller M, Marchioni E, Giacomelli L, De Antoni E, et al. Differential expression of the components of the plasminogen activating system in human thyroid tumour derived cell lines and papillary carcinomas. Eur J Cancer 2006; 42:2631 - 2638; PMID: 16928445; http://dx.doi.org/10.1016/j.ejca.2006.04.017
- Nowicki TS, Kummer NT, Iacob C, Suslina N, Schaefer S, Schantz S, et al. Inhibition of uPAR and uPA reduces invasion in papillary thyroid carcinoma cells. Laryngoscope 2010; 120:1383 - 1390; PMID: 20578104; http://dx.doi.org/10.1002/lary.20915
- Schaller MD, Hildebrand JD, Shannon JD, Fox JW, Vines RR, Parsons JT. Autophosphorylation of the focal adhesion kinase, pp125FAK, directs SH2-dependent binding of pp60src. Mol Cell Biol 1994; 14:1680 - 1688; PMID: 7509446
- Chen HC, Appeddu PA, Isoda H, Guan JL. Phosphorylation of tyrosine 397 in focal adhesion kinase is required for binding phosphatidylinositol-3-kinase. J Biol Chem 1996; 271:26329 - 26334; PMID: 8824286; http://dx.doi.org/10.1074/jbc.271.42.26329
- Zhao H, Halicka HD, Traganos F, Jorgensen E, Darzynkiewicz Z. New biomarkers probing the depth of cell senescence assessed by laser scanning cytometry. Cytometry Part A 2010; 77:999 - 1007; PMID: 20939035; http://dx.doi.org/10.1002/cyto.a.20983
- Itahana K, Campisi J, Dimri GP. Methods to detect biomarkers of cellular senescence: the senescence-associated beta-galactosidase assay. Methods Mol Biol 2007; 371:21 - 31; PMID: 17634571
- Basolo F, Torregrossa L, Giannini R, Miccoli M, Lupi C, Sensi E, et al. Correlation between the BRAFV600E mutation and tumor invasiveness in papillary thyroid carcinomas smaller than 20 millimeters: Analysis of 1,060 Cases. J Clin Endocrinol Metab 2010; 95:4197 - 4205; PMID: 20631031; http://dx.doi.org/10.1210/jc.2010-0337
- Mesa C Jr, Mirza M, Mitsutake N, Sartor M, Medvedovic M, Tomlinson C, et al. Conditional activation of RET/PTC3 and BRAFV600E in thyroid cells is associated with gene expression profiles that predict a preferential role of BRAF in extracellular matrix remodeling. Cancer Res 2006; 66:6521 - 6529; PMID: 16818623; http://dx.doi.org/10.1158/0008-5472.can-06-0739
- Nguyen T, Menocal EM, Harborth J, Fruehauf JH. RNAi therapeutics: An update on delivery. Curr Opin Mol Ther 2008; 10:158 - 167; PMID: 18386228
- Rye PD, Stigbrand T. Interfering with cancer: a brief outline of advances in RNA interference in oncology. Tumor Biol 2004; 25:329 - 336; PMID: 15627900
- Wilda M, Fuchs U, Wössmann W, Borkhardt A. Killing of leukemic cells with a BCR/ABL fusion gene by RNA interference (RNAi). Oncogene 2002; 21:5716 - 5724; PMID: 12173041; http://dx.doi.org/10.1038/sj.onc.1205653
- Gondi CS, Kandhukuri N, Dinh DH, Gujrati M, Rao JS. Downregulation of uPAR and uPA activates caspase-mediated apoptosis and inhibits the PI3K/AKT pathway. Int J Oncol 2007; 31:19 - 27; PMID: 17549401
- Falasca M. PI3K/Akt signalling pathway specific inhibitors: A novel strategy to sensitize cancer cells to anti-cancer drugs. Curr Pharm Des 2010; 16:1410 - 1416; PMID: 20166984
- Liang X, Yang X, Tang Y, Zhou H, Liu X, Xiao L, et al. RNAi-mediated downregulation of urokinase plasminogen activator receptor inhibits proliferation, adhesion, migration and invasion in oral cancer cells. Oral Oncol 2008; 44:1172 - 1180; PMID: 18486529; http://dx.doi.org/10.1016/j.oraloncology.2008.03.004
- Cristofali VJ, Pignolo RJ. Replicative senescence of human fibroblast-like cells in culture. Physiol Rev 1993; 78:617 - 625; PMID: 8332640
- Hwang ES, Yoon G, Kang HT. A comparative analysis of the cell biology of senescence and aging. Cell Mol Life Sci 2009; 66:2503 - 2524; PMID: 19421842; http://dx.doi.org/10.1007/s00018-009-0034-2
- Darzynkiewicz Z, Traganos F, Melamed MR. New cell cycle compartments identified by multiparameter flow cytometry. Cytometry 1980; 1:98 - 108; PMID: 6170495
- Traganos F, Darzynkiewicz Z, Sharpless T, Melamed MR. Erythroid differentiation of Friend leukemia cells as studies by acridine orange staining and flow cytometry. J Histochem Cytochem 1979; 27:382 - 389; PMID: 86567
- Pospelova TV, Demidenko ZN, Bukreeva EI, Pospelov VA, Gudkov AV, Blagosklonny MV. Pseudo-DNA damage response in senescent cells. Cell Cycle 2009; 8:4112 - 4118; PMID: 19946210
- Darzynkiewicz Z. When senescence masquerades as DNA damage: is DNA replication stress the culprit?. Cell Cycle 2009; 8:3810 - 3811; PMID: 19887905
- Collado M, Medema RH, Garcia-Cao I, Dubuisson ML, Barradas M, Glassford J, et al. Inhibition of the phosphoinositide 3-kinase pathway induces a senescence-like arrest mediated by p27Kip1. J Biol Chem 2000; 275:21960 - 21968; PMID: 10791951; http://dx.doi.org/10.1074/jbc.M000759200
- Axanova LS, Chen YQ, McCoy T, Sui G, Cramer SD. 1,25-dihydroxyvitamin D(3) and PI3K/AKT inhibitors synergistically inhibit growth and induce senescence in prostate cancer cells. Prostate 2010; 70:1658 - 1671; PMID: 20583132; http://dx.doi.org/10.1002/pros.21201
- Sumikawa E, Matsumoto Y, Sakemura R, Fujii M, Ayusawa D. Prolonged unbalanced growth induces cellular senescence markers linked with mechano transduction in normal and tumor cells. Biochem Biophys Res Commun 2005; 335:558 - 565; PMID: 16083852; http://dx.doi.org/10.1016/j.bbrc.2005.07.106
- Korotchkina LG, Leontieva OV, Bukreeva EI, Demidenko ZN, Gudkov AV, Blagosklonny MV. The choice between p53-induced senescence and quiescence is determined in part by the mTOR pathway. Aging 2010; 2:344 - 352; PMID: 20606252
- Demidenko ZN, Shtutman M, Blagosklonny MV. Pharmacologic inhibition of MEK and PI-3K converges on the mTOR/S6 pathway to decelerate cellular senescence. Cell Cycle 2009; 8:1896 - 1900; PMID: 19478560
- Demidenko ZN, Zubova SG, Bukreeva EI, Pospelov VA, Pospelova TV, Blagosklonny MV. Rapamycin decelerates cellular senescence. Cell Cycle 2009; 8:1888 - 1895; PMID: 19471117
- Michaloglou C, Vredeveld LC, Soengas MS, Denoyelle C, Kuilman T, van der Horst CM, et al. BRAFE600-associated senescence-like cell cycle arrest of human naevi. Nature 2005; 436:720 - 724; PMID: 16079850; http://dx.doi.org/10.1038/nature03890
- Courtois-Cox S, Genther William SM, Reczek EE, Johnson BW, McGillicuddy LT, Johannessen CM, et al. A negative feedback signaling network underlies oncogene-induced senescence. Cancer Cell 2006; 10:459 - 472; PMID: 17157787; http://dx.doi.org/10.1016/j.ccr.2006.10.003