Abstract
Fidgetin is a member of the AAA protein superfamily with important roles in mammalian development. Here we show that human Fidgetin is a potent microtubule severing and depolymerizing the enzyme used to regulate mitotic spindle architecture, dynamics and anaphase A. In vitro, recombinant human Fidgetin severs taxol-stabilized microtubules along their length and promotes depolymerization, primarily from their minus-ends. In cells, human Fidgetin targets to centrosomes, and its depletion with siRNA significantly reduces the velocity of poleward tubulin flux and anaphase A chromatid-to-pole motion. In addition, the loss of Fidgetin induces a microtubule-dependent enlargement of mitotic centrosomes and an increase in the number and length of astral microtubules. Based on these data, we propose that human Fidgetin actively suppresses microtubule growth from and attachment to centrosomes.
Introduction
The ATPases associated with diverse cellular activities (AAA) protein superfamily consists of a broad spectrum of molecular chaperones that facilitate, among other things, proteolysis, membrane fusion, organelle biogenesis and regulation of the cytoskeleton.Citation1 Fidgetin (FIGN) is one of the more intriguing and mysterious members of the AAA protein superfamily,Citation2 which has been linked to various aspects of mammalian embryonic development.Citation3 Mice carrying mutations in the FIGN gene develop numerous defects of the ears, eyes and skeleton with an increased likelihood of forming cleft palates.Citation4,Citation5 The human FIGN gene also lies in a chromosomal region implicated in similar developmental disorders.Citation3 Unfortunately, FIGN’s underlying role in these defects remains unclear, as its biochemical activity and cellular functions have not yet been determined in mammals.
Although little information is available regarding the function of mammalian FIGN, studies of FIGN orthologs in invertebrates have revealed important roles in mitosis. It was recently found that Drosophila melanogaster FIGN localizes to mitotic centrosomes and regulates spindle microtubule (MT) flux (“Flux”).Citation6 Flux involves the persistent depolymerization of spindle pole associated MT minus-ends and provides a driving force for anaphase A chromatid-to-pole motion.Citation7 Shortly thereafter, C. elegans FIGN was shown to control progression through mitosis in the germline and early embryo.Citation8 Notably, fruit flies and worms each contain a single FIGN ortholog, while mammals have three: canonical FIGN and the closely related FIGN-like 1 and 2.Citation9
While not directly demonstrated, there is evidence to suggest that FIGN functions as a microtubule-severing enzyme.Citation6 Phylogenetic analysis groups FIGN and the FIGN-like proteins in the “meiotic” or subfamily 7 of AAA proteins.Citation2 This subfamily also includes Katanin and Spastin, which are known to utilize the energy from ATP hydrolysis to generate cuts along the MT lattice in vitro.Citation10,Citation11 Overexpression of Drosophila Fidgetin in tissue culture cells results in the destruction of the MT cytoskeleton.Citation6 Moreover, C. elegans Fidgetin has been shown to be an ATPase that binds to MTs in vitro.Citation8 However, both mouse and human FIGN contain unusual amino acid substitutions within their conserved Walker A and Walker B motifs, which mediate ATP binding and hydrolysis.Citation3,Citation5 Thus, it has been proposed that mammalian FIGN may have lost the ability to hydrolyze ATP and therefore is catalytically and functionally different from its invertebrate orthologs.
This study examines the in vitro activity and mitotic functions of human FIGN. We show that, in vitro, human FIGN has the capacity to sever MTs along their length and depolymerize their ends. Interestingly, FIGN-mediated end depolymerization is several fold faster at the minus-ends than at the plus-end. In cells, human FIGN targets to mitotic centrosomes and stimulates Flux and anaphase A. Finally, our data identify novel roles for human FIGN in the maintenance of centrosome morphology and normal astral MT array. Based on these data, we propose that human FIGN actively suppresses MT attachment to centrosomes.
Results
FIGN severs and depolymerizes MTs in vitro.
The ability of FIGN to sever MTs had not been demonstrated experimentally. To test this directly, we examined the activity of purified, baculovirus-expressed human FIGN () in a standard in vitro MT-severing assay. When incubated with taxol-stabilized rhodamine-labeled MTs, recombinant FIGN promoted the breakage of MTs in an ATP-dependent manner (; Movies S1 and S2). Severing was not observed when MTs were incubated with a FIGN construct carrying a point mutation (K523A) in its Walker A motif, which is required for ATP binding,Citation3 further supporting the hypothesis that Fidgetin-mediated MT severing reaction requires ATP hydrolysis (Fig. S1 and Movie S3). In this regard, FIGN is similar to the known MT-severing enzymes, Katanin and Spastin.Citation10,Citation11
Figure 1. Human FIGN severs and depolymerizes MTs in vitro. Coomassie-stained SDS PAGE gel showing the purity of the baculovirus-expressed human FIGN protein used for our in vitro assays. The FIGN band is indicated by an arrow. (B) Time series of TIRF images of rhodamine-labeled, taxol stabilized MTs adhered to coverslips and incubated with: ATP (no FIGN), ATP and recombinant human FIGN, AMPPNP and human FIGN, and Apyrase and human FIGN. Time (seconds) is indicated at the top of each column. Scale bar 10 µm. (C) Quantification of the frequency of MT severing events observed in the conditions described in panel in (B). n = 20 MTs in each condition. “Control” = ATP only. (D) Kymographs of a rhodamine-labeled MT (bottom) incubated with the plus-end directed motor, GFP-kinesin (top), and FIGN. GFP-kinesin always moved away from the MT end primarily depolymerized by FIGN. Thus, FIGN selectively depolymerizes MT minus-ends. Horizontal scale bar, 5 μm. (E) Quantification of (D), n = 89 MT plus ends and 132 MT minus ends.
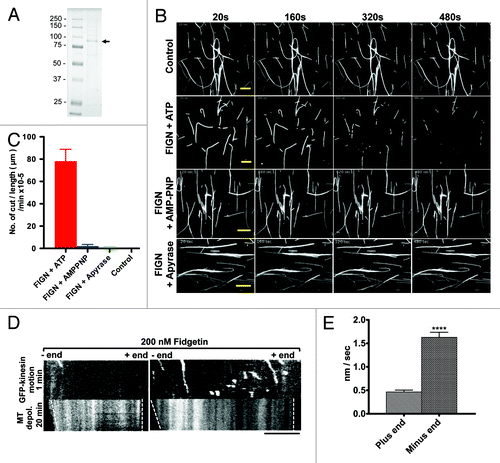
FIGN also displayed a pronounced ability to depolymerize MT ends. End depolymerization generally preceded initial severing events and was always more prominent at one end relative to the other. To determine whether FIGN selectively depolymerized MT plus- or minus-ends, taxol-stabilized, rhodamine-labeled MTs were incubated with both FIGN and GFP-kinesin, which moves toward MT plus-ends. These analyses clearly demonstrated a minus-end preference for FIGN-mediated MT depolymerization (). The average rate of FIGN-induced minus-end depolymerization was measured to be 1.629 ± 0.1061 nm/sec, while plus-end depolymerization occurred at an average rate of 0.4640 ± 0.04051 (; p < 0.0001 as determined by an unpaired Student t-test). We have found that the Drosophila Katanin ortholog, Kat-60, is also a potent MT end depolymerase in vitro,Citation12 but Kat-60 preferentially depolymerizes MT plus- not minus-ends. The basis for this difference is currently under investigation.
FIGN localizes to mitotic centrosomes.
As a first step towards understanding the cellular functions of human FIGN, we probed its localization in cultured U2OS cells using a polyclonal peptide antibody generated against human FIGN. After affinity purification, our anti-FIGN antibody recognized a single band on western blots of human U2OS cell lysates (), which was substantially reduced by 72 h of FIGN siRNA treatment (). Immunostaining revealed that FIGN localizes to centrosomes throughout mitosis and to the spindle midzone during telophase (). FIGN’s centrosomal localization persisted into interphase. Some nuclear staining was also observed in interphase cells, consistent with the results of an earlier study examining the localization of a GFP-tagged FIGN fusion protein in mouse NIH 3T3 cells.Citation9
Figure 2. Human FIGN localizes to mitotic centrosomes. (A) Western blot of U2OS cell lysate probed with our anti-human FIGN peptide antibody. (B) Western blot showing that the protein band recognized by our FIGN antibody is depleted by 72 h of FIGN siRNA treatment. Staining for tubulin (bottom) was used as a loading control. (C) Immunofluorescence micrograph of a human U20S cell double labeled for FIGN and α-tubulin (top and bottom) or γ-tubulin (middle). The top and middle panels show staining in metaphase cells while the bottom panel shows a cell in telophase. Scale bar 5 µm.
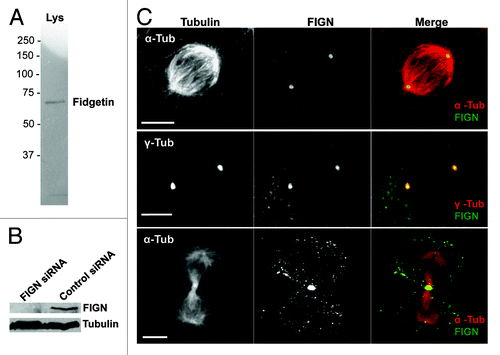
We previously reported that the FIGN ortholog in Drosophila also associates with mitotic centrosomes.Citation6 Thus, this aspect of the protein’s localization is highly conserved through evolution. However, Drosophila FIGN also associates with mitotic chromosomes through metaphase, a staining pattern that was not observed in our analyses of human FIGN.
FIGN stimulates poleward tubulin flux and anaphase A.
The capacity of human FIGN to depolymerize MT minus-end and its association with mitotic centrosomes raised the possibility that it impacts spindle dynamics by promoting Flux, a known activity of its counterpart in Drosophila.Citation6 Flux occurs from prometaphase through anaphase A and is believed to provide a driving force for chromatid-to-pole motility.Citation7 To visualize Flux in human cells, we generated a U2OS cell line stably expressing photoactivatable-GFP-α-tubulin (PA-GFP-tubulin) and transiently expressing mRFP-CENPB to allow simultaneous visualization of kinetochores. The rate of Flux was determined by tracking the poleward movement of the peak fluorescence of photo-activated bars within each half spindle (). For technical reasons, our analyses were focused specifically on metaphase spindles. Consistent with the hypothesis that human FIGN actively promotes Flux, we found that its depletion resulted in a significant (~33%) decrease in the Flux rate compared with controls: Flux rates decreased from 0.9 ± 0.09 µm/min in controls to 0.6 ± 0.06 µm/min in FIGN siRNA treated cells (; p < 0.005 as determined by an unpaired Student t-test).
Figure 3. Depletion of FIGN attenuates Flux and anaphase A. (A) Top panels show a metaphase spindle from a U2OS cell expressing mRFP-CENPB and PAGFP-α-tubulin before (left) and after (right) photoactivation. The bottom panels show the poleward movement of the PAGFP-α-tubulin at 20 sec intervals after photoactivation. (B) Representative profile plot showing fluorescence intensities of the PAGFP-α-tubulin bars at different time points after photoactivation. Rates of poleward flux were quantified using data such as these. (C) Graph showing the distribution of metaphase flux rates measured in control and FIGN siRNA cells. Each data point represents the average flux rate measured in a single cell. (D) Time-lapse images from a control and FIGN siRNA treated U2OS cells coexpressing GFP-γ-tubulin (indicated by yellow arrow) and GFP-CENPB (indicated by green arrow) during anaphase. Scale bar in the images is 5 µM. (E) Graph displaying the distribution of anaphase A rates measured in control and FIGN siRNA cells. Each data point represents the anaphase A rate measured for a single kinetochore. The movement of 4–7 kinetochores was measured in 10 control and FIGN siRNA treated cells.
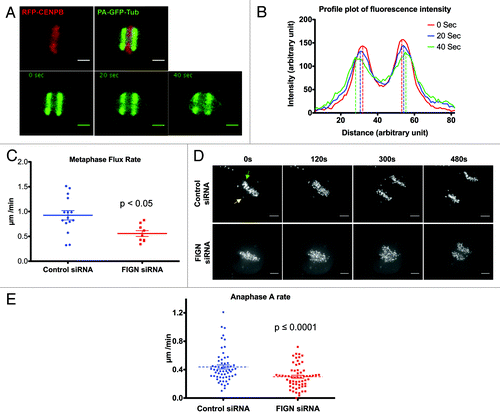
Unfortunately, we were unable to directly determine the influence of FIGN on Flux in anaphase spindles. However, we reasoned that since Flux is a component of anaphase A chromatid-to-pole motion, its suppression should manifest in a commensurate reduction in the rate of anaphase A. We therefore generated U2OS cells co-expressing GFP-γ-tubulin and GFP-CENPB to label centrosomes and kinetochores, respectively and determined anaphase A rates by measuring the distance between individual kinetochores and their associated centrosomes over time (). As expected, we observed a significant (~32%) attenuation of anaphase A in FIGN siRNA-treated cells (Movie S4 and S5). The average rate of anaphase A measured in control cells was 0.44 ± 0.03 µm/min, which was reduced to 0.3 ± 0.02 µm/ min (; p < 0.0001 as determined by an unpaired Student t-test). Although the percentage decrease in the rates of metaphase Flux and anaphase A resulting from FIGN knockdown are strikingly similar, the real magnitude of this reduction is somewhat different. The rate of Flux has been reported to decrease at the metaphase-to-anaphase transition in some cell types,Citation7 which could account for this difference. A second more interesting, but less likely, possibility is that a reduction in the rate of Flux in some way stimulates an increase in the active depolymerization of kinetochore-associated MT plus-ends known as “Pacman.” To our knowledge, such a scenario would be unprecedented.
Taken together with the results of our earlier analyses of Drosophila FIGN, these findings indicate a highly conserved role for FIGN in the stimulation of Flux and anaphase A. It has been proposed that the severing of centrosome-associated MTs from their nucleating γ-tubulin ring complexes promotes Flux and, in turn, anaphase A, by creating free MT minus-ends that are incorporated into the spindle pole where they serve as a substrate for kinesin-13-catalyzed depolymerization.Citation6 Indeed, kinesin-13s have been shown to stimulate Flux and anaphase A in both Drosophila and human cells.Citation13-Citation15 However, the results of our in vitro assays also raise the possibility that FIGN itself can depolymerize some MT minus-ends near the centrosome, as it is a potent MT minus-end depolymerase. Future studies examining the functional inter-relationships that exist among FIGN and the kinesin-13s should prove illuminating in this regard. Of course, based on these data alone, it is impossible to rule out the possibility that the depletion of FIGN reduces Flux by generally suppressing the dynamic behaviors of spindle MTs.
FIGN regulates the morphology, organization and dynamics of mitotic centrosomes.
During the course of our immunofluorescence analyses, we noticed that the depletion of FIGN resulted in pronounced alterations in the morphology of mitotic centrosomes. Most notably, we found that mitotic cells depleted of FIGN displayed a significant, 1.5-fold, increase in centrosome size as determined by immunostaining for γ-tubulin [(i); p < 0.001 as determined by an unpaired Student t-test]. The most obvious explanation for this is an increase in the recruitment of γ-tubulin and perhaps other components of the pericentriolar material, to mitotic centrosomes. However, somewhat to our surprise, we found that the increase in centrosome size caused by FIGN siRNA was accompanied by a ~50% decrease in the intensity of centrosome-associated γ-tubulin [(ii); p < 0.0001 as determined by an unpaired Student t-test]. Owing to this decrease, the total amount of γ-tubulin per centrosome was found to be statistically indistinguishable between control and FIGN siRNA-treated cells [(iii)].
Figure 4. Depletion of human FIGN results in enlarged centrosomes that display reduced rate of α-tubulin turnover. (A) Confocal images of γ-tubulin stained centrosomes from control and FIGN siRNA spindles. (B) Graphs quantifying the effect of FIGN knockdown on centrosome morphology: (i) FIGN depletion significantly increases the average area of centrosome-associated γ- tubulin immunofluorecece (ii) FIGN depletion decreases the average intensity of centrosome-associated γ-tubulin immunofluorescence (iii) The average total amount of centrosomal γ-tubulin immunofluorescence is statistically indistinguishable in control and FIGN siRNA treated cells. The number of cells analyzed is indicated in the bars shown in (i). (C) Time-lapse images showing fluorescence recovery after photobleaching of a mitotic centrosome from a metaphase U2OS cell expressing GFP-α-tubulin. Numbers denote time in seconds after the bleaching event. (D) Representative plots comparing GFP-α- tubulin fluorescence recovery at the photobleached centrosome of a metaphase spindle from a control and FIGN siRNA treated cell. (E) The turnover of centrosomal α-tubulin is significantly slower in FIGN depleted cells (t1/2 = 16s) in comparison with the controls (t1/2 = 11s). The respective number of centrosomes analyzed in each condition is indicated in the graph bars.
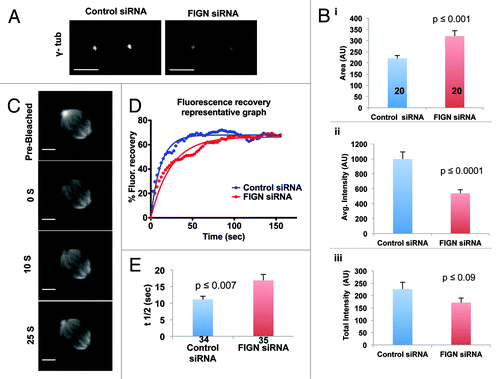
One explanation for these data are that a decrease in the activity of FIGN induces a stretching of the PCM. It is possible that a reduction in the ability of centrosomes to release MTs alters the MT-generated forces to which the organelle is exposed. If so, then the observed changes in centrosome morphology should be entirely dependent upon the presence of MTs. To test this, the above analyses of centrosome morphology were repeated in cells treated with nocodazole to depolymerize MTs. Under these conditions, FIGN siRNA had no impact on centrosome size or the intensity of centrosome-associated γ-tubulin (Fig. S2A and B). Thus, FIGN impacts centrosome size and organization through MTs.
It is presently impossible to directly test the hypothesis that FIGN actively severs and releases MTs from the centrosomes of intact mitotic spindles—the density of spindle MTs is simply too high for such events to be directly visualized. However, if FIGN were to carry out such a function, then a reasonable expectation is that its depletion would attenuate the turnover of tubulin from centrosomes. This rate can be directly determined in U2OS cells expressing GFP-α-tubulin using fluorescence recovery after photobleaching (FRAP) (). FRAP analyses performed on these cells revealed that the turnover of α-tubulin at centrosomes was significantly slower in FIGN-depleted cells (t1/2 = 16 sec) as compared with the controls (t1/2 = 11 sec) (; p = 0.007 as determined by an unpaired Student t-test). In both cases, α-tubulin recovered to ~68% of pre-bleached levels (). FIGN’s ability to regulate α-tubulin turnover at centrosomes is consistent with our hypothesis that it is required to release MTs from the centrosomes which we believe is central to its role in the stimulation of Flux and anaphase A.
FIGN regulates astral MTs in metaphase spindles.
Finally, we examined whether the depletion of FIGN altered other aspects of spindle morphology. We observed no significant change in spindle length (data not shown) or in the density or distribution of MTs within the central spindle, as indicated by quantitative analysis of α-tubulin immunofluorescence (). However, we consistently observed an increase in the array of centrosomal MTs oriented away from the central spindle known as astral MTs. Comparison of anti-α-tubulin immunofluorescence within the astral regions of metaphase spindles revealed an average ~1.5-fold increase following FIGN siRNA (; p < 0.005 as determined by an unpaired Student t-test). Interactions between astral MTs and the cell cortex are believed to be important for determining the position of the spindle and the site of cell cleavage.Citation16,Citation17
Figure 5. FIGN siRNA increases astral MTs density in metaphase spindles. (A) Confocal images showing representative metaphase spindles from control and FIGN siRNA treated cells immunostained for tubulin. The control spindle has been subdivided into 12 equal segments (red) using MatLab and the astral region of the FIGN siRNA spindle has been is outlined in the white polygon. Scale bar 5 µm. (B) Region by region comparison of the average tubulin immunofluorescence intensity measured along the lengths of metaphase spindles from control and FIGN siRNA-treated cells. Division of the spindles for these analyses is shown in panel A. Twelve control and 12 FIGN siRNA spindles were analyzed. (C) Graph showing the average intensity of α-tubulin immunofluorescence within the astral regions (see panel A) of 12 control and 12 FIGN siRNA-treated metaphase spindles. (D) Still images of a living metaphase U2OS cell expressing EB3-GFP. The behaviors of EB3-GFP comets contained within the astral region were tracked (red circles in the bottom panel) over time. Scale bar 5 µm. (E) Graph showing the distribution of the average number of astral EB3-GFP comets/second tracked within eight control and eight FIGN siRNA treated metaphase spindles.
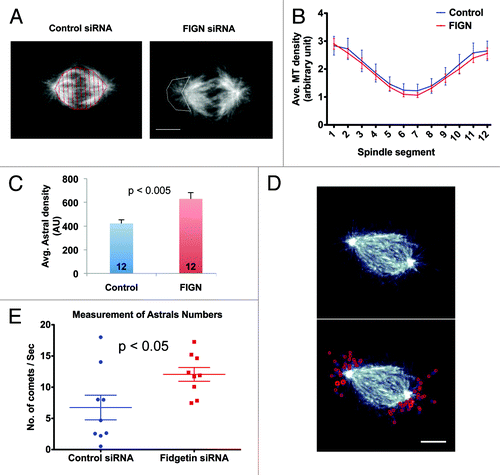
To better understand the basis for this difference, we tracked astral MT behaviors in cells expressing EB3‑GFP, which labels polymerizing MT plus-endsCitation18 (Fig. S3 and Movie S6). FIGN siRNA had essentially no impact on astral MT growth rates or lifespan (not shown). However, similarly to our analyses of fixed cells, we measured a significant ~1.7-fold increase in the average number of GFP-EB3 comets within the astral regions of metaphase spindles after FIGN siRNA (; p <0.05 as determined by an unpaired Student t-test). The depletion of FIGN also increased the probability at which GFP-EB3 comet trajectories initiated within and escaped from the immediate vicinity of the centrosome (Fig. S3).
Discussion
In light of our findings, we propose that FIGN normally suppresses the growth of astral MTs in the same way that it promotes flux, by severing and/or depolymerizing a subset of MTs shortly after their nucleation at centrosomes. The different outcome for the MT is determined by the local environment into which it is released. Within the central spindle, the severed MT can be quickly stabilized by motor and non-motor MT cross-linkers, which allow its incorporation into the spindle pole. In contrast, the reduced concentration or absence of these factors in the region of astral regions allows newly severed MTs to rapidly depolymerize.
In conclusion, the results of this study provide the first demonstration that human FIGN is a MT-severing enzyme and depolymerase that regulates multiple aspects of mitosis probably through its conserved localization to centrosomes. In many regards, it is functionally similar to its ortholog in Drosophila, as both proteins stimulate Flux and contribute to anaphase A.Citation6 However, human FIGN also contributes to mitosis in ways not apparent in Drosophila, such as its regulation of astral MT arrays. Defects in any of these events could induce the formation of aneuploid and/or polyploid cells,Citation19,Citation20 which has been proposed to be an initial step in tumorigenesis. Moreover, defects in spindle positioning and cytokinesis resulting from aberrations in the organization astral MTs may provide a cell-level mechanism to explaining the developmental defects observed in FIGN mutant mice. In both regards, it will be important to examine potential links between FIGN and human diseases. Finally, although not addressed in this study, FIGN may also function outside of mitosis. For example, severing of MTs from centrosomes has been proposed as an important component of efficient cell migration and neuronal development.Citation21,Citation22 We hope that the results presented here provide a starting point for examining FIGN’s roles in these and other cellular processes.
Materials and Methods
Expression and purification of recombinant human FIGN and in vitro MT severing assay.
Full-length human FIGN (NP_060556.2) was cloned into pFastBac HTA (Invitrogen) vector and expressed using the Bac-to-Bac Baculovirus Expression System. For purification of the 6xHis-tagged-FIGN, infected cells were lysed in resuspension buffer (50 mM Tris, pH 6.8, 250 mM NaCl, 5 Mm MgCl2, 50 µM ATP, 1 mM PMSF, 7 mM b-mercaptoethanol, 15 U aprotinin, 10% sucrose) using EmulsiFlex homogenizer (Avestin). Lysates were centrifuged for 45 min at 45,000 rpm, and the supernatant was passed through 1 ml nickel resin (Qiagen) at 4°C. 6xHis-tagged human FIGN protein was eluted with 500 mM imidazole in resuspension buffer without PMSF and further purified in a size exclusion FPLC column (HiPrep 16/60 Sephacryl S-200 column, Amersham) equilibrated beforehand with severing buffer I (20 mM HEPES, pH 7.0, 300 mM NaCl, 3 mM MgCl2, 10% sucrose, 50 µM ATP, 5 mM DTT).
Rhodamine-labeled, taxol-stabilized non-polarity or polarity-marked MTs were prepared according to an online protocol (Mitchison Lab protocols) and immobilized on the glass surface in a flow chamber with a G234A mutant of human kinesin. The assay was performed in severing buffer II (20 mM HEPES, pH 7.0, 100 mM NaCl, 3 mM MgCl2, 10% sucrose, 2 mM ATP, 10 mM DTT, 7.5 mg/ml BSA) at room temperature. An anti-bleaching system containing 2.5 mM protocatechuic acid (PCA), 10 nM protocatechuate-3, 4-dioxygenase (PCD) and 1 mM Trolox (an water soluble vitamine E analog) was used to minimize photodamage (Aitken et al. 2008). FIGN protein was introduced into the flow chamber, and time-lapse images of the fluorescent MTs were captured every 20 sec using a TIRF microscope with a 63x, 1.4NA objective. Control assays were performed either without FIGN and with Walker A mutant FIGN in presence of ATP or incubating the wild-type FIGN with 2 mM AMP-PNP or 5 unit/ml apyrase instead of ATP. Digital images were analyzed using ImageJ software. MT-severing frequencies were calculated by counting the number of breakages per unit length of MTs in unit time.
Antibody production.
Our human FIGN antibody was generated in rabbit against a specific peptide sequence (GKY TSP VMS EHG DEH RQL LS) (Proteintech). Antibodies were affinity purified using a mixture of Affigel 10 and 15 resin coupled to this peptide.
Immunofluorescence microscopy.
Cells growing on coverslips were fixed in 100% methanol at -20°C for 2 h and immunostained with various antibodies following standard procedures.
FIGN antibody was applied at 6 mg/ml final concentration in blocking buffer (5% normal goat serum in PBS with 0.1% TritonX-100). Other primary antibodies used were anti-α-tubulin (clone DM1A, Sigma-Aldrich, T9026), anti-γ-tubulin (clone GTU88, Sigma-Aldrich, T6557) and rabbit polyclonal anti-α-tubulin (Abcam). Secondary antibodies conjugated with the fluorophores Cy2 or rhodamine (Jackson ImmunoResearch Laboratories) were used at a final concentration of 7.5 mg/ml. Cells were imaged using Ultraview spinning-disk confocal microscope (PerkinElmer) with a 100x, 1.4 NA objective attached to a digital camera (Orca ER; Hamamatsu). Confocal images are displayed as the maximum intensity projections of all captured z planes. To measure the density of centrosomal γ-tubulin, an area was drawn around the centrosome, and the average fluorescence intensity within this area was measured using ImageJ. Background fluorescence was subtracted. Both control and FIGN-depleted cells were imaged and measured in the exact same way. To disassemble MTs, cells were treated with 0.2 mg/ ml nocodazole for 16 h before fixation.
Human cell culture and siRNA treatment.
U2OS cells were obtained from ATCC and cultured at 37°C in Dulbecco’s modified Eagle’s medium containing 10% fetal-bovine serum, 1% Glutamax, penicillin/streptomycin in presence of 5% CO2. U2OS cells, expressing GFP-α tubulin or photoactivatable-GFP-α-tubulin (gift from D.A. Compton) were maintained under selection pressure using G418 antibiotic in the above-mentioned media.
To knockdown human FIGN, double-stranded siRNA oligonucleotides (Dharmacon, ON-TARGETplus set of four) were transfected with Lipofectamine 2000 (Invitrogen) following standard protocol.
Live cell imaging and anaphase A rate measurement.
After 72 h of siRNA treatment, U2OS cells co-expressing GFP-γ-tubulin and GFP-CENPB (a gift from L.M. Wordeman) were imaged using a 4D spinning-disk confocal microscope (PerkinElmer) with a 100x, 1.4 NA objective and a digital camera (Orca ER; Hamamatsu) including an environmental chamber. Images were captured at 20 sec intervals as a stack of 10–15 Z optical planes (1 µm thick) encompassing the whole spindle. Maximum intensity projections of the Z planes were used for the measurement of anaphase A. Anaphase A rates were calculated by measuring the change in distance between the kinetochore and the associated centrosome over time using ImageJ.
Measurement of flux motility rate.
Both control and FIGN siRNA-treated U2OS cells expressing photo-activatable GFP-α-tubulin were transfected with RFP-CENPB and imaged 24 h post-transfection using Zeiss Live Duoscan System (AIM 4.2, Zeiss) mounted on Nikon inverted microscope with a 63x, 1.4 NA objective equipped with a heated stage and a dual 512 pixel linear CCD camera. A narrow bar was photo-activated using 405 lasers just above the kinetochores in each half spindle and time-lapse images were captured at 5 sec intervals for a single Z plane. Fluorescence intensity profiles of the activated tubulin bars were plotted for every time point by using ImageJ, and the distances between the positions of two peak intensities were calculated. Flux rates were determined by measuring the change in distance between the two activated tubulin bars over time.
Fluorescence recovery after photobleaching.
To measure α-tubulin turnover, photobleaching was performed on mitotic centrosomes in control and FIGN-depleted U2OS cells stably expressing GFP-α-tubulin, using Zeiss Live Duoscan System (AIM 4.2, Zeiss) with a 63x, 1.4NA objective. Upon photobleaching with 488 nm laser, time-lapse images were captured at 2.5 sec intervals in a single z-plane. Pre-bleached and post-bleached fluorescence intensities were measured at the bleached region for each time point using ImageJ software, and the recovery curves were plotted using GraphPad Prism5 software. The half-time of fluorescence recovery [t1/2 = ln(2)/k] was calculated for each photo-bleached region using nonlinear curve fit equation [one phase exponential association: y(t) = A (1 - e-kt)], where y is the measured fluorescence within the region-of-interest at time point t, A is the end point of fluorescence recovery and k is the rate constant. Fluorescence intensities of the whole cells were also measured for each corresponding time point for adjusting the post-bleach fluorescence loss due to imaging.
Measurement of spindle morphology.
Control and FIGN-depleted cells were fixed using 100% methanol at -20°C and immunostained for tubulin (DM1A, Sigma). Metaphase spindles were imaged using a 4D spinning disk confocal microscope (PerkinElmer) with a 100x, 1.4NA objective. The average MT density of the central spindle and the astral regions was measured using ImageJ. An area closely associated with the centrosom was drawn and astral MT density was determined by measuring the average fluorescence intensity per unit area. A Matlab program was used to dissect the central spindle into 12 equal segments and the average fluorescence intensity of each segment was measured for a region-by-region comparison of MT density.
Control and FIGN-depleted U2OS cells were transfected with EB3-GFP constructs to label growing MT tips and imaged 20 h post-transfection using 4D spinning disk confocal microscope with a 100x 1.4NA objective at 37°C. Astral MTs were analyzed using an inhouse automated tracking method. Total number of astral comets was counted for a period of time, and number of astrals per unit time was determined.
| Abbreviations: | ||
| AU | = | arbitrary unit |
| FIGN | = | fidgetin |
| MT | = | microtubule |
Additional material
Download Zip (26.5 MB)Acknowledgements
S.M., U.R. and D.J.S. were supported by NIH grant #R01GM065940. S.S., J.M. and A.M. were supported by NIH grant #R01GM086536.
Disclosure of Potential Conflicts of Interest
No potential conflicts of interest were disclosed.
Note
Supplemental material can be found at: www.landesbioscience.com/journals/cc/article/20849
Related Research Data
References
- Lupas AN, Martin J. AAA proteins. Curr Opin Struct Biol 2002; 12:746 - 53; http://dx.doi.org/10.1016/S0959-440X(02)00388-3; PMID: 12504679
- Frickey T, Lupas AN. Phylogenetic analysis of AAA proteins. J Struct Biol 2004; 146:2 - 10; http://dx.doi.org/10.1016/j.jsb.2003.11.020; PMID: 15037233
- Cox GA, Mahaffey CL, Nystuen A, Letts VA, Frankel WN. The mouse fidgetin gene defines a new role for AAA family proteins in mammalian development. Nat Genet 2000; 26:198 - 202; http://dx.doi.org/10.1038/79923; PMID: 11017077
- Truslove GM. The anatomy and development of the fidget mouse. J Genet 1956; 54:64 - 86; http://dx.doi.org/10.1007/BF02981704
- Yang Y, Mahaffey CL, Bérubé N, Frankel WN. Interaction between fidgetin and protein kinase A-anchoring protein AKAP95 is critical for palatogenesis in the mouse. J Biol Chem 2006; 281:22352 - 9; http://dx.doi.org/10.1074/jbc.M603626200; PMID: 16751186
- Zhang D, Rogers GC, Buster DW, Sharp DJ. Three microtubule severing enzymes contribute to the “Pacman-flux” machinery that moves chromosomes. J Cell Biol 2007; 177:231 - 42; http://dx.doi.org/10.1083/jcb.200612011; PMID: 17452528
- Rogers GC, Rogers SL, Sharp DJ. Spindle microtubules in flux. J Cell Sci 2005; 118:1105 - 16; http://dx.doi.org/10.1242/jcs.02284; PMID: 15764594
- Luke-Glaser S, Pintard L, Tyers M, Peter M. The AAA-ATPase FIGL-1 controls mitotic progression, and its levels are regulated by the CUL-3MEL-26 E3 ligase in the C. elegans germ line. J Cell Sci 2007; 120:3179 - 87; http://dx.doi.org/10.1242/jcs.015883; PMID: 17878235
- Yang Y, Mahaffey CL, Bérubé N, Nystuen A, Frankel WN. Functional characterization of fidgetin, an AAA-family protein mutated in fidget mice. Exp Cell Res 2005; 304:50 - 8; http://dx.doi.org/10.1016/j.yexcr.2004.11.014; PMID: 15707573
- McNally FJ, Vale RD. Identification of katanin, an ATPase that severs and disassembles stable microtubules. Cell 1993; 75:419 - 29; http://dx.doi.org/10.1016/0092-8674(93)90377-3; PMID: 8221885
- Roll-Mecak A, Vale RD. The Drosophila homologue of the hereditary spastic paraplegia protein, spastin, severs and disassembles microtubules. Curr Biol 2005; 15:650 - 5; http://dx.doi.org/10.1016/j.cub.2005.02.029; PMID: 15823537
- Zhang D, Grode KD, Stewman SF, Diaz-Valencia JD, Liebling E, Rath U, et al. Drosophila katanin is a microtubule depolymerase that regulates cortical-microtubule plus-end interactions and cell migration. Nat Cell Biol 2011; 13:361 - 70; http://dx.doi.org/10.1038/ncb2206; PMID: 21378981
- Ganem NJ, Compton DA. The KinI kinesin Kif2a is required for bipolar spindle assembly through a functional relationship with MCAK. J Cell Biol 2004; 166:473 - 8; http://dx.doi.org/10.1083/jcb.200404012; PMID: 15302853
- Rath U, Rogers GC, Tan D, Gomez-Ferreria MA, Buster DW, Sosa HJ, et al. The Drosophila kinesin-13, KLP59D, impacts Pacman- and Flux-based chromosome movement. Mol Biol Cell 2009; 20:4696 - 705; http://dx.doi.org/10.1091/mbc.E09-07-0557; PMID: 19793918
- Rogers GC, Rogers SL, Schwimmer TA, Ems-McClung SC, Walczak CE, Vale RD, et al. Two mitotic kinesins cooperate to drive sister chromatid separation during anaphase. Nature 2004; 427:364 - 70; http://dx.doi.org/10.1038/nature02256; PMID: 14681690
- Manneville JB, Etienne-Manneville S. Positioning centrosomes and spindle poles: looking at the periphery to find the centre. Biol Cell 2006; 98:557 - 65; http://dx.doi.org/10.1042/BC20060017; PMID: 16907664
- Rankin KE, Wordeman L. Long astral microtubules uncouple mitotic spindles from the cytokinetic furrow. J Cell Biol 2010; 190:35 - 43; http://dx.doi.org/10.1083/jcb.201004017; PMID: 20603328
- Stepanova T, Slemmer J, Hoogenraad CC, Lansbergen G, Dortland B, De Zeeuw CI, et al. Visualization of microtubule growth in cultured neurons via the use of EB3-GFP (end-binding protein 3-green fluorescent protein). J Neurosci 2003; 23:2655 - 64; PMID: 12684451
- Eggert US, Mitchison TJ, Field CM. Animal cytokinesis: from parts list to mechanisms. Annu Rev Biochem 2006; 75:543 - 66; http://dx.doi.org/10.1146/annurev.biochem.74.082803.133425; PMID: 16756502
- Jallepalli PV, Lengauer C. Chromosome segregation and cancer: cutting through the mystery. Nat Rev Cancer 2001; 1:109 - 17; http://dx.doi.org/10.1038/35101065; PMID: 11905802
- Abal M, Piel M, Bouckson-Castaing V, Mogensen M, Sibarita JB, Bornens M. Microtubule release from the centrosome in migrating cells. J Cell Biol 2002; 159:731 - 7; http://dx.doi.org/10.1083/jcb.200207076; PMID: 12473683
- Ahmad FJ, Yu W, McNally FJ, Baas PW. An essential role for katanin in severing microtubules in the neuron. J Cell Biol 1999; 145:305 - 15; http://dx.doi.org/10.1083/jcb.145.2.305; PMID: 10209026