Abstract
Ectopic viral integration site 1 (EVI1), a transcription factor frequently overexpressed in myeloid neoplasias, has been implicated in the generation of malignancy-associated centrosomal aberrations and chromosomal instability. Here, we sought to investigate the underlying cause of centrosome amplification in EVI1-overexpressing cells. We found that overexpression of EVI1-HA in U2OS cells induced supernumerary centrosomes, which were consistently associated with enlarged nuclei or binuclear cells. Live cell imaging experiments identified cytokinesis failure as the underlying cause of this phenotype. In accordance with previous reports, EVI1 overexpression induced a partial cell cycle arrest in G0/1 phase, accompanied by elevated cyclin D1 and p21 levels, reduced Cdk2 activity and activation of the p53 pathway. Supernumerary centrosomes predominantly occurred in resting cells, as identified by low levels of the proliferation marker Ki-67, leading to the conclusion that they result from tetraploidization after cytokinesis failure and are confined to G0/1-arrested tetraploid cells. Depletion of p53 using siRNA revealed that further polyploidization of these cells was inhibited by the p53-dependent tetraploidy checkpoint.
Introduction
A hallmark of cancer is genomic instability providing a selective advantage to the malignant clone.Citation1,Citation2 Its most frequent form is chromosomal instability.Citation1 In myeloid neoplasms, chromosomal instability may often manifest in autosomal monosomies and is associated with a poor prognosis.Citation3-Citation5
Ectopic viral integration site 1 (EVI1), which encodes a zinc finger transcription factor and is expressed in several mRNA splice variants including MDS1-EVI1, was originally identified as a common retroviral integration site whose induction leads to myeloid leukemias in mice.Citation6 EVI1 overexpression has been found in some solid tumors and, at frequencies ranging between 10% and more than 50%, in myeloid neoplasias.Citation7-Citation15 High EVI1 expression levels predict poor survival in patients with de novo acute myeloid leukemia.Citation9 Recurrent chromosomal rearrangements involving chromosome band 3q26 where EVI1 is located, and which are often associated with monosomy 7,Citation16-Citation18 have been described in myeloid neoplasms.Citation19-Citation27 Recently, insertional activation of EVI1 has been identified in two patients who developed myelodysplasia after gene therapy using a retroviral vector.Citation16 Remarkably, this was associated with progressive dominance of a transduced clone displaying monosomy 7 in both subjects.Citation16 In addition, EVI1-expressing cells showed increased levels of phosphorylated histone H2AX, a marker of DNA damage, while stable transduction of human BJ fibroblasts with EVI1 led to increased frequencies of cells with supernumerary centrosomes.Citation16 Altogether, these data support the notion that EVI1 overexpression in myeloid neoplasias may promote malignant growth by inducing chromosomal instability.
Published evidence suggests that EVI1 stimulates cellular proliferation and acts as an anti-apoptotic factor, which may involve inhibition of JNK and activation of PI3K/AKT signaling.Citation28-Citation31 In addition, EVI1 interferes with differentiation of hematopoietic cell lineages.Citation28 However, there is no unifying model of EVI1 function so far and, somewhat counterintuitively, in some cell types, EVI1 overexpression causes cell cycle arrest in G0/1 phase.Citation32,Citation33 Also, with respect to EVI1-induced chromosomal instability, no mechanistic explanation exists. Since centrosomal aberrations have been found in EVI1-overexpressing cells,Citation16 it seems reasonable to assume centrosome amplification as one underlying cause of EVI1-induced chromosomal instability.
Detailed examination of human cells manipulated to harbor extra centrosomes by means of tetraploidization or induction of centrosome overduplication by Plk4 overexpression revealed that centrosome amplification leads to increased rates of chromosome missegregation, which was proposed as a common underlying cause of chromosomal instability in human cancer.Citation34 In addition, supernumerary centrosomes have been shown to induce tumor formation in vivo at least in flies.Citation35 Moreover, centrosome amplification is common in a wide range of solid and hematological neoplasms.Citation36 However, different mechanisms of origin of cancer-associated centrosomal aberrations may exist: in addition to centrosome overduplicationCitation37-Citation41 and DNA damage-induced centrosome amplification,Citation42-Citation44 supernumerary centrosomes may arise secondary to mitotic defects with subsequent polyploidization of both the cellular DNA and centrosome content.Citation45
In the present work, we sought to investigate the underlying cause of centrosome amplification in EVI1-overexpressing U2OS cells. We found that overexpression of EVI1 led to reduced proportions of actively cycling cells and accumulation of cells in G0/1 phase of the cell cycle, with supernumerary centrosomes arising as a consequence of tetraploidization caused by a cytokinesis defect.
Results
Overexpression of EVI1 leads to supernumerary centrosomes
For mechanistic insights into the emergence of supernumerary centrosomes in EVI1-overexpressing cells, the human osteosarcoma cell line U2OS was used to generate cells stably expressing EVI1-HA (U2OS-EVI1-HA cells) in a tetracycline-inducible fashion. Seventy-two hours after tetracycline addition, immunofluorescence staining using an antibody to HA indicated that EVI1-HA localized in the nucleus, whereas uninduced cells showed no EVI1-HA-specific signals (). Immunoblotting for EVI1-HA confirmed the induction of EVI1-HA (145 kDa) expression after tetracycline addition in comparison to uninduced U2OS-EVI1-HA cells and parental U2OS cells (). Consistent with previous results,Citation16 immunostaining for the centrosomal marker γ-tubulin revealed increased amounts of cells with supernumerary centrosomes in response to EVI1 overexpression (). Quantification of cells with more than two centrosomes demonstrated centrosome amplification in 12.0 ± 2.16% of cells induced to overexpress EVI1-HA for 48 h as compared with 5.75 ± 0.95% in uninduced controls (p = 0.0055). After 72 h of EVI1-HA overexpression, the proportion of cells with amplified centrosomes rose to 16.75 ± 1.7% as compared with 5.25 ± 0.95% in uninduced controls (p = 0.0001; ). Hence, EVI1 overexpression leads to centrosome amplification.
Figure 1. Overexpression of EVI1 leads to centrosomal aberrations. (A) In U2OS cells conditionally overexpressing EVI1-HA, transgene expression was induced for 72 h. Cells were immunostained for HA (red). DNA was counterstained with DAPI (blue). Scale bars represent 10 μm. (B) Overexpression of EVI1-HA was induced for 48 or 72 h, followed by immunoblotting for EVI1-HA or the loading control actin using 50 µg of protein extract from parental U2OS cells, uninduced (-TET) and induced (+TET) U2OS cells conditionally overexpressing EVI1-HA. (C) In U2OS cells conditionally overexpressing EVI1-HA, transgene expression was induced for 72 h. Parental U2OS cells, uninduced (-TET) and induced (+TET) U2OS cells conditionally overexpressing EVI1-HA were immunostained for γ-tubulin (green) and EVI1-HA (red). DNA was counterstained with DAPI (blue). Scale bars represent 10 μm. Insets show centrosomes at higher magnification. (D) U2OS cells conditionally overexpressing EVI1-HA were left untreated (-TET) or induced to express the transgene for 48 or 72 h (+TET). Parental U2OS cells were grown in parallel. Following immunostaining as in (C), percentages of cells with more than two centrosomes were quantified in 4 × 100 cells per data bar. ***, this difference is highly significant (p = 0.00011). **, this difference is significant (p = 0.0055). (E) U2OS cells conditionally overexpressing EVI1-HA and parental U2OS cells were transfected with CETN2-Dendra2 (green). Twenty-four h later, transgene expression was induced where indicated (+TET). Cells were harvested 72 h after transgene induction and immunostained for γ-tubulin (red). DNA was counterstained with DAPI (blue). Scale bars represent 10 μm. Insets show centrosomes at higher magnification. (F) The observations shown in (E) were quantified by evaluating 3 × 50 transfected cells per data bar, which were categorized as specified in the figure. ***, this difference is highly significant (p = 0.00097).

To determine centriole numbers in EVI1-overexpressing cells harboring amplified centrosomes, we transiently transfected U2OS-EVI1-HA cells with the centriole marker CETN2-Dendra2. Interestingly, amplified centrosomes in response to EVI1 overexpression almost invariably contained just one centriole per γ-tubulin signal (). In addition, we used immunostaining for Cep170, a marker of mature centrioles,Citation46 which revealed that the vast majority of cells harboring amplified centrosomes contained more than one Cep170 signal (Fig. S1A and B), indicating that these cells likely had passed through abortive mitoses. Taken together, our results indicate that EVI1-induced centrosome amplification is not the result of centrosome overduplication in a single interphase as observed in response to other stimuli.Citation40,Citation46,Citation47
EVI1-overexpressing cells with supernumerary centrosomes exhibit abnormal nuclei
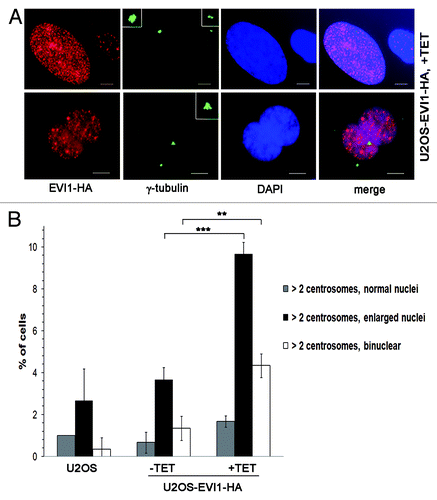
When U2OS cells overexpressing EVI1-HA showing centrosomal amplification were analyzed in greater detail, we noticed that EVI1-induced supernumerary centrosomes were accompanied by abnormal nuclei, which were either enlarged or binuclear (). We quantified this observation in U2OS-EVI1-HA cells induced to overexpress EVI1-HA for 72 h, uninduced controls and parental U2OS cells immunostained for γ-tubulin and the HA tag. Cells harboring supernumerary centrosomes were classified according to their nuclear phenotype. This quantification revealed significant increases of both enlarged nuclei (9.67 ± 0.57% vs. 3.67 ± 0.57%, p = 0.0002) and binuclear cells (4.33 ± 0.57% vs. 1.33 ± 0.57%, p = 0.0031) in EVI1-overexpressing cells with amplified centrosomes as compared with uninduced controls (). Noteworthy, these cells with abnormal nuclei accounted for the vast majority of all cells displaying supernumerary centrosomes, while cells with supernumerary centrosomes and normal nuclei largely remained at background levels in spite of EVI1-HA overexpression (1.67 ± 0.28% vs. 0.67 ± 0.50%, p = 0.1012). It should be also noted that abnormal nuclei were very rare in the fraction of EVI1-overexpressing cells with regular centrosome content (Fig. S2A). In addition, abnormal nuclei were not observed when overexpression of GFP-STILCitation48 was used as an alternative strategy to induce centrosome amplification (Fig. S2B). We conclude that formation of supernumerary centrosomes in response to EVI1 overexpression is specifically linked to the emergence of enlarged nuclei or binuclearity.
Figure 2. EVI1-overexpressing cells show abnormal nuclei. (A) In U2OS cells conditionally overexpressing EVI1-HA, transgene expression was induced for 72 h. Cells were immunostained for γ-tubulin (green) and EVI1-HA (red). DNA was counterstained with DAPI (blue). Scale bars represent 10 μm. Insets show centrosomes at higher magnification. (B) U2OS cells conditionally overexpressing EVI1-HA were left untreated (-TET) or induced to express the transgene for 72 h (+TET). Parental U2OS cells were grown in parallel. Following immunostaining as in (A), percentages of cells with more than two centrosomes and the nuclear morphology detailed in the figure were quantified in 3 × 100 cells per data bar. ***, this difference is highly significant (p = 0.00021). **, this difference is significant (p = 0.00312).
EVI1 overexpression is associated with cytokinesis failure
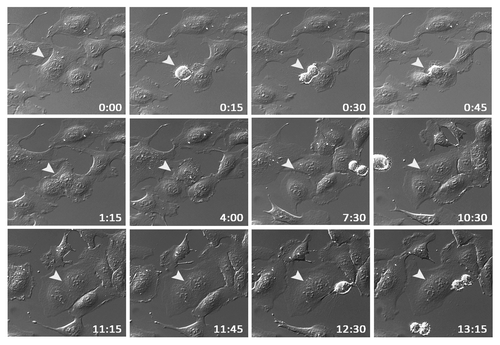
The observed nuclear morphology with both enlarged nuclei and binuclear cells prompted us to speculate that supernumerary centrosomes in response to EVI1 overexpression might be the result of a cytokinesis defect. To test this hypothesis, U2OS-EVI1-HA cells were induced to express EVI1-HA for 24 h and subsequently monitored by time-lapse video microscopy for 72 h. Among 398 cells undergoing mitosis, 7.78% failed to complete cytokinesis, while in uninduced controls, cytokinesis failure was observed in only 2.12% of 564 mitoses (p = 0.00003). A representative example of an EVI1-overexpressing cell undergoing mitosis and failing to complete cytokinesis, ultimately resulting in a binuclear cell, is given in . Hence, EVI1-induced supernumerary centrosomes seem to be the result of a cytokinesis defect.
Figure 3. EVI1 overexpression is associated with cytokinesis defects. U2OS cells conditionally overexpressing EVI1-HA were monitored by time-lapse microscopy for 72 h following induction of transgene expression. A representative example of an EVI1-overexpressing cell undergoing mitosis is marked by arrowheads: after an apparently normal mitosis and karyokinesis, cytokinesis remains incomplete, resulting in a binuclear cell. Elapsed times after start of observation are given as hours:minutes.
Cells overexpressing EVI1 accumulate in G0/1 phase and show elevated cyclin D1 and p21 levels
To further corroborate that EVI1 overexpression leads to cytokinesis failure resulting in cells with supernumerary centrosomes, we tested the prediction that this phenotype should be accompanied by cells accumulating in G0/1 phase of the cell cycle since cytokinesis failure activates a p53-dependent tetraploidy checkpoint.Citation45 As expected from previous results,Citation32 the diploid G0/1 fraction was elevated to 57.52 ± 5.13% in U2OS-EVI1-HA induced to overexpress EVI1-HA for 72 h as compared with 47.06 ± 2.59% in uninduced controls (p = 0.0034) and 48.52 ± 3.35% in parental U2OS cells, while the S phase fraction was reduced to 12.00 ± 2.88% during EVI1-HA overexpression as compared with 21.20 ± 1.86% in uninduced controls (p = 0.0003) and 18.66 ± 2.10% in parental U2OS cells. Cells harboring 4N DNA, presumably including both diploid G2/M and tetraploid G0/1 cells, were present with a virtually unchanged percentage of 25.57 ± 6.20% after induction of EVI1-HA overexpression as compared with 27.12 ± 3.04% in uninduced controls (p = 0.5823) and 29.60 ± 2.06% in parental U2OS cells (). Similar results were obtained with U2OS cells retrovirally transduced to conditionally overexpress EVI1, which showed proportions of 76.92% diploid cells in G0/1 phase, 7.69% of cells in S phase and 13.43% cells with 4N DNA when EVI1 was induced for 72 h, while among uninduced cells, 61.27% were in diploid G0/1 phase, 11.04% were in S phase and 26.68% harbored 4N DNA.
Figure 4. EVI1 overexpression leads to accumulation of cells in G0/1 phase. (A) Parental U2OS cells, uninduced (-TET) and induced (+TET) U2OS cells conditionally overexpressing EVI1-HA were cultured for 72 h. After 7-AAD staining, the DNA content was measured by flow cytometry. (B) Lysates of parental U2OS cells, uninduced (-TET) and induced (+TET) U2OS cells conditionally overexpressing EVI1 were prepared at the indicated time points after transgene induction, followed by immunoblotting for the indicated proteins. (C) U2OS cells conditionally overexpressing EVI1-HA were induced to express the transgene (+TET) or left uninduced (-TET) for 72 h, followed by immunoprecipitation of Cdk2 from 50 µg protein per lane and an in vitro kinase assay using histone H1 as a substrate to measure Cdk2 activity (upper right panel). Negative controls included induced cells where the Cdk2 antibody or lysate was omitted during immunoprecipitation, or the immunoprecipitate was heated to 95°C for 5 min (upper left panel, from left to right). Immunoblots for HA and actin were prepared in parallel, showing induction of EVI1-HA after 72 h (lower panel). (D) The in vitro kinase assay of Cdk2 activity as described in (C) was reproduced using U2OS cells retrovirally transduced to conditionally overexpress EVI1, with the minor modification that 100 µg protein per lane was used for immunoprecipitation, and that the immunoblot used to demonstrate transgene overexpression was performed with an antibody to EVI1.
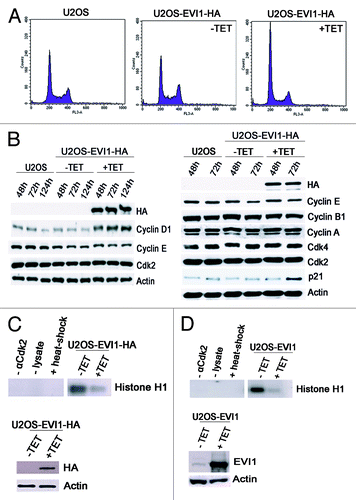
To further corroborate that overexpression of EVI1 causes accumulation of tetraploid cells in G0/1 phase and to exclude a cell cycle arrest in mitosis, cells were immunostained with an antibody to phospho-S10-histone H3 as mitosis marker.Citation49 Two-variable flow cytometry analysis revealed that EVI1 overexpression led to a decrease in the percentage of cells with 4N DNA content in mitosis to 1.61 ± 0.30% (mean ± SD from six experiments) in U2OS-EVI1-HA cells induced to overexpress EVI1 for 72 h as compared with 2.49 ± 0.21% in uninduced controls (p = 0.00023) and 2.63 ± 0.21% in parental U2OS cells (p = 0.000008).
Next, we tested the abundance of a set of cell cycle regulators by immunoblotting. While EVI1 overexpression did not have any impact on the levels of cyclin A, cyclin E, cyclin B1, Cdk2 and Cdk4, both cyclin D1 and p21 were markedly upregulated after induction of EVI1-HA overexpression as compared with uninduced controls and parental U2OS cells (). In addition, an in vitro kinase assay using histone H1 as a substrate demonstrated reduced Cdk2 activity in U2OS-EVI1-HA cells induced to overexpress EVI1-HA (). Again, these results were confirmed using U2OS cells retrovirally transduced to conditionally overexpress EVI1, which showed a similar reduction of Cdk2 activity in response to EVI1 overexpression (). Taken together, EVI1 overexpression leads to accumulation of U2OS cells in G0/1 phase of the cell cycle, which is accompanied by elevated cyclin D1 and p21 levels and reduced Cdk2 activity.
EVI1 overexpression induces activation of the p53-dependent tetraploidy checkpoint
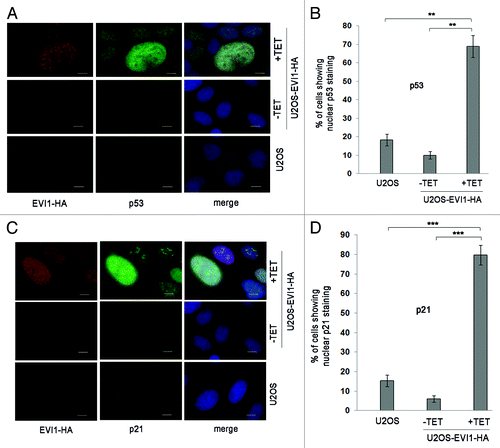
Elevated p21 levels in response to EVI1 overexpression indicated that there might be activation of the p53 pathway, which would be expected as a result of the tetraploidy checkpoint. In fact, immunofluorescence clearly indicated that EVI1 overexpression induced nuclear accumulation of p53 protein, which was strongest in cells with enlarged nuclei (). The same pattern was found for p21, which also accumulated in response to EVI1-HA induction, showing the highest levels in enlarged nuclei as well (). Hence, EVI1 overexpression induces activation of the p53 pathway, which appears to be strongest in cells with enlarged nuclei, presumably as a result of the p53-dependent tetraploidy checkpoint.
Figure 5. EVI1 overexpression induces activation of the p53 pathway. (A) Parental U2OS cells, uninduced (-TET) and induced (+TET) U2OS cells conditionally overexpressing EVI1-HA were harvested 72 h after induction of transgene expression and immunostained for HA (red) and p53 (green). DNA was counterstained with DAPI (blue). Scale bars represent 10 µm. (B) The observations shown in (A) were quantified by counting cells displaying nuclear positivity for p53. Results are given as mean ± SD of 3 × 100 cells per data bar. **, these differences are significant (p = 0.0015 and p = 0.0010 for the comparison with uninduced EVI1-HA and parental U2OS cells, respectively). (C) Parental U2OS cells, uninduced (-TET) and induced (+TET) U2OS cells conditionally overexpressing EVI1-HA were harvested 72 h after induction of transgene expression and immunostained for HA (red) and p21 (green). DNA was counterstained with DAPI (blue). Scale bars represent 10 µm. (D) The observations shown in (C) were quantified by counting cells displaying nuclear positivity for p21. Results are given as mean ± SD of 3 × 100 cells per data bar. ***, these differences are highly significant (p = 0.00055 and p = 0.00018 for the comparison with uninduced EVI1-HA and parental U2OS cells, respectively).
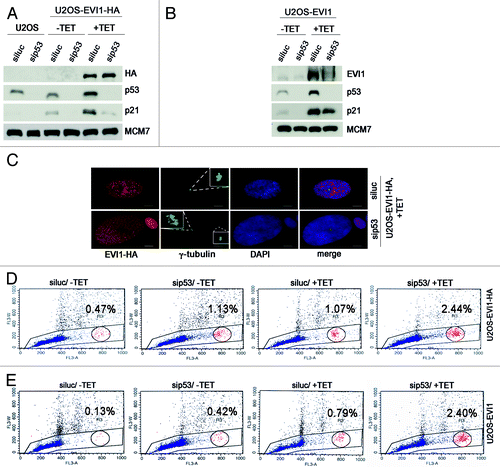
To further corroborate this notion, we efficiently depleted p53 in U2OS-EVI1-HA cells using siRNA, which also resulted in downregulation of its transcriptional target p21, thereby reverting its accumulation during EVI1 overexpression (). The same pattern was found in U2OS cells retrovirally transduced to conditionally overexpress EVI1 (). Noteworthy, in both U2OS-EVI1-HA cells and U2OS cells retrovirally transduced to overexpress EVI1 an upregulation of p53 protein was detectable by immunoblotting (). As predicted, the observed enlargement of nuclei in EVI1-overexpressing cells was more pronounced when p53 was downregulated (). We quantified this observation by flow cytometric cell cycle analysis, which revealed that p53 depletion induced an increase in polyploid cells after induction of EVI1 overexpression, with both cells with more than 4N DNA and cells with 8N DNA being elevated in comparison to luciferase-depleted controls (; Table S1). It should be noted that also in uninduced U2OS-EVI1-HA cells, p53 depletion led to a somewhat higher proportion of polyploid cells (indicating, in accordance with our live cell imaging data, some background of failed mitoses leading to tetraploidization and, in the case of p53 depletion, further polyploidization), but the percentage of polyploid cells without induction of EVI1 was clearly lower than in response to EVI1 induction (Table S1). Again, these results could be reproduced using U2OS cells retrovirally transduced to conditionally overexpress EVI1 (; Table S1). In conclusion, further polyploidization of tetraploid cells arisen after EVI1-induced cytokinesis failure is inhibited by the p53-dependent tetraploidy checkpoint.
Figure 6. Further polyploidization of EVI1-induced tetraploid cells is inhibited by p53. (A) Parental U2OS cells and U2OS cells conditionally overexpressing EVI1-HA were transfected with siRNAs targeting luciferase (siluc) or p53 (sip53), respectively. Twenty-four hours later, transgene expression was induced where indicated (+TET), and cells were harvested 72 h thereafter, followed by immunoblotting for the indicated proteins. (B) U2OS cells retrovirally transduced to conditionally overexpress EVI1 were treated as in (A), followed by immunoblotting for the indicated proteins. (C) U2OS cells conditionally overexpressing EVI1-HA were transfected with siRNAs targeting luciferase (siluc) or p53 (sip53), respectively. Twenty-four hours later, transgene expression was induced where indicated (+TET), and cells were harvested 72 h thereafter, followed by immunostaining for HA (red) and γ-tubulin (green). DNA was counterstained with DAPI (blue). Scale bars represent 10 µm. Insets show centrosomes at higher magnification. (D) U2OS cells conditionally overexpressing EVI1-HA were transfected with siRNAs targeting luciferase (siluc) or p53 (sip53), respectively. Twenty-four hours later, transgene expression was induced where indicated (+TET), and cells were harvested 72 h thereafter, followed by flow-cytometric analysis of DNA content. This included gating in cells of interest (blue) by excluding doublets, followed by defining regions containing cells with 8N DNA (red), corresponding to the given percentages, or more than 4N DNA (not shown). The complete data are listed in Table S1. (E) Flow-cytometric analysis of polyploidization was performed exactly as described in (D), except that U2OS cells retrovirally transduced to conditionally overexpress EVI1 were used. The complete data are listed in Table S1.
EVI1-overexpressing cells harboring supernumerary centrosomes show low levels of Ki-67
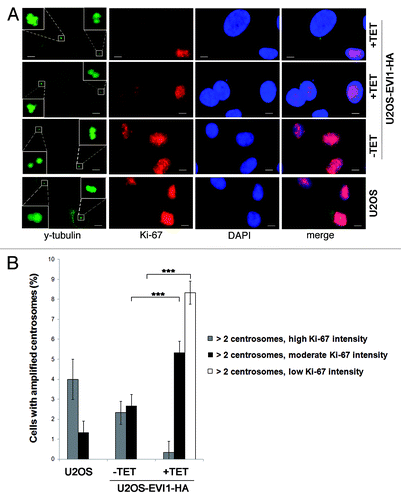
To further confirm the assumption that EVI1-induced supernumerary centrosomes reflect tetraploid cells arrested in G0/1 phase after cytokinesis failure, we used Ki-67 as proliferation marker that is expressed during all active phases of the cell cycle (S, G2 and mitosis) but absent from resting cells (G0) and low during early G1 phase.Citation49 Immunofluorescence staining revealed that EVI1-overexpressing cells showing centrosome amplification displayed low Ki-67 protein levels or were Ki-67-negative, while the majority of Ki-67-positive cells did not harbor supernumerary centrosomes (). In response to EVI1 overexpression, 8.33 ± 0.57% of all cells showed centrosome amplification and low Ki-67 levels as compared with 0.00 ± 0.00% in uninduced cells (p = 4.9759E-05), while centrosome amplification was accompanied by moderate Ki-67 intensity in 5.33 ± 0.57% of EVI1-overexpressing but 2.66 ± 0.57% of uninduced cells (p = 0.0002; ). Notably, cells displaying centrosome amplification together with high Ki-67 levels (as expected in the case of centrosome overduplication during S phase) were significantly reduced to 0.33 ± 0.57% in response to EVI1 overexpression as compared with 2.33 ± 0.57% in uninduced cells (p = 0.0014; ). In addition, quantitative RT-PCR, which was normalized using GAPDH and G6PD as reference genes, showed a significant decrease of Ki-67 mRNA levels to 48.18 ± 6.13% 72 h after induction of EVI1-HA overexpression relative to uninduced controls (p = 0.0023). Together, these data demonstrate that EVI1-induced centrosome amplification is confined to cells in G0 or early G1 phase.
Figure 7. EVI1-overexpressing cells harboring centrosome aberrations show low Ki-67 levels. (A) Parental U2OS cells, uninduced (-TET) and induced (+TET) U2OS cells conditionally overexpressing EVI1-HA were harvested 72 h after induction of transgene expression and immunostained for γ-tubulin (green) and Ki-67 (red). DNA was counterstained with DAPI (blue). Scale bars represent 10 µm. Insets show centrosomes at higher magnification. (B) U2OS cells conditionally overexpressing EVI1-HA were left untreated (-TET) or induced to express the transgene for 72 h (+TET). Parental U2OS cells were grown in parallel. Following immunostaining as in (A), percentages of cells with more than two2 centrosomes were quantified and given in relation to the Ki-67 staining intensity in 3 × 100 cells per data bar. ***, all indicated differences are highly significant (p < 0.0001).
EVI1 overexpression interferes with proliferation and induces a negative feedback loop
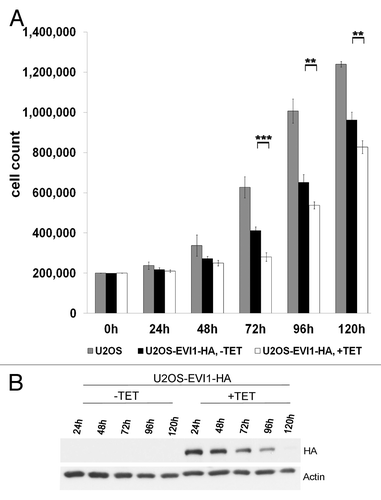
To determine whether EVI1-induced cytokinesis failure and G0/1 arrest interfere with proliferation, we induced overexpression of EVI1-HA for up to 120 h. As expected, EVI1 overexpression was associated with impaired proliferation leading to significantly reduced cell counts as compared with uninduced controls (), which could not be explained by increased apoptosis since the amount of death cells was not significantly changed (data not shown). Interestingly, inhibition of proliferation was most pronounced 72 h after start of induction, while at later time points, the difference between EVI1-overexpressing and uninduced cells tended to become smaller again (). This finding is best explained by the observation that although tetracycline was renewed every 48 h to ensure constant transgene induction, overexpression of EVI1-HA decreased over time and became undetectable by 120 h (). Since clonal selection cannot explain this downregulation during such a short period of time comprising only about two cell doubling periods (see, ), we conclude that EVI1 overexpression induces a negative feedback loop downregulating its own expression. Hence, cytokinesis failure and G0/1 arrest in response to EVI1 overexpression significantly interfere with cellular proliferation, which is limited by a negative feedback loop.
Figure 8. EVI1 overexpression interferes with proliferation and induces a negative feedback loop. (A) Of parental U2OS cells, uninduced (-TET) and induced (+TET) U2OS cells conditionally overexpressing EVI1-HA, a measure of 200,000 cells per dish was seeded. At the indicated time points, cells were harvested and counted again to determine proliferation rates. Results are given as mean absolute numbers of cells from two experiments. ***, this difference is highly significant (p = 0.00035). **, these differences are significant (p < 0.009). (B) In U2OS cells conditionally overexpressing EVI1-HA, transgene expression was induced for the indicated times, and tetracycline-containing medium was renewed every 48 h. Using 70 µg of protein extract per lane from induced cells (+TET) or uninduced controls (-TET), immunoblots for HA and the loading control actin were prepared.
Discussion
In the present work, we applied several complementary approaches to demonstrate that overexpression of EVI1 interferes with proliferation of U2OS cells as a result of a reduced activity of the cell cycle-promoting kinase Cdk2, leading to accumulation of cells in G0/1 phase of the cell cycle. In addition, we show that EVI1 overexpression causes cytokinesis failure and subsequent arrest of cells with supernumerary centrosomes in tetraploid G0/1 phase.
Inhibition of proliferation associated with a G0/1 arrest as a result of EVI1 expression has been described before in the human myeloid cell line U937.Citation32 EVI1-induced inhibition of Cdk2, associated with reduced cyclin A levels, has been described in human erythroleukemia cells used as a model for megakaryocytic differentiation, where Cdk2 inhibition interfered with endomitotic cycles.Citation33 To the contrary, EVI1 overexpression in rodent fibroblasts led to deregulated Cdk2 activity,Citation50 indicating possible cell type- or species-specific effects.
How does EVI1 overexpression lead to Cdk2 inhibition and consequential G0/1 arrest? Our data suggest that activation of p53 and subsequent upregulation of p21 at least partly contributes to this outcome. Since tetraploidization affected only a fraction of EVI1-overexpressing cells, but p53 activation seemed to be more widespread under the experimental conditions used here, activation of the tetraploidy checkpoint appears to be not the only underlying cause of p53 activation, although probably contributing to this activation, since both p53 and p21 were most abundant in enlarged nuclei. How, on the other hand, EVI1 overexpression is mechanistically linked to the p53 pathway or cytokinesis failure as the underlying cause of activation of the tetraploidy checkpoint, remains to be determined and might be difficult to solve due to the multitude of EVI1 targets.
There is robust evidence that centrosome amplification can be induced via deregulated centrosome duplication in interphase, e.g., by overexpression of components of the centrosome duplication machinery, or as a checkpoint response to DNA damage, which also takes place during interphase.Citation37-Citation44 As an alternative route to supernumerary centrosomes, mitotic defects resulting in G0/1 cells with 4N DNA have been proposed, which could be experimentally induced by overexpression of Plk1, Aurora A or Aurora B.Citation45 In this model, loss of p53 was proposed to be an important determinant of polyploidization associated with repeated centrosome duplication cycles, which was explained by p53 acting as a mediator of a G1 tetraploidy checkpoint.Citation45 Our data provide further evidence that centrosome aberrations in malignant cells can indeed arise via mitotic defects. In fact, the resulting phenotype of cytokinesis failure leading to binuclear cells harboring supernumerary centrosomes closely resembles the findings described for Plk1, Aurora A or Aurora B overexpression.Citation45 Since p53 is functional in the U2OS cells used in our study, tetraploid cells arrested in G0/1 phase as a result of EVI1-induced cytokinesis failure did not undergo multiple rounds of DNA replication and centrosome duplication, which is consistent with both the demonstrated activation of the p53 pathway and the observed cell cycle profile in which the 4N DNA peak likely represents a mixture of diploid G2/M cells and tetraploid G0/1 cells. A confirmation of this assumption comes from our p53 depletion experiments, which demonstrate that this arrest can be overcome by inhibition of p53, leading to polyploidization beyond the tetraploid G0/1 state. In conclusion, the majority of cells with supernumerary centrosomes found in our system are explained by centriole disengagement in tetraploid G0/1 cells leading to four distinct centrosome signals.
How might supernumerary centrosomes induce chromosomal instability in EVI1-overexpressing cells? Recent data suggest that in tetraploid cells resulting from failed cytokinesis, supernumerary centrosomes lead to elevated chromosome missegregation rates when cells enter mitosis again.Citation34 In agreement with this model, it has been observed before that tetraploid cells are prone to chromosome loss, giving rise to aneuploidy.Citation34,Citation51,Citation52 The underlying cause of this chromosome loss seem to be supernumerary centrosomes promoting chromosome segregation errors.Citation34,Citation51 These observations fit to the finding that EVI1 overexpression in acute myeloid leukemia and myelodysplasia is often associated with monosomy 7.Citation16-Citation18 However, this scenario would require that at least some of the tetraploid cells, which are largely arrested in G0/1 phase in our system, ultimately reenter mitotic cycles. Since many of the diverse effects of EVI1 overexpression seem to depend on cell type and other determinants (e.g., p53 mutations or other genetic alterations leading to abrogation of the tetraploidy checkpoint), it may be assumed that EVI1 overexpression is beneficial to clonal evolution by inducing chromosomal instability, although not directly promoting cell proliferation. This might be one possible explanation of the seeming paradox of myelodysplasia, which is a clonal disorder characterized by slow and inefficient proliferation coupled with chromosomal instability, but still possesses a selective advantage over regular hematopoiesis.
In conclusion, our results provide novel insights into cell cycle deregulation caused by EVI1 overexpression. Centrosome amplification, secondary to an EVI1-induced cytokinesis defect, may be the underlying cause of EVI1-induced chromosomal instability, which might be a critical determinant of the growth advantage of malignant cells overexpressing EVI1.
Materials and Methods
Plasmid construction
For stable transfection, EVI1-HA was cloned into a modified pcDNA4/TO (Invitrogen) vector whose selection cassette was changed from zeocin to puromycin. For lentiviral transduction, human EVI1 (NCBI: NM_005241) was synthesized (Geneart), inserted into the pCCL.SIN.cPPT.TRE.IRES.eGFP.wPRE tet-inducible expression vector and verified by sequencing. VSV.G pseudotyped lentiviral vector stocks were produced by transient co-transfection as describedCitation53 with minor modifications. The CETN2-Dendra2 construct has been described.Citation47
Cell culture and cell lines
U2OS (ATCC) and derived cells were cultured in DMEM (PAA) supplemented with 10% FCS (Biochrom) and antibiotics. U2OS cells conditionally overexpressing GFP-STIL have been described.Citation48 The following siRNAs were transfected using Dharmafect 1 (Thermo Scientific) according to the manufacturer’s recommendations: 5′- CAG UCU ACC UCC CGC CAU AdTdT-3′, targeting p53, 5′-UAA GGC UAU GAA GAG AUA CdTdT-3′, targeting luciferase. Other transfections were done using Fugene 6 (Roche). T-Rex-U2OS cells (Invitrogen) stably expressing EVI1-HA inducible by 1 mg/l tetracycline were generated using a modified T-REx system (Invitrogen) and held under selection pressure with 0.1 g/l hygromycin and 1.5 mg/l puromycin. Lentiviral transduction of U2OS cells was performed with the pLVX-Tet-On Advanced lentiviral construct encoding for the tetracycline-controlled reverse transactivator (rtTA-Advanced, Clontech). Transduced cells were selected using 400 mg/l G418. rtTA-expressing cells were transduced with the pCCL.SIN.cPPT.TRE.IRES.eGFP.wPRE tet-inducible expression vector. For single-cell cloning, transduced cultures were induced with 1 mg/l tetracycline for 48 h. GFP-positive single cells were sorted into a 96-well plate and expanded in the absence of tetracycline, and EGFP expression was verified by flow cytometry; expression of human EVI1 was verified by RT-PCR using the following primers: EVI1-for, 5′-TCC ACG AGG AAC GGC AGT ACA G-3′ and EVI1-rev, 5′- TCG CAT TCT TTG CAT TCT TGG-3′.
Antibodies
Antibodies used were mouse monoclonals to Cdk4 (Santa Cruz, sc-56277), Cep170 (a gift from Erich A. Nigg), Ki-67 (DAKO, M7240), MCM7 (Santa Cruz, sc-9966), p21 (Millipore/Upstate, 05–345), p53 (Progen Biotechnik, 61039), γ-tubulin (Exbio, TU-30, 11–465-C100), rabbit polyclonals to actin (Santa Cruz, sc-1616R), Cdk2 (Santa Cruz, sc-163), cyclin A (Santa Cruz, sc-751), cyclin B1 (Santa Cruz, sc-752), cyclin D1 (Santa Cruz, sc-753), cyclin E (Santa Cruz, sc-481), HA (Sigma, H6908), phospho-histone H3 (Millipore, 06–570), γ-tubulin (Sigma, T5192) and a rabbit monoclonal antibody to EVI1 (Cell Signaling, 2593). Secondary antibodies were from Molecular Probes (Alexa Fluor 488, highly cross-adsorbed) or from Jackson ImmunoResearch (Cy3-conjugated goat anti-mouse IgG) for immunofluorescence and from Vector Laboratories (HRP-conjugated) for immunoblots.
Immunofluorescence and live cell imaging
Cells were grown on glass coverslips and fixed in methanol/acetone (1:1, v/v). Indirect immunofluorescence staining was performed according to standard protocols. Cells were mounted in Vectashield with DAPI (H 1200; Vector Laboratories) diluted (1:3) with Vectashield (H 1000; Vector Laboratories). Fluorescence images were captured and processed using an Axiovert 200 M microscope equipped with a Plan-Apochromat 63x/1.4 objective and AxioVision software (Carl Zeiss Microscopy). Time-lapse video microscopy of cells grown on a glass bottom dish (FD35–100, World Precision Instruments) was performed at 37°C in a humidified atmosphere containing 5% CO2 using an Axio Observer.Z1 microscope equipped with a Plan-Apochromat 20x/0.8 DIC II objective and AxioVision software (Carl Zeiss Microscopy).
Immunoblotting, immunoprecipitation, kinase assay
Cells were lysed with RIPA buffer [50 mM TRIS-HCl, pH 7.5, 150 mM NaCl, 1 mM EDTA, 1% Nonidet P40 (Genaxxon), 0.5% sodium deoxycholate] supplemented with one complete protease inhibitor cocktail tablet (Roche) and 5 PhosSTOP phosphatase inhibitor cocktail tablets (Roche) per 50 ml of buffer, followed by mechanical homogenization and collection of the supernatant after 20 min centrifugation at 14,000 × g. A measure of at least 50 μg protein per sample was used for immunoblotting according to standard protocols. Following immunoprecipitation according to published methodology,Citation54 Cdk2 kinase activity was determined following a published protocol using histone H1 as substrate.Citation50
Flow cytometry
According to standard protocols, trypsinized cells fixed with 70% methanol were stained with 7-AAD (BD Biosciences) and subjected to flow cytometry using a FACScan (BD Biosciences) flow cytometer. For analyzing the mitotic index, cells were trypsinized, fixed with ice-cold 70% ethanol for 1 h, washed with PBS supplemented with 1% fetal calf serum (Gibco), treated with 0.25% Triton X-100 (Sigma)/PBS for 15 min on ice and consecutively washed and incubated with a rabbit polyclonal antibody to phospho-Ser10-histone H3, a secondary antibody from Molecular Probes (Alexa Fluor 488, highly cross-adsorbed) and PBS containing 0.25 mg/ml RNase A, followed by DNA staining with 7-AAD. Using a FACScan flow cytometer, the percentage of mitotic cells was assessed by gating in cells with 4N DNA and bright phospho-Ser10-histone H3 and gating out doublets by their 7-AAD staining pattern.
Quantitative RT-PCR
DNase-treated mRNA was reversely transcribed using the Transcriptor High Fidelity cDNA Synthesis Kit (Roche) following the manufacturer’s recommendations. Amplification was performed in 384-well plates (Roche) using the Light Cycler 480 SYBR Green I Master Mix (Roche) under conditions optimized individually for each primer set. The reaction was monitored with a Light Cycler 480 Real-Time PCR System (Roche). The expected PCR products were verified by standard native polyacrylamid gel electrophoresis and sequence analysis. The mRNA abundance of genes of interest and control genes was quantified based on triplicate reactions according to standard methodology. The following primers were used: Ki-67-for, 5′-AGACGCCTGGTTACTATCAAAAG-3′; Ki-67-rev, 5′-GGAAGCTGGATACGGATGTCA-3′; EVI1-HA-for, 5′-AAACTCGAAAGCGAGAATGATCT-3′; EVI1-rev, 5′-TGGTGGCGAATTAAATTGGACTT-3′; β-actin-for, 5′-CCAACCGCGAGAAGATGA-3′; β-actin-rev, 5′-TCCATCACGATGCCAGTG-3′; G6PD-for, 5′-GCAAACAGAGTGAGCCCTTC-3′; G6PD-rev, 5′-GGCCAGCCACATAGGAGTT-3′; GAPDH-for, 5′-GCTCTCTGCTCCTCCTGTTC-3′; GAPDH-rev, 5′-ACGACCAAATCCGTTGACTC-3′.
Statistical analysis
Results are given as mean ± standard deviation (SD). The significance of quantitative differences was calculated using the heteroscedastic, two-tailed Student’s t-test.
| Abbreviations: | ||
| 7-AAD | = | 7-amino-actinomycin D |
| AKT | = | Ak-strain thymoma-associated protein |
| Cdk | = | cyclin-dependent kinase |
| Cep170 | = | centrosomal protein 170 |
| CETN2 | = | centrin 2 |
| Da | = | Dalton |
| DAPI | = | 4',6-diamidino-2-phenylindole |
| EDTA | = | ethylenediaminetetraacetate |
| EVI1 | = | ectopic viral integration site 1 |
| G6PD | = | glucose-6-phosphate dehydrogenase |
| GAPDH | = | glyceraldehyde 3-phosphate dehydrogenase |
| GFP | = | green fluorescent protein |
| HA | = | human influenza hemagglutinin tag |
| JNK | = | c-Jun N terminal kinase |
| Ki-67 | = | antigen Ki-67 |
| MCM7 | = | minichromosome maintenance 7 |
| MDS1 | = | myelodyslasia syndrome 1 |
| p21 | = | tumor protein 21 (CIP1/WAF1) |
| p53 | = | tumor protein 53 |
| PI3K | = | phosphoinositide 3-kinase |
| Plk | = | polo-like kinase |
| SD | = | standard deviation |
| siRNA | = | small interfering RNA |
| STIL | = | SCL/TAL1 interrupting locus |
Additional material
Download Zip (239.6 KB)Acknowledgments
We thank Manuel Grez for the EVI1 plasmid, Erich A. Nigg for the Cep170 antibody, Luigi Naldini for providing lentiviral packaging plasmids and the transfer vector pCCL.SIN.cPPT.SFFV.IRES.eGFP.wPRE and Sigrid Heil for excellent technical assistance. Support by the DKFZ Light Microscopy Facility and the Carl Zeiss Application Center, Heidelberg, is gratefully acknowledged. This work was supported by the Deutsche Forschungsgemeinschaft, grant SFB873, and by the Deutsche Krebshilfe, grants 108560, 10–1860-GI I and 107217.
Disclosure of Potential Conflicts of Interest
No potential conflicts of interest were disclosed.
Related Research Data
References
- Lengauer C, Kinzler KW, Vogelstein B. Genetic instabilities in human cancers. Nature 1998; 396:643 - 9; http://dx.doi.org/10.1038/25292; PMID: 9872311
- Rajagopalan H, Lengauer C. Aneuploidy and cancer. Nature 2004; 432:338 - 41; http://dx.doi.org/10.1038/nature03099; PMID: 15549096
- Breems DA, Van Putten WL, De Greef GE, Van Zelderen-Bhola SL, Gerssen-Schoorl KB, Mellink CH, et al. Monosomal karyotype in acute myeloid leukemia: a better indicator of poor prognosis than a complex karyotype. J Clin Oncol 2008; 26:4791 - 7; http://dx.doi.org/10.1200/JCO.2008.16.0259; PMID: 18695255
- Heilig CE, Löffler H, Mahlknecht U, Janssen JW, Ho AD, Jauch A, et al. Chromosomal instability correlates with poor outcome in patients with myelodysplastic syndromes irrespectively of the cytogenetic risk group. J Cell Mol Med 2010; 14:895 - 902; http://dx.doi.org/10.1111/j.1582-4934.2009.00905.x; PMID: 19754665
- Medeiros BC, Othus M, Fang M, Roulston D, Appelbaum FR. Prognostic impact of monosomal karyotype in young adult and elderly acute myeloid leukemia: the Southwest Oncology Group (SWOG) experience. Blood 2010; 116:2224 - 8; http://dx.doi.org/10.1182/blood-2010-02-270330; PMID: 20562328
- Morishita K, Parker DS, Mucenski ML, Jenkins NA, Copeland NG, Ihle JN. Retroviral activation of a novel gene encoding a zinc finger protein in IL-3-dependent myeloid leukemia cell lines. Cell 1988; 54:831 - 40; http://dx.doi.org/10.1016/S0092-8674(88)91175-0; PMID: 2842066
- Brooks DJ, Woodward S, Thompson FH, Dos Santos B, Russell M, Yang JM, et al. Expression of the zinc finger gene EVI-1 in ovarian and other cancers. Br J Cancer 1996; 74:1518 - 25; http://dx.doi.org/10.1038/bjc.1996.583; PMID: 8932329
- Sunde JS, Donninger H, Wu K, Johnson ME, Pestell RG, Rose GS, et al. Expression profiling identifies altered expression of genes that contribute to the inhibition of transforming growth factor-beta signaling in ovarian cancer. Cancer Res 2006; 66:8404 - 12; http://dx.doi.org/10.1158/0008-5472.CAN-06-0683; PMID: 16951150
- Barjesteh van Waalwijk van Doorn-Khosrovani S, Erpelinck C, van Putten WL, Valk PJ, van der Poel-van de Luytgaarde S, Hack R, et al. High EVI1 expression predicts poor survival in acute myeloid leukemia: a study of 319 de novo AML patients. Blood 2003; 101:837 - 45; http://dx.doi.org/10.1182/blood-2002-05-1459; PMID: 12393383
- Russell M, List A, Greenberg P, Woodward S, Glinsmann B, Parganas E, et al. Expression of EVI1 in myelodysplastic syndromes and other hematologic malignancies without 3q26 translocations. Blood 1994; 84:1243 - 8; PMID: 8049440
- Dreyfus F, Bouscary D, Melle J, Ribrag V, Guesnu M, Varet B. Expression of the Evi-1 gene in myelodysplastic syndromes. Leukemia 1995; 9:203 - 5; PMID: 7845018
- Ohyashiki JH, Ohyashiki K, Shimamoto T, Kawakubo K, Fujimura T, Nakazawa S, et al. Ecotropic virus integration site-1 gene preferentially expressed in post-myelodysplasia acute myeloid leukemia: possible association with GATA-1, GATA-2, and stem cell leukemia gene expression. Blood 1995; 85:3713 - 8; PMID: 7780155
- Ogawa S, Kurokawa M, Tanaka T, Tanaka K, Hangaishi A, Mitani K, et al. Increased Evi-1 expression is frequently observed in blastic crisis of chronic myelocytic leukemia. Leukemia 1996; 10:788 - 94; PMID: 8656673
- Langabeer SE, Rogers JR, Harrison G, Wheatley K, Walker H, Bain BJ, et al, MRC Adult Leukaemia Working Party. EVI1 expression in acute myeloid leukaemia. Br J Haematol 2001; 112:208 - 11; http://dx.doi.org/10.1046/j.1365-2141.2001.02569.x; PMID: 11167805
- Vinatzer U, Mannhalter C, Mitterbauer M, Gruener H, Greinix H, Schmidt HH, et al. Quantitative comparison of the expression of EVI1 and its presumptive antagonist, MDS1/EVI1, in patients with myeloid leukemia. Genes Chromosomes Cancer 2003; 36:80 - 9; http://dx.doi.org/10.1002/gcc.10144; PMID: 12461752
- Stein S, Ott MG, Schultze-Strasser S, Jauch A, Burwinkel B, Kinner A, et al. Genomic instability and myelodysplasia with monosomy 7 consequent to EVI1 activation after gene therapy for chronic granulomatous disease. Nat Med 2010; 16:198 - 204; http://dx.doi.org/10.1038/nm.2088; PMID: 20098431
- Gröschel S, Lugthart S, Schlenk RF, Valk PJ, Eiwen K, Goudswaard C, et al. High EVI1 expression predicts outcome in younger adult patients with acute myeloid leukemia and is associated with distinct cytogenetic abnormalities. J Clin Oncol 2010; 28:2101 - 7; http://dx.doi.org/10.1200/JCO.2009.26.0646; PMID: 20308656
- Lugthart S, Gröschel S, Beverloo HB, Kayser S, Valk PJ, van Zelderen-Bhola SL, et al. Clinical, molecular, and prognostic significance of WHO type inv(3)(q21q26.2)/t(3;3)(q21;q26.2) and various other 3q abnormalities in acute myeloid leukemia. J Clin Oncol 2010; 28:3890 - 8; http://dx.doi.org/10.1200/JCO.2010.29.2771; PMID: 20660833
- Shi G, Weh HJ, Dührsen U, Zeller W, Hossfeld DK. Chromosomal abnormality inv(3)(q21q26) associated with multilineage hematopoietic progenitor cells in hematopoietic malignancies. Cancer Genet Cytogenet 1997; 96:58 - 63; http://dx.doi.org/10.1016/S0165-4608(96)00293-2; PMID: 9209472
- Bitter MA, Neilly ME, Le Beau MM, Pearson MG, Rowley JD. Rearrangements of chromosome 3 involving bands 3q21 and 3q26 are associated with normal or elevated platelet counts in acute nonlymphocytic leukemia. Blood 1985; 66:1362 - 70; PMID: 4063525
- Grigg AP, Gascoyne RD, Phillips GL, Horsman DE. Clinical, haematological and cytogenetic features in 24 patients with structural rearrangements of the Q arm of chromosome 3. Br J Haematol 1993; 83:158 - 65; http://dx.doi.org/10.1111/j.1365-2141.1993.tb04647.x; PMID: 8435325
- Fonatsch C, Gudat H, Lengfelder E, Wandt H, Silling-Engelhardt G, Ludwig WD, et al. Correlation of cytogenetic findings with clinical features in 18 patients with inv(3)(q21q26) or t(3;3)(q21;q26). Leukemia 1994; 8:1318 - 26; PMID: 8057667
- Horsman DE, Gascoyne RD, Barnett MJ. Acute leukemia with structural rearrangements of chromosome 3. Leuk Lymphoma 1995; 16:369 - 77; http://dx.doi.org/10.3109/10428199509054422; PMID: 7787746
- Secker-Walker LM, Mehta A, Bain B. Abnormalities of 3q21 and 3q26 in myeloid malignancy: a United Kingdom Cancer Cytogenetic Group study. Br J Haematol 1995; 91:490 - 501; http://dx.doi.org/10.1111/j.1365-2141.1995.tb05329.x; PMID: 8547101
- Charrin C, Belhabri A, Treille-Ritouet D, Theuil G, Magaud JP, Fiere D, et al. Structural rearrangements of chromosome 3 in 57 patients with acute myeloid leukemia: clinical, hematological and cytogenetic features. Hematol J 2002; 3:21 - 31; http://dx.doi.org/10.1038/sj.thj.6200143; PMID: 11960392
- Stevens-Kroef M, Poppe B, van Zelderen-Bhola S, van den Berg E, van der Blij-Philipsen M, Geurts van Kessel A, et al. Translocation t(2;3)(p15-23;q26-27) in myeloid malignancies: report of 21 new cases, clinical, cytogenetic and molecular genetic features. Leukemia 2004; 18:1108 - 14; http://dx.doi.org/10.1038/sj.leu.2403346; PMID: 15085164
- Poppe B, Dastugue N, Vandesompele J, Cauwelier B, De Smet B, Yigit N, et al. EVI1 is consistently expressed as principal transcript in common and rare recurrent 3q26 rearrangements. Genes Chromosomes Cancer 2006; 45:349 - 56; http://dx.doi.org/10.1002/gcc.20295; PMID: 16342172
- Wieser R. The oncogene and developmental regulator EVI1: expression, biochemical properties, and biological functions. Gene 2007; 396:346 - 57; http://dx.doi.org/10.1016/j.gene.2007.04.012; PMID: 17507183
- Kurokawa M, Mitani K, Yamagata T, Takahashi T, Izutsu K, Ogawa S, et al. The evi-1 oncoprotein inhibits c-Jun N-terminal kinase and prevents stress-induced cell death. EMBO J 2000; 19:2958 - 68; http://dx.doi.org/10.1093/emboj/19.12.2958; PMID: 10856240
- Yuasa H, Oike Y, Iwama A, Nishikata I, Sugiyama D, Perkins A, et al. Oncogenic transcription factor Evi1 regulates hematopoietic stem cell proliferation through GATA-2 expression. EMBO J 2005; 24:1976 - 87; http://dx.doi.org/10.1038/sj.emboj.7600679; PMID: 15889140
- Liu Y, Chen L, Ko TC, Fields AP, Thompson EA. Evi1 is a survival factor which conveys resistance to both TGFbeta- and taxol-mediated cell death via PI3K/AKT. Oncogene 2006; 25:3565 - 75; http://dx.doi.org/10.1038/sj.onc.1209403; PMID: 16462766
- Konrad TA, Karger A, Hackl H, Schwarzinger I, Herbacek I, Wieser R. Inducible expression of EVI1 in human myeloid cells causes phenotypes consistent with its role in myelodysplastic syndromes. J Leukoc Biol 2009; 86:813 - 22; http://dx.doi.org/10.1189/jlb.0109042; PMID: 19605700
- Kilbey A, Alzuherri H, McColl J, Calés C, Frampton J, Bartholomew C. The Evi1 proto-oncoprotein blocks endomitosis in megakaryocytes by inhibiting sustained cyclin-dependent kinase 2 catalytic activity. Br J Haematol 2005; 130:902 - 11; http://dx.doi.org/10.1111/j.1365-2141.2005.05709.x; PMID: 16156860
- Ganem NJ, Godinho SA, Pellman D. A mechanism linking extra centrosomes to chromosomal instability. Nature 2009; 460:278 - 82; http://dx.doi.org/10.1038/nature08136; PMID: 19506557
- Basto R, Brunk K, Vinadogrova T, Peel N, Franz A, Khodjakov A, et al. Centrosome amplification can initiate tumorigenesis in flies. Cell 2008; 133:1032 - 42; http://dx.doi.org/10.1016/j.cell.2008.05.039; PMID: 18555779
- Krämer A. Centrosome aberrations--hen or egg in cancer initiation and progression?. Leukemia 2005; 19:1142 - 4; http://dx.doi.org/10.1038/sj.leu.2403780; PMID: 15858612
- Boutros R, Lobjois V, Ducommun B. CDC25B involvement in the centrosome duplication cycle and in microtubule nucleation. Cancer Res 2007; 67:11557 - 64; http://dx.doi.org/10.1158/0008-5472.CAN-07-2415; PMID: 18089784
- Habedanck R, Stierhof YD, Wilkinson CJ, Nigg EA. The Polo kinase Plk4 functions in centriole duplication. Nat Cell Biol 2005; 7:1140 - 6; http://dx.doi.org/10.1038/ncb1320; PMID: 16244668
- Leidel S, Delattre M, Cerutti L, Baumer K, Gönczy P. SAS-6 defines a protein family required for centrosome duplication in C. elegans and in human cells. Nat Cell Biol 2005; 7:115 - 25; http://dx.doi.org/10.1038/ncb1220; PMID: 15665853
- Löffler H, Fechter A, Matuszewska M, Saffrich R, Mistrik M, Marhold J, et al. Cep63 recruits Cdk1 to the centrosome: implications for regulation of mitotic entry, centrosome amplification, and genome maintenance. Cancer Res 2011; 71:2129 - 39; http://dx.doi.org/10.1158/0008-5472.CAN-10-2684; PMID: 21406398
- Stevens NR, Roque H, Raff JW. DSas-6 and Ana2 coassemble into tubules to promote centriole duplication and engagement. Dev Cell 2010; 19:913 - 9; http://dx.doi.org/10.1016/j.devcel.2010.11.010; PMID: 21145506
- Löffler H, Bochtler T, Fritz B, Tews B, Ho AD, Lukas J, et al. DNA damage-induced accumulation of centrosomal Chk1 contributes to its checkpoint function. Cell Cycle 2007; 6:2541 - 8; http://dx.doi.org/10.4161/cc.6.20.4810; PMID: 17726372
- Takada S, Kelkar A, Theurkauf WE. Drosophila checkpoint kinase 2 couples centrosome function and spindle assembly to genomic integrity. Cell 2003; 113:87 - 99; http://dx.doi.org/10.1016/S0092-8674(03)00202-2; PMID: 12679037
- Bourke E, Dodson H, Merdes A, Cuffe L, Zachos G, Walker M, et al. DNA damage induces Chk1-dependent centrosome amplification. EMBO Rep 2007; 8:603 - 9; http://dx.doi.org/10.1038/sj.embor.7400962; PMID: 17468739
- Meraldi P, Honda R, Nigg EA. Aurora-A overexpression reveals tetraploidization as a major route to centrosome amplification in p53-/- cells. EMBO J 2002; 21:483 - 92; http://dx.doi.org/10.1093/emboj/21.4.483; PMID: 11847097
- Guarguaglini G, Duncan PI, Stierhof YD, Holmström T, Duensing S, Nigg EA. The forkhead-associated domain protein Cep170 interacts with Polo-like kinase 1 and serves as a marker for mature centrioles. Mol Biol Cell 2005; 16:1095 - 107; http://dx.doi.org/10.1091/mbc.E04-10-0939; PMID: 15616186
- Löffler H, Fechter A, Liu FY, Poppelreuther S, Krämer A. DNA damage-induced centrosome amplification occurs via excessive formation of centriolar satellites. Oncogene 2012; http://dx.doi.org/10.1038/onc.2012.310; PMID: 22824794
- Vulprecht J, David A, Tibelius A, Castiel A, Konotop G, Liu F, et al. STIL is required for centriole duplication in human cells. J Cell Sci 2012; 125:1353 - 62; http://dx.doi.org/10.1242/jcs.104109; PMID: 22349705
- Urruticoechea A, Smith IE, Dowsett M. Proliferation marker Ki-67 in early breast cancer. J Clin Oncol 2005; 23:7212 - 20; http://dx.doi.org/10.1200/JCO.2005.07.501; PMID: 16192605
- Kilbey A, Stephens V, Bartholomew C. Loss of cell cycle control by deregulation of cyclin-dependent kinase 2 kinase activity in Evi-1 transformed fibroblasts. Cell Growth Differ 1999; 10:601 - 10
- Storchova Z, Kuffer C. The consequences of tetraploidy and aneuploidy. J Cell Sci 2008; 121:3859 - 66; http://dx.doi.org/10.1242/jcs.039537; PMID: 19020304
- Shackney SE, Smith CA, Miller BW, Burholt DR, Murtha K, Giles HR, et al. Model for the genetic evolution of human solid tumors. Cancer Res 1989; 49:3344 - 54; PMID: 2720687
- Follenzi A, Ailles LE, Bakovic S, Geuna M, Naldini L. Gene transfer by lentiviral vectors is limited by nuclear translocation and rescued by HIV-1 pol sequences. Nat Genet 2000; 25:217 - 22; http://dx.doi.org/10.1038/76095; PMID: 10835641
- Lukas J, Bartek J. Immunoprecipitation of proteins under nondenaturing conditions. In: Celis JE, ed. Cell Biology: A Laboratory Handbook. San Diego: Academic Press, 1998:489-94.