Abstract
Cancer stem cell theory postulates that a small population of tumor-initiating cells is responsible for the development, progression and recurrence of several malignancies, including glioblastoma. In this perspective, tumor-initiating cells represent the most relevant target to obtain effective cancer treatment. Metformin, a first-line drug for type II diabetes, was reported to possess anticancer properties affecting the survival of cancer stem cells in breast cancer models. We report that metformin treatment reduced the proliferation rate of tumor-initiating cell-enriched cultures isolated from four human glioblastomas. Metformin also impairs tumor-initiating cell spherogenesis, indicating a direct effect on self-renewal mechanisms. Interestingly, analyzing by FACS the antiproliferative effects of metformin on CD133-expressing subpopulation, a component of glioblastoma cancer stem cells, a higher reduction of proliferation was observed as compared with CD133-negative cells, suggesting a certain degree of cancer stem cell selectivity in its effects. In fact, glioblastoma cell differentiation strongly reduced sensitivity to metformin treatment. Metformin effects in tumor-initiating cell-enriched cultures were associated with a powerful inhibition of Akt-dependent cell survival pathway, while this pathway was not affected in differentiated cells. The specificity of metformin antiproliferative effects toward glioblastoma tumor-initiating cells was confirmed by the lack of significant inhibition of normal human stem cells (umbilical cord-derived mesenchymal stem cells) in vitro proliferation after metformin exposure. Altogether, these data clearly suggest that metformin exerts antiproliferative activity on glioblastoma cells, showing a higher specificity toward tumor-initiating cells, and that the inhibition of Akt pathway may represent a possible intracellular target of this effect.
Keywords: :
Introduction
Cancer stem cell (CSC) theory proposes that tumors retain hierarchical cell organization of normal tissues, including subpopulations with stem cell-like properties that, by unlimited self-renewing, sustain tumor development, growth and dissemination (tumor-initiating cells, TICs).Citation1,Citation2 Conversely, differentiated, non-stem tumor cells, although rapidly dividing, have a reduced self-renewal activity that may affect their lifespan.Citation3-Citation6 TICs are also responsible of tumor chemo- and radio-resistance due to high expression of extrusion pumps and DNA repair mechanisms.Citation7-Citation9 Thus, conventional antineoplastic agents often fail to eradicate TICs and residual stem-like cells repopulate tumor mass, causing relapse.Citation10 Moreover, several reports showed that conventional chemo- and radio-therapy may select, and thus expand, drug-resistant TIC subpopulations within tumors, increasing their malignancy.Citation7,Citation9
Thus, TICs represent an elective cellular target to obtain efficacious therapeutic responses in tumors. CSCs have been detected in continuous cancer cell lines and many human and animal tumors including glioblastoma (GBM),Citation11-Citation15 the most aggressive and lethal brain tumor, despite the introduction of temozolomide, which slightly increased patients’ median survival.Citation16
Epidemiological studies documented that metformin, an insulin-independent diabetes drug, reduces cancer incidenceCitation17 and mortality,Citation18 and increases the number of breast carcinoma patients obtaining complete response to neo-adjuvant therapy.Citation19 This therapeutic potential has been confirmed by in vitro growth-inhibitory effects of metformin on cancer cell lines derived from breast, colon, lung, prostate and pancreas.Citation20-Citation23 Moreover, metformin selectively affects the growth of different tumors in mice,Citation24-Citation27 mostly through the regulation of AMP kinase (AMPk), triggered by reduction in ATP/AMP ratio. Importantly, the long-term use of metformin in diabetic patients is associated with minor adverse effects,Citation28 making this drug a powerful candidate as novel and safe anticancer drug.
Potential metformin effectiveness to target GBM proliferation was proposed due to the hypothesized synergy with temozolomide on AMPk activation,Citation29 but this possibility is still scantly explored.
In this study, we assessed metformin efficacy on glucose uptake, proliferation and survival of TIC-enriched cell cultures derived from four human GBMs. Moreover, we evaluated the intracellular mechanisms involved in this effect, comparing the responses observed in TICs with those of differentiated GBM cells and normal human mesenchymal stem cells (MSCs).
We demonstrate that metformin antitumor effects are highly specific for GBM TICs and show that reversal of Akt activation represents one of the intracellular mechanisms involved in such activity.
Results
Isolation, characterization and differentiation of human GBM TICs
Four TIC-enriched cultures, named GBM1–4, were obtained from individual human GBMs, characterized by high proliferative rate, as evaluated by MIB-1-SI on tumor sections (about 80% for GBM1 and 3, and about 45% for GBM2 and 4).
GBM-TIC cultures were characterized for recognized CSC signatures: self-renewal, neural stem cell marker expression, differentiation and tumorigenicity. All cultures were able to form spheres when plated in the stem cell-permissive medium (containing EGF and bFGF, in the absence of FBS). Self-renewal potential was assayed by serial passaging of cells, after mechanical/ enzymatic disruption of spheres, confirming that these cultures are able to reform spheres for more than 50 passages in vitro.
Confocal immunofluorescence showed that the expression of both nestin and CD133 was clearly detectable in spheroids with high, but not complete, co-expression in the same cells (, left pictures). Interestingly, CD133+ and nestin+ cells were mainly localized in the external layers of the spheres, with the central ones completely negative (, left pictures).
Figure 1. Phenotypic characterization of GBM TICs and differentiated cells. Upper pictures: Representative morphological appearance of GBM TICs grown as spheres, monolayers on matrigel or after FBS-dependent differentiation (enlargements 10X). Lower pictures: Expression of TIC (CD133, nestin) or differentiated cell (GFAP, Map2) markers. For spheres, sequential confocal microscopy z-plane sections are reported. The following picture enlargements were used: TIC spheres, 40X; TIC monolayers, 10X; differentiated GBM cells, 10X for top pictures and 100X for middle and lower pictures.
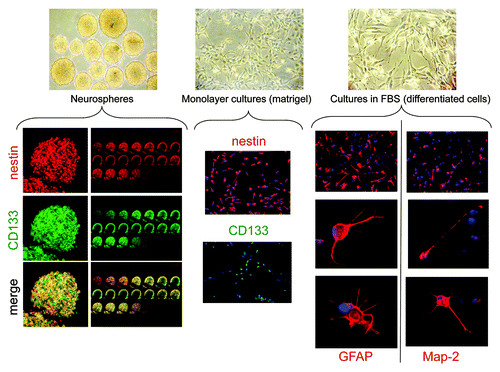
To assess differentiation potential, GBM-derived TIC spheres were shifted to medium containing FBS, but devoid of growth factors. Within 2 wk, most cells acquired typical glial morphology and expressed GFAP, although several cells in the same culture displayed the expression of Map2, indicating neuronal differentiation (, right pictures). In few cases, neuronal and glial markers were co-expressed by the same cells (data not shown). Differentiated cells continued to proliferate for several passages, as expected for the bulk of differentiated cells within tumor mass. Thus, human GBM TIC cultures include high prevalence of pluripotent cells that, upon activation of the differentiation program, are oriented to astroglial and neuronal commitment.
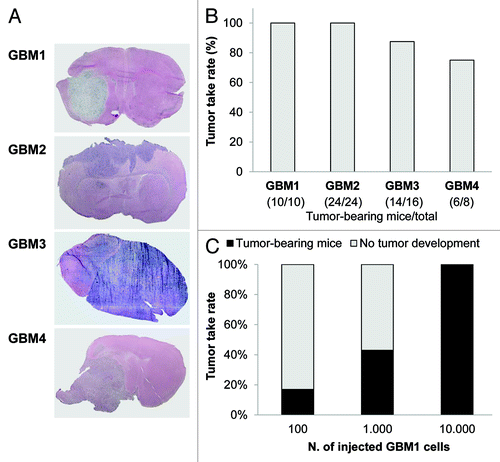
Tumorigenic potential and stem-like nature of the spheres was confirmed by orthotopic xenograft of 10,000 sphere-derived cells into NOD/SCID mice. Tumor formation was induced by cells derived from all four GBMs, and mice had to be sacrificed, due to the excessive growth of the tumor, after 80–90 d for GBM1 and 2, or 120–190 for GBM3 and 4. After the sacrifice, brains were excised and examined by H&E staining, showing a diffuse tumor invasion of the normal parenchyma, in accordance with the invasive nature of GBM (). The take-rate of injected TICs reached 100% of the mice for GBM1 and 2, 87.5% for GBM3 and 75% for GBM4 (). Moreover, although 100% of the take-rate was observed grafting 10,000 cells, as low as 100 were able to induce tumors in about 20% of the mice tested ().
Figure 2. In vivo tumorigenicity of human GBM TIC cultures. (A) Representative images of tumors developed in NOD/SCID mice orthotopically grafted with TICs from GBM 1–4. After sacrifice of the animals (survival range 80–190 d), brains were fixed and stained with hematoxylin and eosin (H&E), showing that all four TICs initiated high-grade invasive tumors. (B) The tumorigenic potential has been recorded as the percentage of tumor take-rate for each GBM TIC after injection of 10,000 cells. The ratio of mice bearing tumor xenografts and total number of animals used for in vivo experiments is reported in brackets. (C) The percentage of tumor take-rate is dependent from the number of injected TICs. The indicated number of cells of GBM 1 TIC was injected into the brain of NOD/SCID and generated tumors with different take-rate efficiency.
As previously described,Citation30 TICs also grew as monolayer in matrigel-coated dishes. Under these experimental conditions, TICs retain high proliferation rate and do not enter differentiation program. In fact, as observed when TICs were grown as spheres, TIC monolayers retain a stable expression of stem cells markers (CD133, nestin) (, middle pictures) and low expression of GFAP and Map2. More importantly, persistence of TIC phenotype under these culture conditions was confirmed by the retained ability to generate tumors when orthotopically injected in NOD-SCID mice, with the same efficiency of the cells grown as spheres (see ).
Metformin affects GBM TIC survival
Antiproliferative activity of metformin on GBM TICs was evaluated in dose-response and time-course experiments using 3-(4,5-dimethylthiazol-2-yl)-2,5-diphenyltetrazolium bromide (MTT) reduction assay.Citation30 Metformin reduced cell viability of all cultures in a dose- () and time-dependent manner (in all TIC cultures, statistically significant inhibition was observed after 24 h of treatment and maximal reduction of cell viability obtained after 72 h). IC50, calculated after 48 h of treatment, showed similar values among the cultures (GBM1 = 9.2, GBM2 = 4.9, GBM3 = 9.0, GBM4 = 9.4 mM) (), comparable to those observed in previous in vitro studiesCitation11,Citation27,Citation31 and compatible with tumor tissue concentrations attainable by in vivo administration.Citation32 TICs cultured as spheres or matrigel-adherent cells, displayed superimposable cell survival curves and metformin IC50 values, demonstrating that matrigel does not affect TIC growth rate, survival characteristics and sensitivity to metformin ().
Figure 3. Effect of metformin treatment of GBM TIC survival. (A) Metformin inhibits GBM1–4 TIC viability, evaluated using cells grown as spheres (black dots) or as monolayers on matrigel (white dots) by MTT assay. Both culture methods showed similar sensitivity to metformin that induced in all GBM cells a statistically significant inhibition. (p < 0.01 vs. untreated cells reported as 100%, n = 4.) (B) Antiproliferative effects of metformin evaluated as percentage of Ki-67-positive cells in GBM1–4 TIC spheres. White dots represent Ki-67-expressing cells, while gray fluorescence corresponds to DAPI nuclear counterstain. In the upper picture, a representative sphere from GBM1 TICs untreated or metformin-treated (20 mM, 48 h), while in the lower graph, an average of experiments pooling data from all the cultures is reported. (n = 3; ** = p < 0.01 vs. untreated cell.) (C) Cell growth recovery experiments evaluated by MTT assay. GBM1–4 TICs were treated for 48 h with increasing concentrations of metformin (black bars, untreated cells are represented as white bars), followed by 48 h culture in drug-free medium (gray bars). Low metformin concentrations were mainly cytostatic, as shown by cell growth recovery after drug withdrawal, while concentrations higher than the calculated IC50 (about 10 mM) resulted in a cytotoxic effect. (n = 3; * = p < 0.05 and ** = p < 0.01 vs. respective metformin-treated experimental points.)
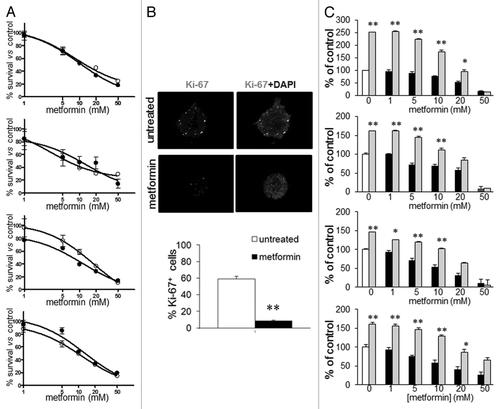
IF analysis of Ki67-expressing cells in spheres from GBM1–4 confirmed these results demonstrating that metformin treatment reduced proliferating cells from 60% to 8% ().
Cell growth recovery after metformin treatment
To verify whether the antiproliferative effects of metformin were related to cell death or cell cycle arrest, we evaluated, in GBM1–4 TICs, the persistence of living cells upon drug removal in experiments of cell growth recovery.Citation33
Metformin treatment (48 h) led to concentration-dependent growth inhibition (almost 90% at 50 mM) (). Conversely, after additional 48 h in fresh medium in the absence of the drug, all GBM cultures showed a similar sustained recovery profile of proliferation, up to the concentration of 10 mM. At higher metformin concentrations, the recovery was only partial (20 mM) or absent (50 mM). Thus, in all GBM TICs, metformin exerted growth-inhibitory effects that were cytostatic up to about IC50 values and started to become cytotoxic at higher concentrations.
Metformin treatment decreases GBM TIC proliferation, delaying cell division
Metformin antiproliferative effects were evaluated on GBM1 and GBM3, also using the dye dilution assay by flow cytometry that allows cell division tracking as sequential halving of the initial fluorescence in daughter cells; proliferation profiles were analyzed by ModFit software ().
Figure 4. Effect of metformin treatment on GBM TIC proliferation rate. GBM1 and GBM3 TIC proliferation rate was tracked by CFSE dye dilution flow cytometry assay. (A) Report a representative generation distribution plot for GBM1 TICs. Each curve represents a new generation that occurred, starting from the blue curve (parental cells). As compared with untreated cells (controls), metformin-treated cells (10 and 20 mM, for 72 h) profile shows a significant reduced number of cell division. (B and C) Report the quantification of the data for GBM1 and GBM3. A clear slow-down of cell division in both GBM TICs is demonstrated by the low number of generations reached in metformin-treated cells. On top of tables (in red) the proliferation indexes (p.i.) are reported, representing the sum of cells in all generations divided by the number of original parent cells.
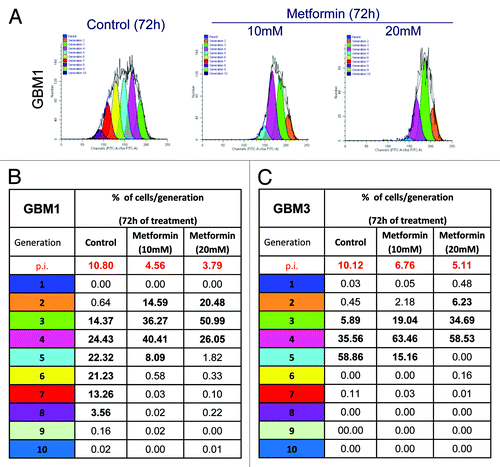
Cell proliferation kinetics was studied in TICs, cultured in the absence or presence of metformin at concentrations related to the calculated IC50 (10 and 20 mM). Cells were analyzed by FACS every 24 h. Untreated cells showed the characteristic decline in carboxyl-fluorescein succinimidyl ester (CFSE) fluorescence, index of cell division (, left panel). Metformin-treated cells reduced division rate, observed as a delay in the fluorescence leftward shift, which was statistically significant after 2 d (not shown) and maximal after 3 d of treatment ().
In this assay, proliferation index (p.i.) is the sum of cells in all generations divided by the number of parent cells present at the start of the experiment and represents the increase in cell number over the course of the experiment. The number of cell divisions in the presence of metformin was significantly reduced, and p.i. declined from 10.80 to 3.79 for GBM1, and from 10.12 to 5.11 for GBM3, after 72 h of treatment with 20 mM metformin ().
Untreated GBM1 TICs showed, after 72 h, proliferating cells to progress up to the eigth generation, with almost 40% of proliferating cells in the sixth and seventh generation. After metformin treatment, a slowing down in cell division was observed, reminiscent of a synchronization effect on cell proliferation activity. In particular, > 90% of the cells reduced the proliferation rate between the second and fourth generation after treatment with 10 mM metformin, and only 8% of the cells achieved the fifth generation, while with 20 mM metformin, 72% of the cells were stacked in second and third generation (). In GBM3, a similar pattern of inhibition of cell division was observed, although slightly less pronounced ().
Effects of metformin on stem cell-like subpopulation of GBM TICs
According to recent advances in CSC theory, TIC subpopulation is heterogeneous.Citation34 Among these cells, a subpopulation of GBM TICs, characterized by CD133 expression, was reported to possess enhanced resistance to conventional chemotherapeutics.Citation35,Citation36 To characterize the sensitivity of this specific subpopulation to metformin, we monitored the proliferation activity of asynchronous CD133+ cells, treated with vehicle or metformin (10 and 20 mM). CD133+ cells were analyzed for the percentage of cells that encountered at least one cell division, in comparison to quiescent cells. A significant inhibition of proliferating cells was observed after 72 h of metformin treatment (only 2% and 8% of cells were quiescent in untreated GBM1 and GBM3 cultures, while, in the presence of 20 mM metformin, these percentages increased up to 20% and 41% for GBM1 and GBM3 cells, respectively, ), showing higher sensitivity to metformin than the non-selected GBM TIC population. Considering the number of cell divisions, while untreated CD133+ cells reached the fifth generation after 72 h (almost 50% of the CD133-expressing cells for both GBM1 and GBM3), in the presence of 20 mM metformin, most CD133-expressing cells were stacked in second (GBM1 cells) and fourth (GBM3 cells) generations, respectively (data not shown).
Figure 5. Effect of metformin on proliferation of CD133+ GBM TICs. GBM1 and GBM3 TICs were selected for CD133+ cells by FACS, left untreated (control) or treated with metformin (20 mM, 72 h) and analyzed for proliferation rate by CFSE dye dilution. (A) Percentage of CD133+ GBM TICs that did not show reduced fluorescence (parental cells) representing cells that did not divide for all the duration of the experiment. (** = p < 0.01 vs. respective untreated control cells.) (B) Antiproliferative effects of metformin evaluated as Ki-67 expression in GBM1, GBM3 and GBM4 TIC spheres by confocal microscopy IF experiments measuring co-expression of CD133 and Ki-67. Co-localization index was calculated using Laserpix software. In the graph, the average of experiments pooling data from all cultures is reported. (n = 3; ** = p < 0.01 vs. untreated control cells.) (C) Effect of metformin on GBM TIC sphere formation. GBM1, GBM3 and GBM4 TICs were plated and sphere formation allowed for 4 d before treatment with metformin (1–50 mM) for 48 h. Representative pictures of spheres in wells for each culture in control or after metformin treatment are reported on top of the graphs. Data are an average of three independent experiments, measuring eight individual wells for each point and reported as percentage on untreated cells. (* = p < 0.05 and ** = p < 0.01 vs. respective untreated control cells.)
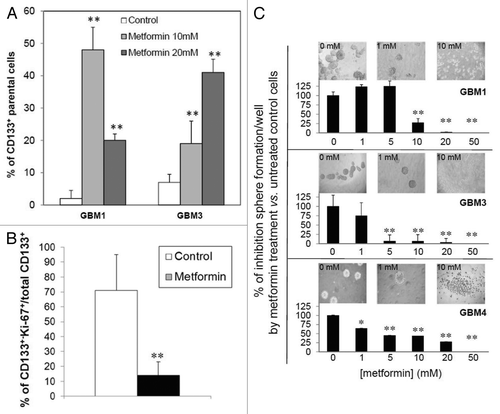
Similar results were obtained by analyzing the confocal microscopy percentage of CD133+/Ki-67+ cells in spheres from GBM1, GBM3 and GBM4, which was reduced from an average of 71% in control cells to 14% after metformin treatment ().
These results indicate that CD133+ cells are highly sensitive to metformin antiproliferative activity.
Metformin inhibits GBM TIC sphere formation
TICs are functionally defined for sustained self-renewal activity. We therefore investigated whether metformin treatment affects sphere formation as an indirect index of self-renewal.Citation37 Spherogenesis assay was performed, evaluating the number of spheres generated in the absence or presence of metformin (1–50 mM) after 48 h of treatment. In GBM1, GBM3 and GBM4 TIC cultures, metformin reduced the mean number of spheres in a dose-dependent manner (). Interestingly, in GBM3 and GBM4 cultures, metformin effects on spherogenesis were observed for low concentrations (1–5 mM) that slightly affected cell viability, indicating higher specificity for self-renewal than cell survival. Conversely, for GBM1 cells, the dose-response curve was slightly shifted to the right, with a statistically significant effect observed at 10 mM metformin. For higher concentrations (20 and 50 mM), the effect on spherogenesis was superimposed to the reduction of cell survival and, thus, more difficult to analyze (see pictures within ).
Metformin preferentially inhibits viability of GBM TICs rather than differentiated GBM cells or umbilical cord-derived MSCs
To determine whether sensitivity to metformin was dependent on the differentiation state of GBM TICs, dose-response curves of metformin were performed in cells from GBM1, GBM3 and GBM4 grown in stem cell-permissive medium or after their differentiation, switching the cultures in FBS-containing medium.Citation30 By MTT assay, we observed that differentiated cells were completely insensitive to metformin, with a slight reduction of cell survival only for the highest tested concentration (50 mM, 48 h), which, however, almost completely suppressed viability of TICs (). This result was further confirmed by immunofluorescence analysis showing that metformin (20 mM) reduced Ki-67+ (proliferating) TICs from GBM1, GBM3 and GBM4, grown in monolayer on matrigel (-86%), but slightly affected differentiated cells (-32%) ().
Figure 6. Differential efficacy of metformin on GBM TIC and differentiated cell survival and glucose uptake; lack of effects on human MSC. (A) Effect of metformin (1–50 mM, 72 h) on survival of GBM TIC (white circles) and differentiated cells (black diamonds) derived from GBM1, GBM3 and GBM4, by MTT assay. While metformin reduced TIC viability (p < 0.01), differentiated cells were only slightly affected (statistically significant effect observed only at 50 mM, p < 0.01). Dotted lines represent the values of untreated control cells, taken as 100%. Data are the average of four replica experiments. (B) Effect of metformin (20 mM, 72 h) on the survival of GBM TICs and differentiated cells derived from GBM1, GBM3 and GBM4, grown in monolayer on matrigel and evaluated by percentage of expression of Ki-67 in IF experiments. Data are reported as percentage of Ki-67+ cells over total cells stained with DAPI. (n = 3; ** = p < 0.01.) (C) (18F)-fluoro-deoxyglucose (FDG) uptake in GBM1 TIC and differentiated cells in basal and metformin-treated (20 mM, 24 h) conditions. While basal FDG uptake was significantly higher in TICs, metformin was able to increase this value only in differentiated GBM cells. Data are means of two independent experiments ± SD. Statistical significances are reported; ns, non-significant. (D) Effect of metformin (72 h) on survival of GBM TICs (black circles) and MSC (white squares), by MTT assay. Lines represent the average of independent experiments performed on GBM1, GBM3 and GBM4 and three individual MSC cultures, repeated three times and pooled together. Dotted lines represent the values of respective untreated control cells, taken as 100%. (** = p < 0.01 vs. respective control values.)
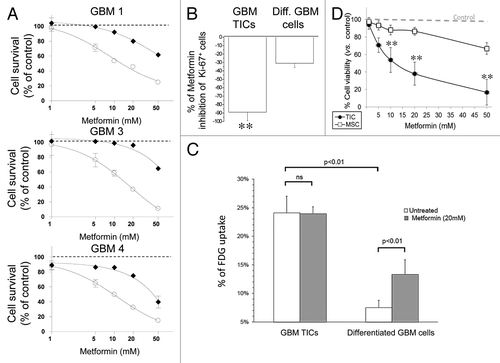
Importantly, as far as glucose uptake and phosphorylation, a well-characterized metabolic effect of metformin, TICs and differentiated GBM cells showed markedly different responses to metformin: although starting from different basal levels, statistically significant increase in FDG uptake was observed in differentiated cells, while TICs showed virtually no response ().
One of the main issues in chemotherapy is the drug toxicity toward normal stem cells. This concern is even more relevant when molecules are developed to target CSCs. Thus, in light of the significant selectivity of metformin for CSCs, we evaluated its activity on human normal MSC, isolated from umbilical cord and fully characterized (see Materials and Methods). In , survival curves of GBM1, GBM3, GBM4 and three different MSC cultures derived from individual umbilical cords in response to metformin are reported. Metformin that dose-dependently reduced GBM TICs survival, was almost ineffective on MSCs, resulting in 20% reduction of viability only for the 50 mM concentration.
These data confirm the high selectivity of metformin antiproliferative effects for TICs.
Differential modulation of AMPk and Akt phosphorylation/activation induced by metformin in GBM TICs, differentiated GBM cells and MSCs
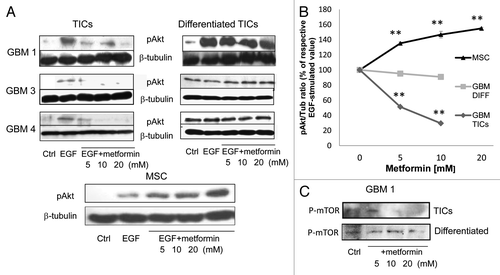
To identify possible molecular determinants of metformin effects, we evaluated the activation of AMPk and Akt, two kinases involved in metformin effects.
Metformin dose-dependently inhibited EGF-mediated Akt phosphorylation in GBM1, GBM3 and GBM4 TIC cultures, but not in the respective differentiated cells (, left panels, and quantified by densitometric analysis in ), suggesting that Akt inhibition is required for metformin antiproliferative activity in GBM TICs. Similarly, a reduction of mTOR phosphorylation at Ser2448 (a putative Akt phosphorylation siteCitation38) was observed in TIC cultures, but not in differentiated cells (). Importantly, in MSC cultures whose viability was not reduced by metformin, a significant activation of Akt was observed after treatment with the drug (, right panels, and ). Contrarily to previous studies,Citation31,Citation39 we did not observe activation of AMPk, neither in TICs nor in GBM differentiated cells, after metformin treatment, while increased phosphorylation/activation was observed in MSCs (data not shown).
Figure 7. Metformin anti-tumor effects on GBM TICs are mediated by inhibition of Akt activation. (A) Effect of metformin (24 h pretreatment) on EGF (40 ng/ml, 5 min) induced Akt phosphorylation. Proteins were normalized for β-tubulin expression. On the left, representative results obtained using GBM1, GBM3 and GBM4 TICs and differentiated cells are reported, while on the right, the same experiment was performed on human MSCs. (B) Densitometric analysis of the data in (A), averaging two distinct experiments and expressed as phospho-Akt/β-tubulin ratio. (** = p < 0.01 vs. respective EGF-treated values.) (C) Effect metformin on mTOR phosphorylation.
Discussion
The identification of TICs in tumors and the proposed role for this subpopulation in drug resistance opened the search for drugs able to deplete this tumor cell subpopulation, either through selective toxicity or by activating differentiation program that causes loss of self-renewal. However, in oncology, it is difficult to obtain drugs with high target specificity, and to date, only few reports have identified specific inhibitors of TIC proliferation.Citation40,Citation41 Among these, several studies focused on metformin. Metformin antitumor effects were initially identified from epidemiological studies that demonstrated reduced cancer risk in diabetics treated with this anti-hyperglycemic drug.Citation42 Subsequently, high complete response rate in diabetic breast cancer patients treated with metformin, according to neo-adjuvant protocols, was reported.Citation19 It was proposed that metformin activity was not due to indirect effects related to the antagonism of pro-tumoral effects induced by diabetic hyperglycemia,Citation43 but it could represent a direct antiproliferative activity on tumor cells. Indeed, several in vivo and in vitro studies demonstrated metformin to exert antitumor effects on lymphomas and breast, lung and liver carcinomas, among others.Citation25,Citation27,Citation31,Citation39,Citation44 All these unexpected evidences prompted several phase I, II and III clinical trials, currently ongoing, directed to assess the effects of metformin in several neoplastic pathologies (for a comprehensive list, see ref. Citation45).
However, the most intriguing effect proposed for metformin was the strong antiproliferative activity on CSC subpopulations.Citation45,Citation46 Therapeutic failure in aggressive tumors, such as GBM, is mostly ascribed to the insensitivity of CSCs to cytotoxic drugs.Citation34 Initial studies using breast cancer cell lines demonstrated a differential sensitivity of subpopulations of cancer cells, phenotypically characterized as CSC-like or “differentiated,” to either metformin or doxorubicin, with metformin more effective on CSCs and doxorubicin more active on non-stem cells.Citation27
However, few pharmacological studies were performed on CSCs isolated from human primary tumors. This is an important issue, since it was demonstrated that cultured cell lines significantly diverge, as phenotype and biology from cells cultured in stem cell-permissive media, on the other hand, retain most of the characteristics of primary tumor cells.Citation47
On these premises, we analyzed metformin sensitivity of TIC-enriched cultures derived from human GBMs. Using different experimental approaches, our study shows that metformin: (1) exerts cytostatic (at doses lower than IC50) or cytotoxic (for higher doses) effects on CSCs, but low or null effects on “differentiated” GBM cells or normal human MSCs; (2) at low concentrations impairs CSC self-renewal (measured as spherogenesis assay); and (3) these effects are associated to decreased Akt activation.
Why the effects of this drug are more potent on CSCs than on differentiated tumor cells or undifferentiated normal cells (umbilical cord MSCs) is not clear yet. However, these results are in line with the lower tumor incidence in metformin-treated patients. In fact, CSCs being responsible for tumorigenesis, drugs affecting their survival should, in theory, reduce tumor formation, which in diabetic patients is normally increased as compared with non-affected patients.Citation43
The other issue that arises from this study concerns the signal transduction pathway activated by metformin in CSCs. While in most studies metformin inhibits tumor cell line proliferation through the canonical AMPk pathway,Citation31 in GBM TICs, this does not occur, being AMPk non-activated in metformin-treated cells. This finding is strongly corroborated by metabolic data. In fact, AMPk phosphorylation switching on catabolic processes markedly increases glycolytic flux. On the contrary, in TICs, we observed lack of AMPk activation by metformin, associated with a neutral effect on glucose uptake and phosphorylation and, thus, on glycolytic flux. Accordingly, these data strongly suggest that AMPk activation is not the primary pathway involved in metformin effects on cancer cell viability. Conversely, we found a TIC-specific inhibition of Akt: differentiated GBM cells showed a constitutive activation of Akt that, however, was not reduced by metformin, suggesting different regulatory pathways in these cells. The same difference between TIC-enriched cultures and differentiated cells from the same GBM was observed for mTOR phosphorylation at Ser2448, a putative Akt targetCitation38 representing a common downstream target inhibited by both AMPk activation or Akt inhibition.Citation48 More strikingly, in MSCs that are insensitive to the cytotoxic activity of metformin, the drug increased Akt phosphorylation. Thus, downregulation of Akt is likely one of the mechanisms by which metformin reduced CSC survival.Citation5 Accordingly, it was reported that in a mouse model of tobacco-induced lung tumor, in which metformin reduced tumor burden by 50%, the effects on tumor cells were mediated by the inhibition of both ERK1/2 and Akt activation, without any effect on AMPk, which, on the other hand, was activated in normal liver cells of metformin-treated animals.Citation49 This observation is further corroborated by our data in which, in front of the lack of AMPk activation by metformin in GBM TICs, we detected the activation of this kinase in normal MSCs. Thus, different intracellular transduction mechanisms seem to be activated by metformin in normal vs. tumor cells. Importantly, these differential responses, while excluding a non-specific toxicity of the relatively high concentrations of the drugCitation32 that should similarly affect the different cell populations, support recent reports showing a positive effect of metformin on normal neural stem cells’ survival and functioning,Citation50,Citation51 compatible with the Akt activation we observed. Moreover, the apparently clinically irrelevant concentrations required to observe in vitro metformin anti-proliferative effects in tumor cells were proposed to depend on the glucose-rich experimental conditions, in contrast to low glucose conditions observed in tumor cells in vivo: in fact “synthetic lethality” was reported in vitro in glucose-deprived breast cancer cells after metformin treatment.Citation46,Citation52
Importantly, among TIC subpopulations, we found that CD133-expressing cells have greater sensitivity to the antiproliferative effects of metformin than non-selected GBM TICs. Although CD133 was proposed as a specific marker for GBM CSCs,Citation6 several evidences now support that different CSC subpopulations exist within GBM, including cells non-expressing this protein, and several studies reported that CD133- cells can initiate tumors in mice.Citation53 However, the percentage of CD133+ cells was positively correlated with bad prognosis and reduced survival in patients with GBM or other tumors,Citation35,Citation36 and CD133 expression, rather of being an index of CSC content, was proposed to be predictive of potential chemo-resistance.Citation54 In this respect, the ability of metformin to target, with maximal efficiency, CD133+ cells, represents evidence of the possibility that this treatment could, in certain circumstances, overcome pharmacological resistance in GBM or other sensitive tumors. Form a mechanistic point of view, the preferential CSC death induced by metformin could be dependent on its synthetically lethal activity, since high dependency on Warburg-like aerobic glycolysis is believed to be a critical issue for CSC to retain stemness and self-renewal.Citation52 Studies more directly addressing this issue are required to confirm this hypothesis.
In conclusion, we report that metformin powerfully affects human GBM TIC survival, and that this effect is maximally operational on CD133+ CSC subpopulation. Moreover, the effects of metformin are associated with the inhibition of Akt activation, which might represent a biochemical correlate for the observed antiproliferative effects.
Materials and Methods
Human GBM samples
Specimens were obtained from Neurosurgery- IRCCS-AOU San Martino-IST, after Ethical Committee approval for informed consent from patients, and for human samples study. Four tumors (from one female and three male patients, average age 55 y, range 40–67) were used to establish TIC cultures. All patients underwent first-time surgery and never received chemo- or radio-therapy. Upon arrival in the laboratory, samples were immediately processed for isolation of single cells by mechanical dissociation and cultured as previously described.Citation30
Immunohistochemistry (IHC)
GBM sections were stained with anti-Ki-67 (clone MIB-1) mouse monoclonal antibody (Dako), and MIB-1 staining index (MIB-1-SI) was calculated as percentage of positive cells vs. total cell number.Citation55 IHC was performed on Bench Mark-XT Automated System (Ventana Medical Systems).Citation56
TIC cultures
Cells were grown in stem cell-permissive medium [DMEM-F12/Neurobasal (1:1), supplemented with 1% B27 (Life Technologies), 2 mM L-glutamine (Lonza), 1% penicillin-streptomycin (Lonza), 10 ng/ml bFGF and 20 ng/ml EGF (PeproTech)]. After sphere formation, occurring within 2 wk, primary spheres were harvested and dissociated to single cells to control sphere-forming efficiency of each culture. TICs were also grown as monolayer on matrigel (BD Biosciences) as reported.Citation30 In these conditions, after more than 50 passages, cells retained stem cell features.Citation30 This culture condition was used to obtain easier evaluation of cell biology and biochemical experiments, rather than using spheres.
TICs tumorigenicity was tested by 104 cell intracranial inoculation in 6–8-wk-old NOD/SCID mice (Charles River), in compliance with guidelines approved by Ethical Committee for animal use in cancer research at IRCCS-AOU San Martino-IST.
To induce GBM cell differentiation, TIC cultures were shifted to growth factor-deprived medium containing 10% fetal bovine serum (FBS, Lonza) for at least 2 wk.Citation30
Cell survival assay
Mitochondrial activity, as index of cell viability, was evaluated by measuring the reduction of 3-(4,5-dimethylthiazol-2-yl)-2,5-diphenyltetrazolium bromide (MTT, Sigma-Aldrich). Because cells used in this study had different basal proliferation rates, number of cells/well was adjusted (ranging from 2,500 –10,000/well) to allow exponential cell growth for duration of the assay (up to 3 d). After treatments, cells were incubated with MTT (2 mg/ml) for 1 h, formazan crystals dissolved in DMSO and absorbance measured at 570 nm.Citation57
Sphere-formation assay
TICs were plated in 48-well plates at 1,000 cells/well for 4 d before metformin 48 h treatment. The number of spheres in wells was quantified using a digital camera mounted on a transmitted light microscope to image each individual well and visually calculated by three independent operators.
Western blot
To avoid interference of growth factors and supplements, TICs were cultured for 48 h in growth factor-free medium before EGF and/or metformin treatment. Protein extraction, SDS-PAGE and immunocomplex detection was performed as reported.Citation57 Antibodies used were anti-phospho-Akt (Ser-473), anti-Akt, anti-phospho-AMPk, anti-AMPk, anti-phospho-mTOR (Ser2448) and anti beta-tubulin, all from Cell Signaling.
Immunofluorescence (IF)
GBM cells were fixed with 4% paraformaldehyde, permeabilized with PBS/0.1% Triton X-100, blocked with normal goat serum and immunostained with anti-nestin (mouse monoclonal, 1:100, R&D Systems), -Map2 (mouse monoclonal 1:1,000; Chemicon/Millipore), -GFAP (rabbit polyclonal, 1:1,000, Dako), -CD133 (rabbit polyclonal, 1:100, Abcam) and -Ki-67 (mouse monoclonal, 1:100, Dako) antibodies. Fluorochrome-conjugated antibodies (goat anti-mouse and anti-rabbit Alexa Fluor-568 or Alexa Fluor-488, Molecular Probes-Invitrogen) were applied, and nuclei were counterstained with DAPI (Sigma-Aldrich). Data are reported as percentage of immunolabeled cells/10 randomly selected microscopy fields. Slides were photographed with DM2500 microscope (Leica) equipped with DFC350FX digital camera (Leica). Co-localization was analyzed by confocal laser scanning microscopy (Bio-Rad-MRC 1024 ES) and LaserPix software (Bio-Rad).Citation56
Isolation and culture of human umbilical cord-derived mesenchymal stromal cells (MSCs)
Human umbilical cords (n = 3) were collected from full-term women, immediately after caesarean section at the Gynaecology Department of International Evangelical Hospital, after informed consent and approval by Institutional Ethic Committee.
After vessel removal, cords were digested with collagenase I-S (0.5 µg/ml Sigma-Aldrich) for 1 h to expose Wharton-Jelly and isolated cells cultured in DMEM (10% FBS, 2 mM L-Glutamine). MSCs were used after full characterization by flow cytometry (MSC Phenotyping Kit, Miltenyi Biotec), as defined by International Society for Cellular Therapy.Citation58 Briefly, MSCs displayed phenotype negative for hematopoietic antigens (CD45, CD34, CD14) and MHC class-II, but > 95% positive for CD73, CD105, CD90, CD29 and MHC class I. Appropriate isotype-matched were used as controls. Moreover, after incubation in selective media, MSCs differentiated in osteocytic, chondrocytic and adipocytic lineages (data not shown).
Proliferation analysis by dye dilution assay
GBM TICs were labeled with carboxyl-fluorescein succinimidyl ester (CFSE) (5 μM, Molecular Probes, Invitrogen) to track proliferating cells before treatments. Intra-cytoplasmic CFSE equally distributes between daughter cells, allowing discrimination of successive rounds of cell division by halving fluorescence signal. CFSE-positive cells were cultured for 72 h, harvested and washed with PBS for acquisition in a FACSCanto II flow cytometer by FACSDiva software. To discriminate proliferative activity of different TIC subpopulations, cells were labeled with anti-CD133-phychoerithrin-conjugated antibody (Miltenyi) before FACS analysis. A minimum of 50,000 CFSE-positive cells were acquired from each sample; propidium iodide was added to exclude dead cells. To track proliferating cells, FACS data were analyzed using the Proliferation Wizard module of ModFit™ LT version 3.0 software (Verity Software House). Generation number within Proliferation Wizard module was set at 10. The proportions of proliferated cells at each division were obtained by ModFit analysis, which generates histograms of fluorescence intensity by applying deconvolution algorithms.Citation59
Measurement of glucose uptake
To estimate glucose uptake and phosphorylation, 106 cells were suspended in glucose-free PBS-containing (18F)-fluoro-deoxyglucose (FDG) at the concentration of 5 KBq/ml. Once into cytosol via GLUT transporters, FDG is phosphorylated by hexokinases to 6P-FDG that cannot undergo further reactions. Incubation was maintained at 37°C for 30 min, according to previous reports.Citation60 Uptake process was stopped adding 4 ml of PBS before centrifugation at 450 × g for 10 min. Supernatant was removed and cell pellet re-suspended in PBS. Vials containing free and bound activity were simultaneously counted in γ-counter with 10% energy window centered at 511KeV.
FDG retention was measured as the ratio:
FDG uptake = (activity in cell pellet)/(activity in cell pellet + activity in supernatant)
Statistical analysis
Unless specified, all experiments were reproduced at least three times. Data are reported as means ± SEM. Statistical analysis (ANOVA) was performed using SPSS 9.0 software. p ≤ 0.05 was considered statistically significant. Metformin IC50 values were calculated as reportedCitation61 using PRISM 4.0 (Graph-Pad).
| Abbreviations: | ||
| MTT | = | 3-(4,5-dimethylthiazol-2-yl)-2,5-diphenyltetrazolium bromide |
| AMPk | = | AMP kinase |
| CSC | = | cancer stem cell |
| CFSE | = | carboxyl-fluorescein succinimidyl ester |
| FDG | = | (18F)-fluoro-deoxyglucose |
| FBS | = | fetal bovine serum |
| GBM | = | glioblastoma |
| IF | = | immunofluorescence |
| IHC | = | immunohistochemistry |
| MSC | = | mesenchymal stem cell |
| TIC | = | tumor-initiating cell |
Acknowledgments
Supported by grants from Italian Association for Cancer Research (AIRC-2009/IG9089), Progetto Ricerca Ateneo (University of Genova, 2011–2012) and Progetto Ricerca Sanitaria Regione Liguria (2009–10) to T.F., and OPM-2011 Tavola Valdese to International Evangelical Hospital.
Disclosure of Potential Conflicts of Interest
No potential conflicts of interest were disclosed.
Related Research Data
References
- Galli R, Binda E, Orfanelli U, Cipelletti B, Gritti A, De Vitis S, et al. Isolation and characterization of tumorigenic, stem-like neural precursors from human glioblastoma. Cancer Res 2004; 64:7011 - 21; http://dx.doi.org/10.1158/0008-5472.CAN-04-1364; PMID: 15466194
- Magee JA, Piskounova E, Morrison SJ. Cancer stem cells: impact, heterogeneity, and uncertainty. Cancer Cell 2012; 21:283 - 96; http://dx.doi.org/10.1016/j.ccr.2012.03.003; PMID: 22439924
- Baccelli I, Trumpp A. The evolving concept of cancer and metastasis stem cells. J Cell Biol 2012; 198:281 - 93; http://dx.doi.org/10.1083/jcb.201202014; PMID: 22869594
- Campos B, Wan F, Farhadi M, Ernst A, Zeppernick F, Tagscherer KE, et al. Differentiation therapy exerts antitumor effects on stem-like glioma cells. Clin Cancer Res 2010; 16:2715 - 28; http://dx.doi.org/10.1158/1078-0432.CCR-09-1800; PMID: 20442299
- Hambardzumyan D, Squatrito M, Carbajal E, Holland EC. Glioma formation, cancer stem cells, and akt signaling. Stem Cell Rev 2008; 4:203 - 10; http://dx.doi.org/10.1007/s12015-008-9021-5; PMID: 18595010
- Singh SK, Clarke ID, Terasaki M, Bonn VE, Hawkins C, Squire J, et al. Identification of a cancer stem cell in human brain tumors. Cancer Res 2003; 63:5821 - 8; PMID: 14522905
- Eramo A, Ricci-Vitiani L, Zeuner A, Pallini R, Lotti F, Sette G, et al. Chemotherapy resistance of glioblastoma stem cells. Cell Death Differ 2006; 13:1238 - 41; http://dx.doi.org/10.1038/sj.cdd.4401872; PMID: 16456578
- Favoni RE, Daga A, Malatesta P, Florio T. Preclinical studies identify novel targeted pharmacological strategies for treatment of human malignant pleural mesothelioma. Br J Pharmacol 2012; 166:532 - 53; http://dx.doi.org/10.1111/j.1476-5381.2012.01873.x; PMID: 22289125
- Rich JN. Cancer stem cells in radiation resistance. Cancer Res 2007; 67:8980 - 4; http://dx.doi.org/10.1158/0008-5472.CAN-07-0895; PMID: 17908997
- Liu G, Yuan X, Zeng Z, Tunici P, Ng H, Abdulkadir IR, et al. Analysis of gene expression and chemoresistance of CD133+ cancer stem cells in glioblastoma. Mol Cancer 2006; 5:67; http://dx.doi.org/10.1186/1476-4598-5-67; PMID: 17140455
- Cufi S, Corominas-Faja B, Vazquez-Martin A, Oliveras-Ferraros C, Dorca J, Bosch-Barrera J, et al. Metformin-induced preferential killing of breast cancer initiating CD44+CD24-/low cells is sufficient to overcome primary resistance to trastuzumab in HER2+ human breast cancer xenografts. Oncotarget 2012; 3:395 - 8; PMID: 22565037
- Ma Y, Liang D, Liu J, Axcrona K, Kvalheim G, Stokke T, et al. Prostate cancer cell lines under hypoxia exhibit greater stem-like properties. PLoS One 2011; 6:e29170; http://dx.doi.org/10.1371/journal.pone.0029170; PMID: 22216200
- Martins-Neves SR, Lopes AO, do Carmo A, Paiva AA, Simões PC, Abrunhosa AJ, et al. Therapeutic implications of an enriched cancer stem-like cell population in a human osteosarcoma cell line. BMC Cancer 2012; 12:139; http://dx.doi.org/10.1186/1471-2407-12-139; PMID: 22475227
- Meng E, Long B, Sullivan P, McClellan S, Finan MA, Reed E, et al. CD44+/CD24- ovarian cancer cells demonstrate cancer stem cell properties and correlate to survival. Clin Exp Metastasis 2012; 29:939 - 48; http://dx.doi.org/10.1007/s10585-012-9482-4; PMID: 22610780
- Hong Y, Sang M, Shang C, Xue YX, Liu YH. Quantitative analysis of topoisomerase II alpha and evaluation of its effects on cell proliferation and apoptosis in glioblastoma cancer stem cells. Neurosci Lett 2012; 518:138 - 43; http://dx.doi.org/10.1016/j.neulet.2012.04.071; PMID: 22569122
- Chamberlain MC. Temozolomide: therapeutic limitations in the treatment of adult high-grade gliomas. Expert Rev Neurother 2010; 10:1537 - 44; http://dx.doi.org/10.1586/ern.10.32; PMID: 20925470
- Evans JM, Donnelly LA, Emslie-Smith AM, Alessi DR, Morris AD. Metformin and reduced risk of cancer in diabetic patients. BMJ 2005; 330:1304 - 5; http://dx.doi.org/10.1136/bmj.38415.708634.F7; PMID: 15849206
- Bowker SL, Majumdar SR, Veugelers P, Johnson JA. Increased cancer-related mortality for patients with type 2 diabetes who use sulfonylureas or insulin. Diabetes Care 2006; 29:254 - 8; http://dx.doi.org/10.2337/diacare.29.02.06.dc05-1558; PMID: 16443869
- Jiralerspong S, Palla SL, Giordano SH, Meric-Bernstam F, Liedtke C, Barnett CM, et al. Metformin and pathologic complete responses to neoadjuvant chemotherapy in diabetic patients with breast cancer. J Clin Oncol 2009; 27:3297 - 302; http://dx.doi.org/10.1200/JCO.2009.19.6410; PMID: 19487376
- Algire C, Zakikhani M, Blouin MJ, Shuai JH, Pollak M. Metformin attenuates the stimulatory effect of a high-energy diet on in vivo LLC1 carcinoma growth. Endocr Relat Cancer 2008; 15:833 - 9; http://dx.doi.org/10.1677/ERC-08-0038; PMID: 18469156
- Ben Sahra I, Laurent K, Loubat A, Giorgetti-Peraldi S, Colosetti P, Auberger P, et al. The antidiabetic drug metformin exerts an antitumoral effect in vitro and in vivo through a decrease of cyclin D1 level. Oncogene 2008; 27:3576 - 86; http://dx.doi.org/10.1038/sj.onc.1211024; PMID: 18212742
- Kisfalvi K, Eibl G, Sinnett-Smith J, Rozengurt E. Metformin disrupts crosstalk between G protein-coupled receptor and insulin receptor signaling systems and inhibits pancreatic cancer growth. Cancer Res 2009; 69:6539 - 45; http://dx.doi.org/10.1158/0008-5472.CAN-09-0418; PMID: 19679549
- Zakikhani M, Dowling RJ, Sonenberg N, Pollak MN. The effects of adiponectin and metformin on prostate and colon neoplasia involve activation of AMP-activated protein kinase. Cancer Prev Res (Phila) 2008; 1:369 - 75; http://dx.doi.org/10.1158/1940-6207.CAPR-08-0081; PMID: 19138981
- Chen G, Xu S, Renko K, Derwahl M. Metformin inhibits growth of thyroid carcinoma cells, suppresses self-renewal of derived cancer stem cells, and potentiates the effect of chemotherapeutic agents. J Clin Endocrinol Metab 2012; 97:E510 - 20; http://dx.doi.org/10.1210/jc.2011-1754; PMID: 22278418
- Iliopoulos D, Hirsch HA, Struhl K. Metformin decreases the dose of chemotherapy for prolonging tumor remission in mouse xenografts involving multiple cancer cell types. Cancer Res 2011; 71:3196 - 201; http://dx.doi.org/10.1158/0008-5472.CAN-10-3471; PMID: 21415163
- Vazquez-Martin A, Oliveras-Ferraros C, Del Barco S, Martin-Castillo B, Menendez JA. The anti-diabetic drug metformin suppresses self-renewal and proliferation of trastuzumab-resistant tumor-initiating breast cancer stem cells. Breast Cancer Res Treat 2011; 126:355 - 64; http://dx.doi.org/10.1007/s10549-010-0924-x; PMID: 20458531
- Hirsch HA, Iliopoulos D, Tsichlis PN, Struhl K. Metformin selectively targets cancer stem cells, and acts together with chemotherapy to block tumor growth and prolong remission. Cancer Res 2009; 69:7507 - 11; http://dx.doi.org/10.1158/0008-5472.CAN-09-2994; PMID: 19752085
- Bolen S, Feldman L, Vassy J, Wilson L, Yeh HC, Marinopoulos S, et al. Systematic review: comparative effectiveness and safety of oral medications for type 2 diabetes mellitus. Ann Intern Med 2007; 147:386 - 99; PMID: 17638715
- Kast RE, Karpel-Massler G, Halatsch ME. Can the therapeutic effects of temozolomide be potentiated by stimulating AMP-activated protein kinase with olanzepine and metformin?. Br J Pharmacol 2011; 164:1393 - 6; http://dx.doi.org/10.1111/j.1476-5381.2011.01320.x; PMID: 21410456
- Griffero F, Daga A, Marubbi D, Capra MC, Melotti A, Pattarozzi A, et al. Different response of human glioma tumor-initiating cells to epidermal growth factor receptor kinase inhibitors. J Biol Chem 2009; 284:7138 - 48; http://dx.doi.org/10.1074/jbc.M807111200; PMID: 19147502
- Shi WY, Xiao D, Wang L, Dong LH, Yan ZX, Shen ZX, et al. Therapeutic metformin/AMPK activation blocked lymphoma cell growth via inhibition of mTOR pathway and induction of autophagy. Cell Death Dis 2012; 3:e275; http://dx.doi.org/10.1038/cddis.2012.13; PMID: 22378068
- Martin-Castillo B, Vazquez-Martin A, Oliveras-Ferraros C, Menendez JA. Metformin and cancer: doses, mechanisms and the dandelion and hormetic phenomena. Cell Cycle 2010; 9:1057 - 64; http://dx.doi.org/10.4161/cc.9.6.10994; PMID: 20305377
- Favoni RE, Pattarozzi A, Lo Casto M, Barbieri F, Gatti M, Paleari L, et al. Gefitinib targets EGFR dimerization and ERK1/2 phosphorylation to inhibit pleural mesothelioma cell proliferation. Curr Cancer Drug Targets 2010; 10:176 - 91; http://dx.doi.org/10.2174/156800910791054130; PMID: 20088784
- Florio T, Barbieri F. The status of the art of human malignant glioma management: the promising role of targeting tumor-initiating cells. Drug Discov Today 2012; 17:1103 - 10; http://dx.doi.org/10.1016/j.drudis.2012.06.001; PMID: 22704957
- He J, Shan Z, Li L, Liu F, Liu Z, Song M, et al. Expression of glioma stem cell marker CD133 and O6-methylguanine-DNA methyltransferase is associated with resistance to radiotherapy in gliomas. Oncol Rep 2011; 26:1305 - 13; PMID: 21769436
- Metellus P, Nanni-Metellus I, Delfino C, Colin C, Tchogandjian A, Coulibaly B, et al. Prognostic impact of CD133 mRNA expression in 48 glioblastoma patients treated with concomitant radiochemotherapy: a prospective patient cohort at a single institution. Ann Surg Oncol 2011; 18:2937 - 45; http://dx.doi.org/10.1245/s10434-011-1703-6; PMID: 21479688
- Soeda A, Inagaki A, Oka N, Ikegame Y, Aoki H, Yoshimura S, et al. Epidermal growth factor plays a crucial role in mitogenic regulation of human brain tumor stem cells. J Biol Chem 2008; 283:10958 - 66; http://dx.doi.org/10.1074/jbc.M704205200; PMID: 18292095
- Navé BT, Ouwens M, Withers DJ, Alessi DR, Shepherd PR. Mammalian target of rapamycin is a direct target for protein kinase B: identification of a convergence point for opposing effects of insulin and amino-acid deficiency on protein translation. Biochem J 1999; 344:427 - 31; http://dx.doi.org/10.1042/0264-6021:3440427; PMID: 10567225
- Qu Z, Zhang Y, Liao M, Chen Y, Zhao J, Pan Y. In vitro and in vivo antitumoral action of metformin on hepatocellular carcinoma. Hepatol Res 2012; 42:922 - 33; http://dx.doi.org/10.1111/j.1872-034X.2012.01007.x; PMID: 22524458
- Gupta PB, Onder TT, Jiang G, Tao K, Kuperwasser C, Weinberg RA, et al. Identification of selective inhibitors of cancer stem cells by high-throughput screening. Cell 2009; 138:645 - 59; http://dx.doi.org/10.1016/j.cell.2009.06.034; PMID: 19682730
- Sachlos E, Risueño RM, Laronde S, Shapovalova Z, Lee JH, Russell J, et al. Identification of drugs including a dopamine receptor antagonist that selectively target cancer stem cells. Cell 2012; 149:1284 - 97; http://dx.doi.org/10.1016/j.cell.2012.03.049; PMID: 22632761
- Garrett CR, Hassabo HM, Bhadkamkar NA, Wen S, Baladandayuthapani V, Kee BK, et al. Survival advantage observed with the use of metformin in patients with type II diabetes and colorectal cancer. Br J Cancer 2012; 106:1374 - 8; http://dx.doi.org/10.1038/bjc.2012.71; PMID: 22421948
- Colao A, Vitale P, Faggiano A. Diabetes and cancer. Front Endocrinol (Lausanne) 2011; 2:22; http://dx.doi.org/10.3389/fendo.2011.00022; PMID: 22649367
- Sikka A, Kaur M, Agarwal C, Deep G, Agarwal R. Metformin suppresses growth of human head and neck squamous cell carcinoma via global inhibition of protein translation. Cell Cycle 2012; 11:1374 - 82; http://dx.doi.org/10.4161/cc.19798; PMID: 22421144
- Rattan R, Ali Fehmi R, Munkarah A. Metformin: an emerging new therapeutic option for targeting cancer stem cells and metastasis. J Oncol 2012; 2012:928127; http://dx.doi.org/10.1155/2012/928127; PMID: 22701483
- Del Barco S, Vazquez-Martin A, Cufí S, Oliveras-Ferraros C, Bosch-Barrera J, Joven J, et al. Metformin: multi-faceted protection against cancer. Oncotarget 2011; 2:896 - 917; PMID: 22203527
- Lee J, Kotliarova S, Kotliarov Y, Li A, Su Q, Donin NM, et al. Tumor stem cells derived from glioblastomas cultured in bFGF and EGF more closely mirror the phenotype and genotype of primary tumors than do serum-cultured cell lines. Cancer Cell 2006; 9:391 - 403; http://dx.doi.org/10.1016/j.ccr.2006.03.030; PMID: 16697959
- Vakana E, Platanias LC. AMPK in BCR-ABL expressing leukemias. Regulatory effects and therapeutic implications. Oncotarget 2011; 2:1322 - 8; PMID: 22249159
- Memmott RM, Mercado JR, Maier CR, Kawabata S, Fox SD, Dennis PA. Metformin prevents tobacco carcinogen--induced lung tumorigenesis. Cancer Prev Res (Phila) 2010; 3:1066 - 76; http://dx.doi.org/10.1158/1940-6207.CAPR-10-0055; PMID: 20810672
- Menendez JA, Vazquez-Martin A. Rejuvenating regeneration: Metformin activates endogenous adult stem cells. Cell Cycle 2012; 11:3521 - 2; http://dx.doi.org/10.4161/cc.21878; PMID: 22935702
- Wang J, Gallagher D, DeVito LM, Cancino GI, Tsui D, He L, et al. Metformin activates an atypical PKC-CBP pathway to promote neurogenesis and enhance spatial memory formation. Cell Stem Cell 2012; 11:23 - 35; http://dx.doi.org/10.1016/j.stem.2012.03.016; PMID: 22770240
- Menendez JA, Oliveras-Ferraros C, Cufí S, Corominas-Faja B, Joven J, Martin-Castillo B, et al. Metformin is synthetically lethal with glucose withdrawal in cancer cells. Cell Cycle 2012; 11:2782 - 92; http://dx.doi.org/10.4161/cc.20948; PMID: 22809961
- Joo KM, Kim SY, Jin X, Song SY, Kong DS, Lee JI, et al. Clinical and biological implications of CD133-positive and CD133-negative cells in glioblastomas. Lab Invest 2008; 88:808 - 15; http://dx.doi.org/10.1038/labinvest.2008.57; PMID: 18560366
- Kemper K, Versloot M, Cameron K, Colak S, de Sousa e Melo F, de Jong JH, et al. Mutations in the Ras-Raf Axis underlie the prognostic value of CD133 in colorectal cancer. Clin Cancer Res 2012; 18:3132 - 41; http://dx.doi.org/10.1158/1078-0432.CCR-11-3066; PMID: 22496204
- Würth R, Barbieri F, Bajetto A, Pattarozzi A, Gatti M, Porcile C, et al. Expression of CXCR7 chemokine receptor in human meningioma cells and in intratumoral microvasculature. J Neuroimmunol 2011; 234:115 - 23; http://dx.doi.org/10.1016/j.jneuroim.2011.01.006; PMID: 21316111
- Barbieri F, Bajetto A, Stumm R, Pattarozzi A, Porcile C, Zona G, et al. Overexpression of stromal cell-derived factor 1 and its receptor CXCR4 induces autocrine/paracrine cell proliferation in human pituitary adenomas. Clin Cancer Res 2008; 14:5022 - 32; http://dx.doi.org/10.1158/1078-0432.CCR-07-4717; PMID: 18698020
- Pattarozzi A, Gatti M, Barbieri F, Würth R, Porcile C, Lunardi G, et al. 17beta-estradiol promotes breast cancer cell proliferation-inducing stromal cell-derived factor-1-mediated epidermal growth factor receptor transactivation: reversal by gefitinib pretreatment. Mol Pharmacol 2008; 73:191 - 202; http://dx.doi.org/10.1124/mol.107.039974; PMID: 17959712
- Dominici M, Le Blanc K, Mueller I, Slaper-Cortenbach I, Marini F, Krause D, et al. Minimal criteria for defining multipotent mesenchymal stromal cells. The International Society for Cellular Therapy position statement. Cytotherapy 2006; 8:315 - 7; http://dx.doi.org/10.1080/14653240600855905; PMID: 16923606
- Givan AL, Fisher JL, Waugh M, Ernstoff MS, Wallace PK. A flow cytometric method to estimate the precursor frequencies of cells proliferating in response to specific antigens. J Immunol Methods 1999; 230:99 - 112; http://dx.doi.org/10.1016/S0022-1759(99)00136-2; PMID: 10594357
- Hofmann M, Wollert KC, Meyer GP, Menke A, Arseniev L, Hertenstein B, et al. Monitoring of bone marrow cell homing into the infarcted human myocardium. Circulation 2005; 111:2198 - 202; http://dx.doi.org/10.1161/01.CIR.0000163546.27639.AA; PMID: 15851598
- Barbieri F, Würth R, Favoni RE, Pattarozzi A, Gatti M, Ratto A, et al. Receptor tyrosine kinase inhibitors and cytotoxic drugs affect pleural mesothelioma cell proliferation: insight into EGFR and ERK1/2 as antitumor targets. Biochem Pharmacol 2011; 82:1467 - 77; http://dx.doi.org/10.1016/j.bcp.2011.07.073; PMID: 21787763