Abstract
Cigarette smoke has been directly implicated in the disease pathogenesis of a plethora of different human cancer subtypes, including breast cancers. The prevailing view is that cigarette smoke acts as a mutagen and DNA damaging agent in normal epithelial cells, driving tumor initiation. However, its potential negative metabolic effects on the normal stromal microenvironment have been largely ignored. Here, we propose a new mechanism by which carcinogen-rich cigarette smoke may promote cancer growth, by metabolically “fertilizing” the host microenvironment. More specifically, we show that cigarette smoke exposure is indeed sufficient to drive the onset of the cancer-associated fibroblast phenotype via the induction of DNA damage, autophagy and mitophagy in the tumor stroma. In turn, cigarette smoke exposure induces premature aging and mitochondrial dysfunction in stromal fibroblasts, leading to the secretion of high-energy mitochondrial fuels, such as L-lactate and ketone bodies. Hence, cigarette smoke induces catabolism in the local microenvironment, directly fueling oxidative mitochondrial metabolism (OXPHOS) in neighboring epithelial cancer cells, actively promoting anabolic tumor growth. Remarkably, these autophagic-senescent fibroblasts increased breast cancer tumor growth in vivo by up to 4-fold. Importantly, we show that cigarette smoke-induced metabolic reprogramming of the fibroblastic stroma occurs independently of tumor neo-angiogenesis. We discuss the possible implications of our current findings for the prevention of aging-associated human diseases and, especially, common epithelial cancers, as we show that cigarette smoke can systemically accelerate aging in the host microenvironment. Finally, our current findings are consistent with the idea that cigarette smoke induces the “reverse Warburg effect,” thereby fueling “two-compartment tumor metabolism” and oxidative mitochondrial metabolism in epithelial cancer cells.
Introduction
Cigarette smoking and/or tobacco consumption has been linked to nearly one-third of all cancer-related deaths.Citation1-Citation5 Although cigarette smoke is most often associated as a caustive agent in human lung cancers, it also clearly has pervasive systemic effects. For example, cigarette smoke increases the risk for the development of many different types of human cancers, including head and neck, bladder, pancreatic, stomach, liver, ovarian, colon, prostate and breast cancers.Citation1-Citation5 During the 20th century, it has been estimated that tobacco use contributed significantly to the premature deaths of nearly 100 million people world-wide, and it is still considered the single most preventable cause of premature death.
Cigarette smoke contains a complex mixture of > 7,000 chemicals and toxic substances and > 70 known mutagens or carcinogens, most notably the polycyclic aromatic hydrocarbons, such as benzo(a)pyrene (BAP) (www.cancerresearchuk.org/cancer-info/healthyliving/smokingandtobacco). Other examples of cancer-causing agents included are: tar, arsenic, benzene, cadmium, formaldehyde, polonium-210, chromium, 1,3-butadiene, nitrosamines, acrolein, acetaldehyde, hydrazine and other heavy metals (nickel, cobalt and beryllium). Other metabolic poisons included are: hydrogen cyanide, carbon monoxide, nitrogen oxides, ammonia, sulfur dioxide, hydrogen sulfide, pyridine and toluene. Finally, cigarette smoke also contains the dangerous addictive drug nicotine.
Despite a wealth of information on how cigarette smoke directly affects whole animal models and various epithelial and endothelial cell types, relatively little is known regarding how cigarette smoke exposure affects the stromal microenvironment.
Here, we show that cigarette smoke exposure induces autophagy and premature aging (senescence) in immortalized human stromal fibroblasts. These autophagic-senescent fibroblasts then acquire the ability to metabolically promote tumor growth in a paracine fashion. This provides a new mechanism to understand why tobacco smoke exposure promotes both tumor initiation and progression, by providing high-energy mitochondrial fuels to facilitate tumor growth and metastatic progression.
Results
Cigarette smoke extract (CSE) induces senescence in stromal fibroblasts
Previously, we induced senescence in human immortalized hTERT-BJ1 fibroblasts via the overexpression of the cyclin-dependent kinase (CDK) inhibitors p16, p21 and p19.Citation6,Citation7 Importantly, in xenograft models, these senescent fibroblasts greatly promoted the in vivo growth of co-injected breast cancer cells.Citation6,Citation7 Notably, Nyunoya et al. have suggested that cigarette smoke extract (CSE) drives senescence in diploid lung fibroblasts.Citation8 Therefore, we set out to examine if CSE can induce senescence in hTERT-immortalized fibroblasts.
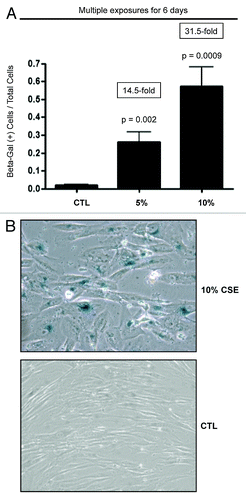
hTERT-BJ1 fibroblasts were exposed every two days to fresh 5% or 10% CSE for 6 days. As critical negative controls, fibroblasts were left untreated, and the media was replaced every 2 days. shows that the number of senescence-associated β-galactosidase (SA β-gal)-positive cells was increased after 5% and 10% CSE treatment by ~14.5-fold and ~31.5-fold, respectively, relative to untreated control cells. shows representative images of control and CSE-treated fibroblasts, demonstrating the difference in cell density and shape of CSE-treated cells, indicative of a senescent phenotype.
Figure 1. CSE promotes senescence in human fibroblasts. (A) Immortalized human fibroblasts were plated in 6-well plate. Cells were treated three times with 5% or 10% CSE, or left untreated (CTL) over a 6-day period. To measure senescence, cells were stained with β-gal. The average number of β-Gal-positive cells was determined as β-Gal-positive cells per total cell number per field. The numbers of senescent β-Gal-positive cells were elevated in 5% CSE and 10% CSE-treated fibroblasts by ~14.5-fold and ~31.5-fold, respectively. p values are as shown. (B) Representative phase images illustrating β-Gal staining in control and 10% CSE-treated fibroblasts are shown. β-Gal staining is virtually absent in control cells. Note the flat shape of CSE-treated cells, indicative of a senescent phenotype.
CSE treatment induces DNA damage and activates the p53-p21-pRb pathway
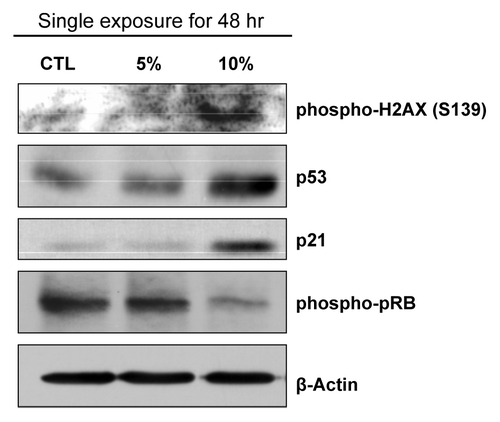
Next, we aimed to study the signaling pathway(s) that induce senescence and halt cell division in CSE-treated fibroblasts. Fibroblasts treated for 48 h with a single exposure of CSE displayed an elevation of phosphorylated H2AX on Serine-139 (). After DNA damage, H2AX is rapidly phosphorylated by ATM.Citation9 This process is crucial in early stages of DNA damage to recruit DNA damage response proteins.Citation9 Subsequent to DNA damage, p53 accumulates and increases the levels of p21.Citation8,Citation10,Citation11 p21 activates Rb by de-phosphorylation, initiating cell cycle arrest and senescence.Citation8,Citation10,Citation11 Immunoblot analysis shows that upon 10% CSE-treatment, fibroblasts display an increase in p53 and p21 levels and an increase in activated Rb (the hypo-phosphorylated form) (). Moreover, no increases in p53 or p21 levels or in RB activation were detected in 5% CSE-treated fibroblasts. These data suggest that treatment with a high concentration of CSE for a short period induces DNA damage, accumulation of p53 and p21 and activation of Rb, which drives the fibroblasts toward senescence.
Figure 2. CSE-induced senescence is activated by the p53-p21-pRb pathway. Immunoblot analysis shows that after 48-h of treatment, CSE activates p53 and p21 while decreasing RB phosphorylation, which are markers for senescence and cell cycle arrest. Importantly, phospho-gamma-H2AX, a marker of DNA damage, is increased by CSE treatment, as expected. β-actin was used as a protein loading control.
CSE treatment promotes autophagy and mitophagy, downregulating the expression of mitochondrial OXPHOS complexes
Upon DNA damage, p53 is activated and targets several pathways modulating autophagy, such as AMPK, DRAM and BNIP3.Citation12,Citation13 Importantly, immunoblot analysis demonstrates that a single exposure to CSE induces the elevated expression of BNIP3 (a mitophagy marker) and AMPK (an energy deficiency sensor) () in hTERT-fibroblasts. To examine if longer exposure to CSE can also induce senescence and further promote autophagy, immortalized fibroblasts were treated with 10% CSE every 2 d for 14 d. Cells were lysed at day 2 and day 14. demonstrates that prolonged exposure to CSE highly elevates the expression of autophagy (LAMP2 and LC3B) and senescence (p16) markers. As expected, phospho-H2AX is also highly elevated after prolonged CSE treatment, indicative of DNA damage.
Figure 3. CSE treatment drives autophagy and mitochondrial dysfunction. (A) BNIP3, a marker of mitophagy (mitochondrial autophagy) and the energy sensor AMPK are elevated after 48 h of CSE treatment. (B) Longer treatment with 10% CSE further elevates autophagy and senescence. Immortalized fibroblasts were treated with 10% CSE every 2 d for the indicated times (2 or 14 d). Immunoblot analysis demonstrates that prolonged exposure to CSE dramatically elevates the expression of autophagy (LAMP2 and LC3B) and senescence (p16) markers. (C) CSE treatment inhibits the expression of mitochondrial OXPHOS complexes. Multiple CSE exposures (5% or 10% CSE treatment every 2 days for 6 days) downregulate OXPHOS complexes I, II, IV in hTERT fibroblasts, relative to control fibroblasts. β-actin was used as a protein loading control.
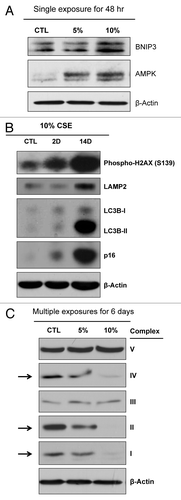
Since BNIP3 and AMPK were elevated in CSE-treated fibroblasts, we also examined the expression of the mitochondrial OXPHOS complexes. Remarkably, shows that treatment with multiple exposures of 5% and 10% of CSE for 6 days decreases mitochondrial complexes I, II and IV in hTERT fibroblasts. These data demonstrate that CSE treatment elevates autophagy while decreasing the expression of mitochondrial OXPHOS complexes.
CSE-treated fibroblasts produce high levels of L-lactate and ketone bodies, indicative of mitochondrial dysfunction: A shift toward glycolysis and ketogenesis
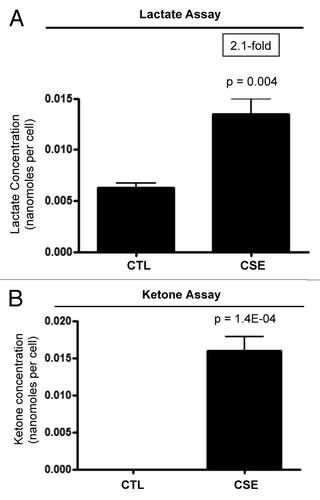
Since CSE inhibits the expression of mitochondrial OXPHOS complexes (), CSE may induce the metabolic reprogramming of fibroblasts toward glycolytic metabolism. It is also well known that mitochondrial dysfunction leads to the increased generation of ketone bodies. So, we hypothesized that CSE treatment may drive the increased production of L-lactate and ketone bodies. Therefore, L-lactate and β-hydroxybutyrate production was measured in fibroblasts treated with 10% CSE for 6 days. The media was replaced with fresh CSE-containing media every 2 days, and in the last CSE treatment, the media was replaced with 10% CSE in phenol-free DMEM supplemented with 2% FBS. As critical negative controls, untreated fibroblasts were processed in parallel. shows that L-lactate production is significantly increased by ~2.1-fold in CSE-treated fibroblasts relative to controls. Furthermore, CSE treatment significantly increases β-hydroxybutyrate production in immortalized fibroblasts (). These data clearly indicate that CSE treatment elevates glycolysis and ketone production in immortalized fibroblasts.
Figure 4. CSE-treatment increases the production of L-lactate and ketone bodies. hTERT-fibroblasts were treated with 10% CSE every 2 days for 6 days. In the last 2 days, fibroblasts were incubated with assay media (phenol-free DMEM supplemented with 2% FBS) supplemented with 10% CSE or left untreated. Then, the media was collected and used to measure L-lactate and ketone production in CSE-treated fibroblasts. Metabolite concentrations were normalized by total cell number. (A) Multiple exposures to CSE doubled L-lactate production in hTERT fibroblasts. p values are as shown. (B) Multiple exposures to CSE greatly induced β-hydroxybutyrate production in hTERT fibroblasts. p values are as shown.
CSE-treated fibroblasts enhance tumor growth, independently of neo-angiogenesis
In previous studies, we have shown that autophagic and/or glycolytic fibroblasts greatly promote the in vivo growth of co-injected triple-negative human breast cancer cells (MDA-MB-231).Citation13 Thus, we set out to examine if CSE-treated fibroblasts can promote tumor growth when co-injected with MDA-MB-231 cells. After 6 days of 10% CSE treatment, CSE-treated fibroblasts were co-injected with MDA-MB-231 cells into the flanks of nude mice. Tumor growth was monitored over a 22-day period. Tumor growth curves directly show that CSE-treated fibroblasts significantly increase tumor growth rates, in a paracine fashion, relative to control fibroblasts (). At day 22, the tumors were surgically harvested, and their weights and volumes were measured. Importantly, CSE-treated fibroblasts increased tumor weight and volume by ~2.8-fold and ~4.2-fold, respectively ().
Figure 5. CSE-treated fibroblasts promote tumor growth. hTERT-fibroblasts were treated with 10% CSE every 2 days for 6 days, or left untreated. On the last day, control or CSE-treated fibroblasts were trypsinized and co-injected with MDA-MB-231 cells (at a ratio of 6 × 10⁵ of fibroblasts to 1 × 10⁶ MDA-MB-231 cells). (A) Tumor growth curves. Note that CSE-treated fibroblasts significantly enhanced tumor growth, relative to control fibroblasts. (B) Tumor volume and weight. At day 22, mice were sacrificed, and the tumors were surgically excised, weighed and measured with electronic calipers. CSE-treated fibroblasts increased tumor weight and volume by 3- and 4-fold, respectively, relative to control fibroblasts. (C) Tumor angiogenesis and vessel quantification (number of CD31-positive vessels per field). Tumor frozen sections were immuno-stained with anti-CD31 antibodies, and the number of CD31-positive vessels per field was scored. No significant differences in vessel density were detected in tumors generated from CSE-treated fibroblasts, relative to control fibroblasts. This indicates that angiogenesis did not promote tumor growth in our experimental model. n ≥ 9 injections, for each experimental condition.
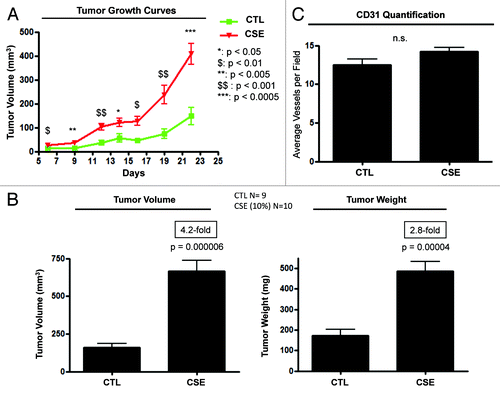
To examine if CSE-treated fibroblasts increased tumor growth in an angiogenesis-dependent fashion, control and CSE-tumors were immunostained with anti-CD31 antibodies. Quantification of CD31-positive vessels indicated that CSE-tumors did not display any significant increase in tumor neo-angiogenesis relative to control tumors (). These results indicate that CSE-treated fibroblasts promote tumor growth, independently of tumor angiogenesis.
Discussion
Recently, we showed that autophagic and/or senescent cancer-associated fibroblasts (CAFs) promote tumor growth in preclinical animal models when co-injected with human breast cancer cell lines.Citation6,Citation13 We have termed this phenomenon the “autophagic tumor stroma model of cancer” or “two-compartment tumor metabolism.”Citation6,Citation7,Citation13-Citation18 We have demonstrated that cancer cells release ROS into the tumor microenvironment. In turn, ROS initiates autophagy and mitophagy in neighboring fibroblasts.Citation14-Citation17 These events inhibit mitochondrial metabolism, driving aerobic glycolysis in autophagic and senescent fibroblasts.Citation13 Consequently, these fibroblasts now begin to secrete energy-rich molecules (L-lactate, ketone bodies and glutamine) into the tumor microenvironment.Citation7,Citation15,Citation16 Cancer cells then consume these secreted energy-rich molecules via mitochondrial oxidative phosphorylation (OXPHOS).Citation18 This stromal-epithelial metabolic coupling produces sufficient energy that supports cancer cells to sustain proliferation and invasion.
Here, we examined if CSE alters cancer-associated fibroblast metabolism and breast cancer tumor growth. Our data demonstrate that CSE-treated fibroblasts display an up to 31.5-fold increase in fibroblasts positive for the senescence marker β-Gal. We show that this was due to the activation of the DNA damage response and the p53-p21-pRb pathway. Furthermore, an elevation in senescence was associated with increased markers of autophagy and mitophagy. Our immunoblot analyses showed that multiple exposures to CSE inhibited the expression of mitochondrial OXPHOS complexes. Consistent with our current findings, van der Toorn et. al., showed that CSE blocks the mitochondrial respiratory chain and ATP production in lung fibroblasts.Citation19
Thus, CSE exposure should drive hTERT-BJ1 fibroblasts toward glycolysis and ketogenesis. As predicted, we observed that CSE-treated fibroblasts displayed a significant increase in L-lactate and ketone production. Similarly, CSE-treated esophageal epithelial cells display higher glucose consumption and lactate production.Citation20
We also co-injected CSE-treated fibroblasts with breast cancer cells. At day 22, the tumors were surgically excised, weighed and measured using calipers. Remarkably, CSE-treated fibroblasts increased tumor growth by up to 4-fold, without any significant increases in tumor angiogenesis.
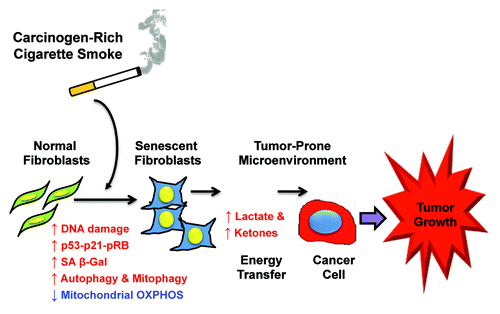
Since we show that cigarette smoke induces premature aging (senescence) in stromal fibroblasts, our current studies may also have implications for understanding how cigarette smoke systemically induces accelerated aging in the host microenvironment (). This provides a novel experimental model for identifying new therapeutic interventions for the prevention of epithelial cancers and, potentially, other aging-associated diseases that are due to increased oxidative stress and accumulated DNA damage.
Figure 6. Cigarette smoke exposure metabolically promotes cancer growth via autophagy and premature aging in the tumor microenvironment. Here, we show that CSE-treatment of stromal fibroblasts is sufficient to induce biological markers of autophagy, mitophagy and premature aging (senescence). These autophagic-senescent fibroblasts over-produce L-lactate and ketone bodies, due to the onset of mitochondrial dysfunction. L-lactate and ketone bodies then serve as high-energy mitochondrial fuels to drive anabolic tumor growth and OXPHOS in epithelial cancer cells.
Finally, our recent studies show that both genetic and environmental factors facilitate the induction of the cancer-associated fibroblast phenotype by common mechanism(s) (). For example, breast cancer-derived epithelial cells [sporadic or familial (BRCA1(−/−)] induce the cancer-associated fibroblast phenotype by driving oxidative stress and Warburg-like metabolism in the stromal microenvironment.Citation14,Citation21-Citation23 In addition, ethanol exposureCitation24 and cigarette smoke (this report) can induce the cancer-associated fibroblast phenotype by the same metabolic mechanism(s) (DNA damage, oxidative stress and autophagy/mitophagy), explaining how both genetic and behavioral factors act in concert to “fuel” anabolic tumor growth and mitochondrial OXPHOS in cancer cells. Published clinical studies with Metformin (a mitochondrial “poison”) provide the necessary proof-of-principle that targeting cancer cell mitochondria can confer significant cancer chemo-prevention (see refs. within Citation24–Citation29).
Figure 7. Genetic and environmental factors induce the cancer-associated fibroblast phenotype via common molecular mechanism(s). Recently, we have shown that human breast cancer cells (sporadic or familial [BRCA1(−/−)] induce the cancer-associated fibroblast phenotype, by driving Warburg-like metabolism in the stromal host microenvironment via oxidative stress. Similarly, alcohol consumption (EtOH) and cigarette smoke (carcinogens) also induce the cancer-associated fibroblast phenotype (by mimicking the behavior of cancer cells), explaining how both genetic factors and environmental/behavioral factors act via a convergent molecular mechanism to “fuel” anabolic tumor growth and oxidative mitochondrial metabolism (OXPHOS) in epithelial cancer cells. Studies on Metformin (a mitochondrial inhibitor and powerful mitochondrial antioxidant) have already provided the proof-of-concept that targeting cancer cell mitochondrial function results in significant cancer chemo-prevention, with limited side effects in large patient populations.
![Figure 7. Genetic and environmental factors induce the cancer-associated fibroblast phenotype via common molecular mechanism(s). Recently, we have shown that human breast cancer cells (sporadic or familial [BRCA1(−/−)] induce the cancer-associated fibroblast phenotype, by driving Warburg-like metabolism in the stromal host microenvironment via oxidative stress. Similarly, alcohol consumption (EtOH) and cigarette smoke (carcinogens) also induce the cancer-associated fibroblast phenotype (by mimicking the behavior of cancer cells), explaining how both genetic factors and environmental/behavioral factors act via a convergent molecular mechanism to “fuel” anabolic tumor growth and oxidative mitochondrial metabolism (OXPHOS) in epithelial cancer cells. Studies on Metformin (a mitochondrial inhibitor and powerful mitochondrial antioxidant) have already provided the proof-of-concept that targeting cancer cell mitochondrial function results in significant cancer chemo-prevention, with limited side effects in large patient populations.](/cms/asset/dcbcf955-942a-4e50-82f5-ac2c8e7c8f96/kccy_a_10923722_f0007.gif)
Materials and Methods
Materials, cell lines and culture media
Human immortalized fibroblasts (hTERT-BJ1) and human triple-negative breast cancer cells (MDA-MB-231) were cultured in Dulbecco’s modified Eagle’s medium (DMEM), supplemented with 10% fetal bovine serum in a 37°C humidified atmosphere containing 5% CO2, unless otherwise noted. Antibodies were purchased from commercial sources: anti-phospho-H2AX (2577, Cell Signaling); anti-phospho-RB (ab47763, Abcam); anti-BNIP3 (ab65874, Abcam); anti-LAMP2 (sc-18822; Santa Cruz Inc.); anti-LC3 A/B (ab58610, Abcam) or anti-LC3β (sc-28266, Santa Cruz Inc.); anti-p21 (sc-0911, Santa Cruz Inc.); anti-p53 (OP43, Calbiochem); anti-p16 (sc-759, Santa Cruz Inc.); anti-β actin (A5441, Sigma); anti-OXPHOS (MA601, Mitoscience); anti-AMPK (2532; Cell Signaling).
Preparation of the cigarette smoke extract (CSE)
The CSE preparation was as previously described,Citation30 with minor modifications. Briefly, 40 ml of one puff was drawn from a lit cigarette (filtered cigarettes; Marlboro Red containing 16 mg of tar and 1.2 mg of nicotine per cigarette; Marlboro, Philip Morris). Using a three-way stopcock, the smoke was drawn and dissolved vigorously into a 60-ml syringe, containing 10 ml of complete media. Each cigarette was exhausted by 7–10 puffs and dissolved in 10 ml of complete media. For each treatment, the CSE-media was prepared fresh (no more than 30 min) and filtered through a 0.22 μm filter. The filtered media was considered as a 100% CSE stock.
Immunoblotting
Cell protein lysates were obtained by cell scraping with lysis buffer (10 mM Tris, pH 7.5, 150 mM NaCl, 1% Triton X-100 and 60 mM n-octylglucoside) containing protease inhibitors (Boehringer Mannheim). Samples were incubated on a rotating platform at 4°C and were then centrifuged at 12,000 × g for 10 min (at 4°C) to remove insoluble debris. Protein concentrations were determined using the BCA reagent (Pierce). Samples were then separated by SDS-PAGE (10% acrylamide) and transferred to nitrocellulose. All subsequent wash buffers contained 10 mM Tris, pH 8.0, 150 mM NaCl, 0.1% Tween 20, which was supplemented with 5% nonfat dry milk for the blocking solution and 1% bovine serum albumin (Sigma) for the antibody diluent. Horseradish peroxidase-conjugated secondary antibodies were used to visualize bound primary antibodies with an ECL detection kit (Pierce).
Lactate assay
L-lactate levels were assessed according to the manufacturer’s instructions using the EnzyChromTM L-Lactate Assay Kit (cat #ECLC-100, BioAssay Systems). After 4 days of CSE treatment, 1.2 × 10⁵ cells were seeded in 12-well plates in 10% CSE containing media. The next day, the media was switched to phenol-free DMEM with 2% FBS containing 10% CSE. As control, untreated cells were processed in parallel. After 48 h, the media was collected, and the concentration of L-lactate was measured. Results were normalized for total cell number.
Ketone body assay
The media collected for the lactate assay was used to measure the ketone concentration. Ketones concentration was measured according the manufacturer’s instructions using the β-hydroxy-butyrate (β-HB) Assay Kit (Biovision, #K632). Results were normalized for total cell number.
Senescence assay
Cells were plated into 6-well plates in complete media. Then, cells were treated with CSE every 2 days for total of 6 days. At day 6, cells were fixed and incubated with a β-galactosidase staining solution (Cell Signaling, #9860) overnight at 37°C in a dry incubator without CO2. To measure the average of β-gal-positive cells, using an inverted microscope, the count of stained cell was divided over the total number of cells in five random fields.
Xenograft studies
All animals were maintained in a pathogen-free environment/barrier facility, under National Institutes of Health (NIH) guidelines. All animal protocols were approved by the Institutional Animal Care and Use Committee (IACUC). Tumor cells (MDA-MB-231; 1 × 10⁶ cells) were co-injected with hTERT-BJ1 fibroblasts (6 × 10⁵ cells) in 100 μl of sterile PBS into the flanks of athymic nude mice (NCRNU; Taconic Farms; 6–8 weeks of age). Mice were then sacrificed at 22 d post-injection; tumors were surgically excised to determine their weight and volume (using electronic calipers). Tumor volumes were calculated using the formula V = a b2/2, where V is the tumor volume, a is the length of the long axis, and b is the length of the short axis.
Angiogenesis quantification
To quantify tumor angiogenesis, CD31-positive vessels were enumerated in 4–6 fields within the central area of each tumor using a 20× objective lens and an ocular grid (0.25 mm2 per field). The total numbers of vessel per unit area was calculated using ImageJ, and the data was represented graphically.
Statistical analysis
Statistical significance was examined by Student’s t-test. Values of p < 0.05 were considered significant.
Acknowledgments
F.S. was the recipient of a Young Investigator Award from the Breast Cancer Alliance. U.E.M. was supported by a Young Investigator Award from the Margaret Q. Landenberger Research Foundation. Funds were also contributed by the Margaret Q. Landenberger Research Foundation (to M.P.L.).
This work was also supported, in part, by a Centre grant in Manchester from Breakthrough Breast Cancer in the UK and an Advanced ERC Grant from the European Research Council.
Also, these developments were made possible through the resources of Thomas Jefferson University.
Submited
01/18/13
Disclosure of Potential Conflicts of Interest
No potential conflicts of interest were disclosed.
Related Research Data
References
- Reynolds P. Smoking and Breast Cancer.. J Mammary Gland Biol Neoplasia 2013; In press PMID: 23179580
- Reynolds P, Goldberg D, Hurley S, Nelson DO, Largent J, Henderson KD, et al. Passive smoking and risk of breast cancer in the California teachers study. Cancer Epidemiol Biomarkers Prev 2009; 18:3389 - 98; http://dx.doi.org/10.1158/1055-9965.EPI-09-0936; PMID: 19959687
- Reynolds P, Hurley S, Goldberg D, California Teachers Study Steering Committee. Accumulating evidence on passive and active smoking and breast cancer risk. Int J Cancer 2006; 119:239 - , author reply 240-1; http://dx.doi.org/10.1002/ijc.21776; PMID: 16432834
- Reynolds P, Hurley S, Goldberg DE, Anton-Culver H, Bernstein L, Deapen D, et al. Active smoking, household passive smoking, and breast cancer: evidence from the California Teachers Study. J Natl Cancer Inst 2004; 96:29 - 37; http://dx.doi.org/10.1093/jnci/djh002; PMID: 14709736
- Brownson RC, Blackwell CW, Pearson DK, Reynolds RD, Richens JW Jr., Papermaster BW. Risk of breast cancer in relation to cigarette smoking. Arch Intern Med 1988; 148:140 - 4; http://dx.doi.org/10.1001/archinte.1988.00380010142014; PMID: 3337590
- Capparelli C, Chiavarina B, Whitaker-Menezes D, Pestell TG, Pestell RG, Hulit J, et al. CDK inhibitors (p16/p19/p21) induce senescence and autophagy in cancer-associated fibroblasts, “fueling” tumor growth via paracrine interactions, without an increase in neo-angiogenesis. Cell Cycle 2012; 11:3599 - 610; http://dx.doi.org/10.4161/cc.21884; PMID: 22935696
- Capparelli C, Guido C, Whitaker-Menezes D, Bonuccelli G, Balliet R, Pestell TG, et al. Autophagy and senescence in cancer-associated fibroblasts metabolically supports tumor growth and metastasis via glycolysis and ketone production. Cell Cycle 2012; 11:2285 - 302; http://dx.doi.org/10.4161/cc.20718; PMID: 22684298
- Nyunoya T, Monick MM, Klingelhutz A, Yarovinsky TO, Cagley JR, Hunninghake GW. Cigarette smoke induces cellular senescence. Am J Respir Cell Mol Biol 2006; 35:681 - 8; http://dx.doi.org/10.1165/rcmb.2006-0169OC; PMID: 16840774
- Yuan J, Adamski R, Chen J. Focus on histone variant H2AX: to be or not to be. FEBS Lett 2010; 584:3717 - 24; http://dx.doi.org/10.1016/j.febslet.2010.05.021; PMID: 20493860
- Cox LS, Lane DP. Tumour suppressors, kinases and clamps: how p53 regulates the cell cycle in response to DNA damage. Bioessays 1995; 17:501 - 8; http://dx.doi.org/10.1002/bies.950170606; PMID: 7575491
- Larsson LG. Oncogene- and tumor suppressor gene-mediated suppression of cellular senescence. Semin Cancer Biol 2011; 21:367 - 76; http://dx.doi.org/10.1016/j.semcancer.2011.10.005; PMID: 22037160
- Maiuri MC, Galluzzi L, Morselli E, Kepp O, Malik SA, Kroemer G. Autophagy regulation by p53. Curr Opin Cell Biol 2010; 22:181 - 5; http://dx.doi.org/10.1016/j.ceb.2009.12.001; PMID: 20044243
- Salem AF, Whitaker-Menezes D, Lin Z, Martinez-Outschoorn UE, Tanowitz HB, Al-Zoubi MS, et al. Two-compartment tumor metabolism: autophagy in the tumor microenvironment and oxidative mitochondrial metabolism (OXPHOS) in cancer cells. Cell Cycle 2012; 11:2545 - 56; http://dx.doi.org/10.4161/cc.20920; PMID: 22722266
- Martinez-Outschoorn UE, Lin Z, Trimmer C, Flomenberg N, Wang C, Pavlides S, et al. Cancer cells metabolically “fertilize” the tumor microenvironment with hydrogen peroxide, driving the Warburg effect: implications for PET imaging of human tumors. Cell Cycle 2011; 10:2504 - 20; http://dx.doi.org/10.4161/cc.10.15.16585; PMID: 21778829
- Martinez-Outschoorn UE, Lin Z, Whitaker-Menezes D, Howell A, Lisanti MP, Sotgia F. Ketone bodies and two-compartment tumor metabolism: stromal ketone production fuels mitochondrial biogenesis in epithelial cancer cells. Cell Cycle 2012; 11:3956 - 63; http://dx.doi.org/10.4161/cc.22136; PMID: 23082721
- Martinez-Outschoorn UE, Lin Z, Whitaker-Menezes D, Howell A, Sotgia F, Lisanti MP. Ketone body utilization drives tumor growth and metastasis. Cell Cycle 2012; 11:3964 - 71; http://dx.doi.org/10.4161/cc.22137; PMID: 23082722
- Martinez-Outschoorn UE, Sotgia F, Lisanti MP. Power surge: supporting cells “fuel” cancer cell mitochondria. Cell Metab 2012; 15:4 - 5; http://dx.doi.org/10.1016/j.cmet.2011.12.011; PMID: 22225869
- Salem AF, Whitaker-Menezes D, Howell A, Sotgia F, Lisanti MP. Mitochondrial biogenesis in epithelial cancer cells promotes breast cancer tumor growth and confers autophagy resistance. Cell Cycle 2012; 11:4174 - 80; http://dx.doi.org/10.4161/cc.22376; PMID: 23070475
- van der Toorn M, Slebos DJ, de Bruin HG, Leuvenink HG, Bakker SJ, Gans RO, et al. Cigarette smoke-induced blockade of the mitochondrial respiratory chain switches lung epithelial cell apoptosis into necrosis. Am J Physiol Lung Cell Mol Physiol 2007; 292:L1211 - 8; http://dx.doi.org/10.1152/ajplung.00291.2006; PMID: 17209140
- Kim MS, Huang Y, Lee J, Zhong X, Jiang WW, Ratovitski EA, et al. Cellular transformation by cigarette smoke extract involves alteration of glycolysis and mitochondrial function in esophageal epithelial cells. Int J Cancer 2010; 127:269 - 81; PMID: 19937795
- Martinez-Outschoorn UE, Balliet R, Lin Z, Whitaker-Menezes D, Birbe RC, Bombonati A, et al. BRCA1 mutations drive oxidative stress and glycolysis in the tumor microenvironment: implications for breast cancer prevention with antioxidant therapies. Cell Cycle 2012; 11:4402 - 13; http://dx.doi.org/10.4161/cc.22776; PMID: 23172369
- Martinez-Outschoorn UE, Balliet RM, Lin Z, Whitaker-Menezes D, Howell A, Sotgia F, et al. Hereditary ovarian cancer and two-compartment tumor metabolism: epithelial loss of BRCA1 induces hydrogen peroxide production, driving oxidative stress and NFκB activation in the tumor stroma. Cell Cycle 2012; 11:4152 - 66; http://dx.doi.org/10.4161/cc.22226; PMID: 23047606
- Salem AF, Howell A, Sartini M, Sotgia F, Lisanti MP. Downregulation of stromal BRCA1 drives breast cancer tumor growth via upregulation of HIF-1α, autophagy and ketone body production. Cell Cycle 2012; 11:4167 - 73; http://dx.doi.org/10.4161/cc.22316; PMID: 23047605
- Sanchez-Alvarez R, Martinez-Outschoorn UE, Lin Z, Lamb R, Hulit J, Howell A, et al. Ethanol exposure induces the cancer-associated fibroblast phenotype and lethal tumor metabolism: Implications for breast cancer prevention. Cell Cycle 2013; 12:289 - 301; http://dx.doi.org/10.4161/cc.23109; PMID: 23257780
- Martinez-Outschoorn UE, Balliet RM, Rivadeneira DB, Chiavarina B, Pavlides S, Wang C, et al. Oxidative stress in cancer associated fibroblasts drives tumor-stroma co-evolution: A new paradigm for understanding tumor metabolism, the field effect and genomic instability in cancer cells. Cell Cycle 2010; 9:3256 - 76; http://dx.doi.org/10.4161/cc.9.16.12553; PMID: 20814239
- Martinez-Outschoorn UE, Goldberg A, Lin Z, Ko YH, Flomenberg N, Wang C, et al. Anti-estrogen resistance in breast cancer is induced by the tumor microenvironment and can be overcome by inhibiting mitochondrial function in epithelial cancer cells. Cancer Biol Ther 2011; 12:924 - 38; http://dx.doi.org/10.4161/cbt.12.10.17780; PMID: 22041887
- Martinez-Outschoorn UE, Pestell RG, Howell A, Tykocinski ML, Nagajyothi F, Machado FS, et al. Energy transfer in “parasitic” cancer metabolism: mitochondria are the powerhouse and Achilles’ heel of tumor cells. Cell Cycle 2011; 10:4208 - 16; http://dx.doi.org/10.4161/cc.10.24.18487; PMID: 22033146
- Sanchez-Alvarez R, Martinez-Outschoorn UE, Lamb R, Hulit J, Howell A, Gandara R, et al. Mitochondrial dysfunction in breast cancer cells prevents tumor growth: Understanding chemoprevention with metformin. Cell Cycle 2013; 12:172 - 82; http://dx.doi.org/10.4161/cc.23058; PMID: 23257779
- Whitaker-Menezes D, Martinez-Outschoorn UE, Flomenberg N, Birbe RC, Witkiewicz AK, Howell A, et al. Hyperactivation of oxidative mitochondrial metabolism in epithelial cancer cells in situ: visualizing the therapeutic effects of metformin in tumor tissue. Cell Cycle 2011; 10:4047 - 64; http://dx.doi.org/10.4161/cc.10.23.18151; PMID: 22134189
- Kim SY, Lee JH, Huh JW, Ro JY, Oh YM, Lee SD, et al. Cigarette smoke induces Akt protein degradation by the ubiquitin-proteasome system. J Biol Chem 2011; 286:31932 - 43; http://dx.doi.org/10.1074/jbc.M111.267633; PMID: 21778238