Abstract
Oncogenes of the RAS family regulate many of the cell’s activities, including proliferation, survival and differentiation. Activating mutations in these genes are common events for many types of cancer. One of the contradictory points concerning the biological significance of Ras activation is its dual effect (pro- or anti-proliferative) on cell reproduction. One of mechanisms by which Ras proteins influence cell growth is a regulation of intracellular level of reactive oxygen species (ROS), second messengers affecting variety of cellular processes including cell proliferation. Recently it was shown that repression of SESN1 and SESN3 genes, whose protein products control regeneration of peroxiredoxins, can play a critical role in Ras-induced ROS upregulation. In the present study we have found that Ras-induced repression of SESN3 expression and ROS upregulation is mediated via the modifications of transcriptional activity of HSF1. Interestingly, mutant Ras overexpression altered the activity of HSF1 in opposite directions in different cell contexts, in particular in human normal fibroblasts and HaCaT immortalized keratinocytes, but these opposite changes caused similar repression of SESN3 expression followed by elevation of ROS content and inhibition of cell proliferation in corresponding cell types. The inhibitory effect on cell proliferation was mediated by upregulation of p21Cip1/WAF1. Thus, HSF1/SESN3/ROS/p21Cip1/WAF1-mediated deceleration of cell growth may contribute to cell defense systems protecting the organism from excessive proliferation of cells that overexpress activated Ras oncoproteins.
Keywords: :
Introduction
The proteins of the Ras family (H-, K- and N-Ras) function as key regulators of signal transduction pathways that control cell proliferation, survival, migration and differentiation.Citation1-Citation3 Activation of various cell surface receptors by different extracellular signals stimulates the conversion of Ras proteins from the inactive GDP-bound to the active GTP-bound form. In the GTP-bound form, Ras activates downstream effectors which, in turn, affect activities of numerous proteins, including large group of transcription factors. The biological effects of activated Ras proteins are mediated through several effectors that include Raf serine/threonine kinases, phosphatidylinositol-3-kinases (PI3Ks) and RalGDS, guanine nucleotide exchange factor (GEF) for small GTPases RalA and RalB.Citation3,Citation4 Mutations at residues 12, 13 or 61 that constitutively activate Ras proteins are found in 95–98% of pancreatic cancers and 25–40% of many other tumor types.Citation1,Citation5,Citation6 Substantial experimental data indicate that aberrant Ras expression plays a critical role in oncogenesis, causing in definite cell contexts stimulation of cell proliferation and angiogenesis, inhibition of apoptosis, an increase in cell motility and genetic instability, i.e., the features that are responsible for tumor growth, invasion and metastasis.Citation3,Citation7,Citation8
Effect of activated Ras on cell proliferation is ambiguous, and depending on its expression level, the cell type and peculiarities of cell microenvironment, Ras can either promote or inhibit cellular proliferation.Citation9,Citation10 In fact, it was found that a moderate, several-fold increase in Ras expression promoted cell growth, but further elevation of Ras expression initially enhanced proliferation but eventually induced p16INK4A expression and senescence. These opposite effects of Ras signaling were probably connected with differential activation of MAPK MEK-ERK and MKK3/6-p38 pathways.Citation11 In addition, Ras can inhibit cell growth by induction of p21CIP1/WAF1 protein.Citation8,Citation12-Citation14 Moreover, in several papers, the differences between fibroblasts and other cell types in response to Ras-induced changes in activity of some downstream Ras effectors affecting cell cycle were reported.Citation15-Citation18
While many studies are devoted to revealing the mechanisms that can explain proliferative or anti-proliferative effects of activated Ras on cell growth, there are still many “white spots” remaining in this field. One of them is the undistinguished role of intracellular ROS (reactive oxygen species), whose level is elevated after introduction of activated Ras.Citation8,Citation19,Citation20 ROS act as second messengers and can influence a variety of cellular processes including cell growth (for a review, see refs. Citation21–Citation25). On the one hand, by interacting with critical signaling molecules (MAP kinases, PI3 kinase, PTEN, protein tyrosine phosphatases, etc.) ROS participate in transduction of mitogenic signals. On the other hand, by causing DNA oxidation ROS can induce DNA damage response and, as consequence, cell cycle arrest and/or apoptosis. The effect of ROS on cell cycle depends on their intracellular concentration and cell context, in particular on the activity of antioxidant programs. It should be outlined that elevation of ROS level causing DNA damage is considered by many investigators to be a crucial mechanism of oncogene-induced cell senescence.Citation26-Citation29
Mechanisms of regulation of ROS content by Ras are under investigation. It was shown that ectopic Ras overexpression increased ROS content,Citation8,Citation19,Citation20 whereas physiological expression levels of Ras could reduce ROS level.Citation30 Notably, the effect of overexpressed Ras can be biphasic when initial ROS upregulation is followed by reduction in their level due to activation of detoxification programs induced by activated p53,Citation8 Nrf2,Citation30 etc. One of well-known mechanisms of Ras-stimulated ROS production is activation of NADPH-oxidases via PI3K/Rac and Raf/Mek/Erk pathways.Citation20,Citation31-Citation33 Importantly, Ras-induced activation of Raf/Mek/Erk1 pathway also inhibits ROS detoxification via repressing the expression of the sestrin genes family, in particular SESN1 and SESN3,Citation8 controlling activity of peroxiredoxins.Citation34 Repression of sestrins plays the crucial role in Ras-induced genetic instability;Citation8 however, its mechanisms and influence on cell proliferation remain unclear.
In the present study we have shown for the first time that modifications of transcriptional activity of HSF1 (heat shock factor 1) can play an important role in Ras-induced repression of SESN3 expression and ROS upregulation. Surprisingly, in different cell types, in particular in human normal fibroblasts and human immortalized keratinocytes, the opposite Ras-induced modifications of HSF1 function have the same effect on SESN3 expression, ROS content and cell growth kinetics. We believe that regulation of novel HSF1/SESN3 signaling pathway can contribute to the mechanisms protecting cells with activated Ras from excessive proliferation.
Results
Ras expression causes temporary increase in intracellular ROS content associated with a decrease in expression of sestrins
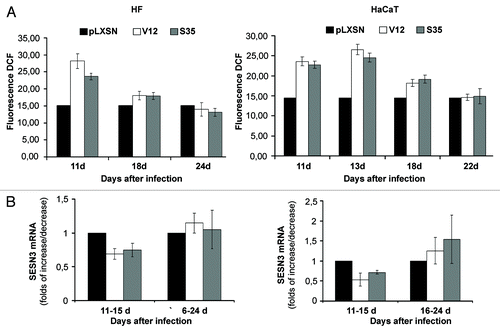
To assess the role of sestrin genes in Ras-induced increase in intracellular ROS level, we introduced activated Ras (H-RasV12) and its double mutants, V12C40, V12G37 and V12S35, which activate PI3K, RalGDS and Raf, respectively, into human HaCaT keratinocytes and normal dermal fibroblasts (HF) (). As expected, introduction of activated Ras caused an increase in ROS level in both cell types (). ROS elevation was associated (correlated) with decreased expression of SESN3 and SESN1 in HaCaT and SESN3 in HF (). Repression of sestrin genes was mainly connected with activation of Ras/Raf pathway in both cell types; activation of Ras/PI3K and Ras/Ral pathways showed less prominent effects on repression of SESN1 and SESN3 expression (). The changes in ROS content and sestrins mRNA levels in both cell types were temporal, and on days 22–24 after Ras introduction, they reverted to the initial levels ().
Figure 1. Effects of transduction of various Ras mutants on Ras content, ROS level as determined by DCF fluorescence and sestrins genes expression in HF and HaCaT cell cultures. (A) Western blot analysis of Ras content; actin protein was analyzed as loading control. (B) Upper panel: average indices of total DCF fluorescence of 104 cells (in each case summarized data of three independent experiments are shown). HF (left) and HaCaT (right) cell sublines and cell cultures were analyzed 11–15 d after introduction of corresponding retroviral pLXSN-neo vectors. At the bottom, RT-PCR of SESN1, SESN2 and SESN3 mRNAs in HaCaT and HF expressing various Ras mutants for 11–15 d; tubulin mRNA was analyzed as loading control.
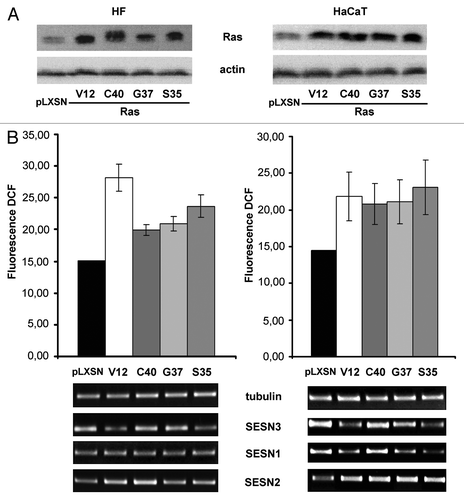
Figure 2. Reversion of Ras-induced changes in intracellular ROS content and sestrins genes expression in HF (left) and HaCaT (right) cell cultures. (A) Changes of ROS level on days 11–24 d after introduction of corresponding retroviral pLXSN-neo vectors. The average data of two independent experiments in each case are presented. (B) Changes in SESN3 mRNA level on days 11–24 after introduction of corresponding retroviral pLXSN-neo vectors (11–15 d/16–24 d mean that the average data shown on the figure were estimated by measuring SESN3 mRNA level during the indicated period of time). Relative quantities of SESN3 mRNA as estimated by densitometry of the results of RT-PCR experiments. The relative intensity of SESN3 bands was estimated as a ratio of SESN3 PCR-products to tubulin bands. The average results of two–three experiments are presented, means ± SE are given.
Ras expression causes activation of transcriptional activity of HSF1 in HaCaT and its repression in HF
To reveal the mechanisms underlying Ras-induced SESN3 and SESN1 repression and to identify transcription factors mediating this effect, we first performed the search of putative binding sites within sestrin genes sequences using the TRANSFAC database (www.gene-regulation.com/pub/databases.html). Putative HSF1-responsive elements were found in the promoters of both sestrin genes. To test the possibility that Ras-induced repression of sestrins is HSF1-dependent, we created a lentiviral reporter construction expressing luciferase gene under control of HSE (see “Materials and Methods”) and introduced it, together with Ras mutants, into HF and HaCaT cells. An increase of the reporter gene expression was found in all HaCaT cell cultures, while HFs showed a decrease in luciferase activity ().
Figure 3. Effects of transduction of Ras mutants on HSF1 reporter activity (A) and HSF1 protein localization (B and C) in HF and HaCaT cell cultures. (A) The reporter lentiviral construct expressing luciferase gene under control of heat shock elements (HSE) was introduced into HF and HaCaT cells. Luciferase activity was measured 11–14 d after introduction of Ras mutants. (B) Nuclear, cytoplasmic fractions and total protein lysates were collected 11–14 d after Ras mutants introduction and were subjected to western blot analysis using anti-HSF1, anti-histone 3 (a nuclear marker), anti-actin (a cytoplasmic marker) antibodies. Actin protein was used as loading control for total protein lysates. (C) HSF1 immunofluorescence staining of HaCaT and HF cell cultures expressing RasV12 mutant or empty vector.
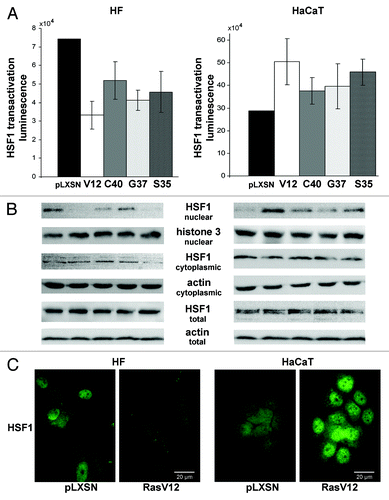
To prove the role of changes of HSF1 function in these effects we monitored its cytoplasmic and nuclear fractions, since it is known that HSF1 is translocated into the nucleus upon activation.Citation35 It was found that activated Ras caused HSF1 translocation to the nucleus in all HaCaT cell cultures (contribution of Ras double mutants was the same as in the luciferase activity) (, right). On the contrary, in the case with HFs, a decrease in HSF1 amount in the nucleus was observed in all Ras-expressing cultures (, left). Similar results were obtained using immunofluorescence analysis of HSF1 (). These data suggest that activated Ras regulates HSF1 function in opposite directions in human keratinocytes and fibroblasts.
Cell type-dependent effects of HSF1 modifications on sestrins genes expression
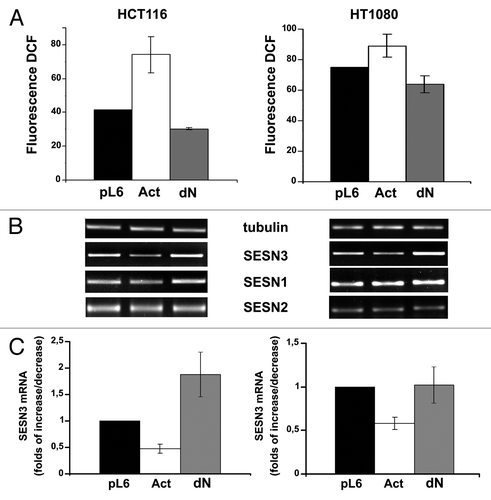
To assess possible influence of Ras-induced changes in HSF1 activity on expression of sestrin genes we created lentiviral constructs expressing constitutively active (Act) and dominant-negative (dN) forms of HSF1. In addition, the shHSF1 lentiviral construct expressing shRNA specific for HSF1 was developed. The functionality of all these constructs was confirmed by luciferase gene reporter assay (). Notably, they caused opposite biological effects in HF and HaCaT cells. In fact, in HF cultures, Act-HSF1 caused an increase in SESN3 expression and a decrease in ROS level, whereas in HaCaT cells, activated HSF1 caused a decrease in SESN3 mRNA level and a slight increase in ROS content (). The effects of dN-HSF1 in these cell types were less prominent, but they had a tendency opposite to those effects caused by Act-HSF1. However, introduction of shHSF1, which showed higher efficiency of inhibition of HSF1 function as compared with dN-HSF1 (), led to statistically significant diminishing of SESN3 expression and about 2-fold increase in ROS content (). It should be outlined that the effects of HSF1 modifications in HF cell culture () were reproduced in dermal fibroblasts obtained from other individuals (not shown). Two human tumor cell lines, HCT116 colon carcinoma and HT1080 fibrosarcoma, showed in response to modifications of HSF1 function the similar changes in SESN3 expression and ROS level to those observed in HaCaT immortalized keratinocytes (). Notably, SESN1 and SESN2, unlike SESN3, showed in all cell types no noticeable alterations of mRNAs level in response to introduction of various HSF1 constructs ( and ).
Figure 4. Effects of constitutively active (Act) and dominant-negative (dN) HSF1 mutants and shHSF1 on HSF1 reporter activity (A), ROS content (B) and sestrins mRNAs levels (C and D) in HF and HaCaT cells. In each case luciferase activity and DCF fluorescence were measured in three–five experiments; average data are presented. (C) RT-PCR of SESN1, SESN2 and SESN3 mRNAs; tubulin mRNA was analyzed as loading control. (D) The relative intensity of SESN3 bands was estimated as a ratio of SESN3 PCR-products to tubulin bands by densitometry of the results of four experiments, means ± SE are given.
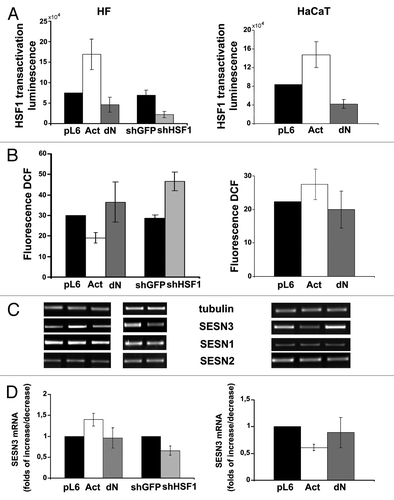
Figure 5. Effects of constitutively active (Act) and dominant-negative (dN) HSF1 mutants and shHSF1 on ROS content (A) and sestrins mRNAs levels (B and C) in HCT116 and HT1080 cells. In each case DCF fluorescence were measured in three-five experiments; average data are presented. (B) RT-PCR of SESN1, SESN2 and SESN3 mRNAs; tubulin mRNA was analyzed as loading control. (C) The relative intensity of SESN3 bands estimated according the results of four experiments, means ± SE are given.
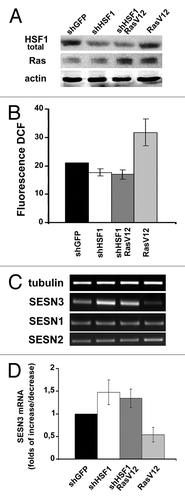
To prove the role of alterations of HSF1 function in mediation of changes in SESN3 expression and ROS level by activated Ras, we studied the effects caused by mutant RasV12 in HaCaT cells in which HSF1 expression was downregulated by RNA interference (). It was found that expression of shHSF1 abrogated the ability of Ras to repress SESN3 expression and increase ROS content ().
Figure 6. Ras introduction in HaCaT expressing shHSF1 doesn’t influence either ROS level or sestrins expression. (A) Cells expressing shHSF1 (or shGFP), RasV12 and shHSF1 together with RasV12 were subjected to western blot analysis using anti-HSF1, anti-panRas and anti-actin (as loading control) antibodies. (B) Average indices of total DCF fluorescence of 104 cells (in each case summarized data of three independent experiments are shown). (C) RT-PCR of SESN1, SESN2 and SESN3 mRNAs; tubulin mRNA was analyzed as loading control. (D) The relative intensity of SESN3 bands estimated according the results of four experiments, means ± SE are given.
Changes in HSF1 activity influence cell growth kinetics viaSESN3 regulation
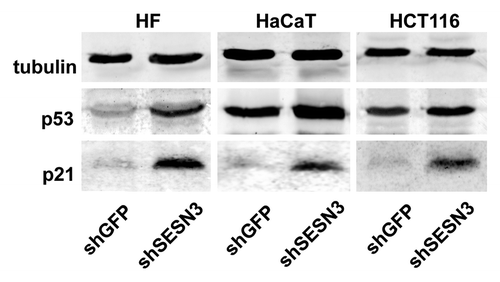
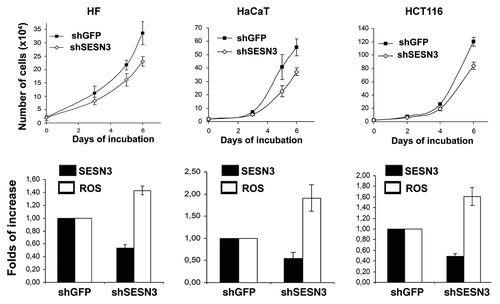
We studied the effects of changes in activity of HSF1/SESN3 on proliferation of HF, HaCaT and HCT116 cell cultures. It was found that modifications of HSF1 function leading to repression of SESN3 expression and ROS upregulation caused an inhibition of cell growth in all studied cell types (), while HSF1 modifications inducing an increase in SESN3 expression and ROS downregulation were accompanied by slight acceleration of cell growth (). In accordance with this result, an inhibition of SESN3 expression by introduction of the shSESN3 construct led to ROS upregulation and deceleration of proliferation of all studied cell types ().
Figure 7. Effects of different modifications of HSF1 function affecting SESN3 gene expression and ROS level on growth of HF, HaCaT and HCT116 cell cultures. (A) Effect of introduction of HSF1 constructs diminishing SESN3 expression and increasing ROS content. (B) Effect of introduction of HSF1 constructs increasing SESN3 expression and decreasing ROS level. In all cases, 2 x 10⁴ cells were seeded into 6-well plates, and cell counts were performed until cell cultures reach monolayer using the hemocytometer (two wells per point). Typical result of one of three experiments is given; means ± SE are shown. At the bottoms average indices of total DCF fluorescence of 104 cells (in each case summarized data of three independent experiments are shown) (white) and of semi-quantitative RT-PCR of SESN3 mRNA (black).
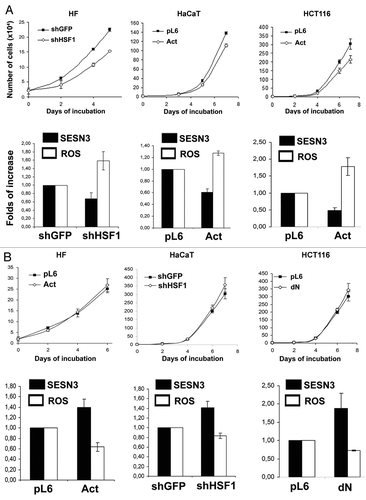
Figure 8. Effect of SESN3 downregulation caused by RNA interference on ROS level and growth of HF, HaCaT and HCT116 cell cultures. In all cases, 2 x 10⁴ cells were seeded into 6-well plates, and cell counts were performed until cell cultures reach monolayer using the hemocytometer (two wells per point). Typical result of one of three experiments is given; means ± SE are shown. At the bottom, average indices of total DCF fluorescence of 104 cells (in each case summarized data of three independent experiments are shown) (white) and of semi-quantitative RT-PCR of SESN3 mRNA (black).
SESN3 repression induces upregulation of the cyclin-dependent kinases inhibitor p21Cip1/WAF1
Western analysis of cell cultures in which SESN3 expression was inhibited by RNA interference has shown that deceleration of cell proliferation can be connected with activation of p53 and p21Cip1/WAF1. Noteworthy, the level of increase in p53 content was different in various cell lines: significant in HF, moderate in HaCaT and slight in HCT116 cells (). At the same time, the level of p21Cip1/WAF1 upregulation was very significant in all these cell lines ().
Discussion
It is well-established that overexpression of activated Ras proteins can increase intracellular ROS content by several mechanisms affecting their generationCitation8,Citation36-Citation38 and detoxification.Citation30,Citation39 According to our previous data,Citation8 repression of sestrin genes in Ras-expressing cells, in particular SESN1 and SESN3, which control regeneration of peroxiredoxins, represents an important determinant of Ras-induced ROS upregulation. However, the mechanisms underlying regulation of SESN1 and SESN3 genes by Ras remained unclear.
Based on the results of TRANSFAC database search, which showed the presence of HSF1-responsive elements (HSE) in sestrin genes promoters, we proposed a participation of HSF1 in mediating the Ras effect. In agreement with this idea, we found that introduction of constitutively active Ras proteins caused changes in transcriptional activity of HSF1 accompanied by a temporal increase in ROS level and a decrease in SESN3 expression. Surprisingly, the alterations of HSF1 function were opposite in studied Ras-expressing cell types: in HaCaT keratinocytes we observed the increase of HSF1 activity as was detected by reporter gene assay and by monitoring of HSF1 translocation into the nuclei, while in dermal fibroblasts the decrease of HSF1 activity was found.
To test whether opposite changes in HSF1 activity can lead to similar alterations of SESN3 expression and ROS content in corresponding cell types, we created lentiviral constructs whose introduction either increase or decrease HSF1 function and studied their effects in both cell types. In concordance with the role of Ras-induced changes of HSF1 activity in mediation of Ras effect on SESN3 expression and ROS content, we found that in HFs showing a decrease in HSF1 activity in response to activated Ras overexpression an inhibition of HSF1 function by RNA interference (shHSF1) led to SESN3 repression and ROS upregulation. On the other hand, in HaCaT cells, in which Ras upregulated HSF1, the same changes of SESN3 mRNA level and ROS content were caused by expression of constitutively active HSF1-Act mutant. The critical role of HSF1 activation in mediating the effect of Ras on SESN3/ROS pathway in HaCaT cells was proved by inhibition of HSF1 function using shHSF1. In fact, it was found that Ras was unable to repress SESN3 expression and upregulate ROS level in HaCaT cells with inhibited HSF1 function.
These results show for the first time that expression of sestrin genes, in addition to described earlier its regulation by p53 (activation of SESN1, SESN2)Citation34 and FoxOs proteins (induction of SESN3),Citation40 is controlled by one more stress-induced transcription factor, HSF1. One could propose that both HSF1 and FoxOs participate in mediation of Ras-induced repression of SESN3 expression, since earlier negative regulation of FoxOs proteins by activated Ras via Ras/PI3K/Act and Ras/Raf/Erk pathways was described.Citation41 However, the result of our experiment showing abrogation of the Ras effect in cells with inactivated HSF1 indicates the pivotal role of Ras/HSF1 pathway in repression of SESN3 expression, at least in HaCaT cells.
Molecular basis underlying the opposite regulation of HSF1 by Ras and SESN3/ROS pathway by HSF1 in different cell types remains completely unclear. One could propose that they someway are connected with different histogenetic origins of studied cells (mesenchymal HFs and epithelial HaCaT). However, the results obtained with mesenchymal HT1080 fibrosarcoma cells, which showed similar SESN3/ROS pathway regulation by HSF1, to that observed in epithelial immortalized HaCaT keratinocytes and HCT116 colon carcinoma cells contradict this idea. It cannot be excluded that the observed differences reflect some peculiarities of molecular landscape resulting from cell neoplastic transformation or immortalization. Identification of the molecular mechanisms that can turn and put upside down the regulation of HSF1 by Ras and SESN3 by HSF1 as well as revert the SESN3 downregulation is a task for future research.
To assess possible biological significance of alterations in activity of identified Ras/HSF1/SESN3/ROS pathway, we studied the influence of HSF1 modifications and SESN3 repression on cell growth kinetics. It was found that alterations of HSF1 function repressing SESN3 expression as well as SESN3 inhibition by shSESN3 caused prominent deceleration of proliferation of all studied cell types. Effects of HSF1 modifications upregulating SESN3 expression and decreasing ROS content showed very weak opposite effect. These results indicate that the described effect of HSF1/SESN3 pathway on cell proliferation is probably connected with the regulation of intracellular ROS content rather than with other functions, independent of redox control SESN3, such as an ability of stress-induced or ectopically expressed sestrins, including SESN3, to reduce protein synthesis, cell growth and/or to induce autophagy via activation of adenosine-50-monophosphate (AMP)-dependent protein kinase and inhibition of the target of rapamycin complex 1 (TORC1) (for a review, see ref. Citation42). In fact, redox-independent SESN3 anti-proliferative functions were observed upon activation of SESN3 expression, while we observed redox-dependent inhibition of cell growth kinetics in cells with downregulated SESN3.
At least in part, the inhibition of cell proliferation induced by repression of SESN3 expression can be connected with p53-mediated upregulation of p21Cip1/WAF1, which functions as an inhibitor of Cdk2 activity. However, taking into account the discrepancy between slight increase in p53 content and significant p21Cip1/WAF1 induction in some cell contexts (it was especially prominent in HCT116 cells), we cannot exclude additional participation of some p53-independent mechanisms of p21Cip1/WAF1 upregulation, especially in immortalized and tumor cells. The detailed molecular mechanisms underlying this effect remain to be established.
Collectively, our results show for the first time that newly discovered Ras/HSF1/SESN3/ROS/ p21Cip1/WAF1 pathways can participate in regulation of proliferation of cells expressing activated RAS oncogene. Probably it can be a part of cell defense systems preventing excessive reproduction of abnormal cells.
Materials and Methods
DNA constructs
The following previously developed and described constructs were used: the retroviral vectors pLXSN-neo containing human activated H-Ras V12, and its restricted effector specificity mutants V12S35, V12G37 and V12C40Citation43 (provided by J. Downward, Cancer Research UK). Complementary 60-bp hairpin oligonucleotides containing 19 nucleotide regions corresponding to the human SESN3 gene (5′-GACGAGGAGAAGAGCATTT-3′ and 5′-CCAGAGAGAGATCCAGAAA-3′), which were designed according to siRNA-scale algorithm (http://gesteland.genetics.utah.edu/siRNA_scales/index.html) were cloned into pLSLP vector for shRNA, as described earlier.Citation44 Constitutively active (deletion of amino acids 203–315 in hHSF1) and dominant-negative (deletion of amino acids 455–523) forms of human HSF1 cloned in the pcDNA 3.1(+) plasmid (Invitrogen) were kindly provided to us by Dr Richard VoellmyCitation45 (Department of Biochemistry and Molecular Biology, University of Miami, Miller School of Medicine). Two vectors containing these sequences in the modified pLenti6 vector (Invitrogen) were created by inserting the HSF1 sequences into NheI/EcoRI restriction sites of pLenti6. For expression of shRNA specific for HSF1 lentiviral vector pLKO was used (Sigma). The hairpin structure containing the 21 nucleotide regions (5′-AAGTACTTCAAGCACAACAAC-3′) corresponding to the human HSF1 mRNA at 353–373 position, which was validated as shRNA,Citation46 was AgeI/EcoRI cloned into pLKO vector. For construction the vector containing HSF1-responsive elements (HSEs) the following oligonucleotides were synthesized (Evrogen):
Sense strand: 5′-CTAGCAGACCCGAAACTGCTGGAAGATTCCCGAAACTTCTGGT-3′.
Antisense strand: 5′-CTAGACCAGAAGTTTAGGGAATCTTCCAGCAGTTTCGGGTCTG-3′. Double-stranded oligonucleotides were self-ligated, and a fragment that consisted of four NheI/XbaI-directed repeats (4 × HSEs) was cloned into pLentiA-mCMV-Luc-puro reporter with XbaI restriction site. pLentiA vector were obtained from Dr Peter Chumakov (Engelhardt Institute of Molecular Biology). Accuracy of cloned fragment and its orientation was verified by restriction analysis and DNA sequencing (Evrogen).
Cell cultures
Human immortalized keratinocytes (HaCaT) (CLS #300493), human colon carcinoma HCT116 (ATCС #CCL-247), fibrocarcoma HT1080 (ATCC #CCL-121) cell lines and human normal fibroblasts (HF) isolated from skin were used. The cell cultures with constitutive expression of various H-Ras mutants were created as previously described.Citation47,Citation48 Briefly, the retroviral DNA constructs were transfected into Phoenix-ampho packaging cells using Lipofectamine 2000 Transfection Reagent (Invitrogen). Virus-containing supernatants collected 24–48 h after transfection were used to infect recipient cells in the presence of polybrene (8 µg/ml). Infected cell cultures were selected in the medium containing geneticin (Invitrogen, 0.6 mg/ml for 6–7 d).
High-titer stocks of recombinant lentiviruses pseudotyped with VSV-G protein were produced by co-transfection into 293T cells of the pLenti6, pLentiA, pLKO or pLSLP constructs together with the pCMVdelta8.2R and pVSV-G packaging plasmids. Virus-containing supernatants were collected 24–48 h after transfection and used for infection of recipient cells. Infected cell cultures were selected for 5–6 d in medium containing 1 µg/mL puromycin (P8833, Sigma) for pLentiA, pLSLP and pLKO constructs and 5 µg/mL blasticidin (R210-01, Invitrogen) for pLenti6 constructs.
All the cells were cultured in DMEM medium supplemented with 10% FBS and penicillin/streptomycin.
Measurement of intracellular ROS was performed as described earlier.Citation49 Briefly, the cells were incubated with 2’–7’ dichlorodihydrofluorescein diacetate (DCF-DA, Molecular Probes) at 5 µM for 30 min, washed with PBS, trypsinized, collected in 1 ml of PBS, transferred to polystyrene tubes with cell-strainer caps (Falcon) and subjected to FACS (Beckton Dickinson FACScan) using Cell Quest 3.2 (Beckton Dickinson) software for acquisition and analysis.
Detection of mRNA by RT-PCR
Total mRNA was isolated using TRI Reagent (T9424, Sigma). RT-PCR was performed as described earlier.Citation44 To monitor the expression of corresponding genes we used the following primers:
SESN1: for: 5′-TGCATGTTCCAACATTTCGT-3′, rev: 5′-CTGGGGCTTAGTACCTTCCC-3′.
SESN2: for: 5′-CCCTAGTGAACAGAGCAGC-3′, rev: 5′-GTCTTCCACAAAGCACAGCA-3′.
SESN3: for: 5′-GTTCACTGTATGTTTGGAATCAGG-3′, rev: 5′-GGGTGATACTTCAGGTCAAATG-3′.
To detect α-tubulin mRNA we used forward 5′- GTTGGTCTGGAATTCTGTCAG -3′ and reverse 5′- AAGAAGTCCAAGCTGGAGTTC -3′ primers.
The quantitation of mRNA bands was performed using Chemi-Smart 3000 Imaging System (Vilber Lourmat) and TotalLab v.2.01 software.
Luciferase reporter assay was performed using Steady-Glo Luciferase Assay System (E2510, Promega) according to the manufacturer’s protocols; the values were normalized in relation to protein concentration.
Cell growth assay
Cells were plated in triplicate to a 6-well plate (2 × 10⁴ cells per well). Every 2 days cells were collected by trypsinization and counted using a hemacytometer.
Western blot analysis
Whole-cell extracts were lysed in ice-cold RIPA buffer (50 mM TRIS-HCl pH 7.4, 150 mM NaCl, 1% deoxycholate Na, 1% NP-40, 0.1% SDS, 100 mM PMSF, 1 mM pepstatin A and 1 mM E64). To perform nuclear and cytoplasmic fractionation, cells were lysed in ice-cold hypotonic buffer (10 mM HEPES, 1.5 mM MgCl2, 10 mM KCl, 0.5 DTT, 0.05% NP40, 100 mM PMSF, 1 mM pepstatin A and 1 mM E64, pH 7.9). After 15 min incubation in ice, cells were centrifuged at 3,000 rpm for 10 min to produce a suspension (cytoplasmic fraction) and pellet (nuclear fraction). The pellet was then resuspended in ice-cold RIPA buffer. After 30 min incubation in ice, the sample was centrifuged at 13,000 rpm for 20 min. The supernatant was used as nuclear fraction. Protein concentration in the extracts was determined with a protein assay system (BioRad). Twenty µg of protein was separated on a 12% SDS polyacrylamide gel and transferred to PVDF membrane (RPN303F, Amersham GE Healthcare). The membranes were probed with antibodies specific to histone H3 (#9715, Cell Signaling), HSF1 (#2923, Abcam), Ras (#OP40, Calbiochem), p53 (DO-1, Santa Cruz), p21Cip1/WAF1 (M7202, DAKO), actin (#4968, Cell Signaling) and β-tubulin (556321, BD PharMingen). Membranes were treated with secondary anti-mouse/rabbit-HPR (NA931, NA934 Amersham GE Healthcare). Filters were developed with ECL Plus chemiluminescence reagents (RPN2132, Amersham GE Healthcare) according to the manufacturer’s protocol.
Immunofluorescent microscopy
Cells were plated on SlideFlask (NUNCLON) and fixed with formaldehyde/methanol on the 10–12 d after RasV12 infection, incubated with anti-HSF1 primary antibodies for 1 h at room temperature and detected with Alexa488-conjugated secondary antibody (A11029, Invitrogen) for 30 min at room temperature. The SlideFlask were mounted with coverslips and images were acquired using fluorescent Axioplan 2 microscope and AxioVision (Carl Zeiss MicroImaging GmbH) software.
Acknowledgments
The work was performed using financial support from Russian Academy of Medical Sciences
Disclosure of Potential Conflicts of Interest
No potential conflicts of interest were disclosed
References
- Barbacid M. ras genes. Annu Rev Biochem 1987; 56:779 - 827; http://dx.doi.org/10.1146/annurev.bi.56.070187.004023; PMID: 3304147
- Ulkü AS, Der CJ. Ras signaling, deregulation of gene expression and oncogenesis. Cancer Treat Res 2003; 115:189 - 208; http://dx.doi.org/10.1007/0-306-48158-8_8; PMID: 12613198
- Malumbres M, Barbacid M. RAS oncogenes: the first 30 years. Nat Rev Cancer 2003; 3:459 - 65; http://dx.doi.org/10.1038/nrc1097; PMID: 12778136
- Downward J. Targeting RAS signalling pathways in cancer therapy. Nat Rev Cancer 2003; 3:11 - 22; http://dx.doi.org/10.1038/nrc969; PMID: 12509763
- Bos JL. ras oncogenes in human cancer: a review. Cancer Res 1989; 49:4682 - 9; PMID: 2547513
- Rodenhuis S. ras and human tumors. Semin Cancer Biol 1992; 3:241 - 7; PMID: 1421168
- Campbell PM, Der CJ. Oncogenic Ras and its role in tumor cell invasion and metastasis. Semin Cancer Biol 2004; 14:105 - 14; http://dx.doi.org/10.1016/j.semcancer.2003.09.015; PMID: 15018894
- Kopnin PB, Agapova LS, Kopnin BP, Chumakov PM. Repression of sestrin family genes contributes to oncogenic Ras-induced reactive oxygen species up-regulation and genetic instability. Cancer Res 2007; 67:4671 - 8; http://dx.doi.org/10.1158/0008-5472.CAN-06-2466; PMID: 17510393
- Serrano M, Lin AW, McCurrach ME, Beach D, Lowe SW. Oncogenic ras provokes premature cell senescence associated with accumulation of p53 and p16INK4a. Cell 1997; 88:593 - 602; http://dx.doi.org/10.1016/S0092-8674(00)81902-9; PMID: 9054499
- Serrano M, Blasco MA. Putting the stress on senescence. Curr Opin Cell Biol 2001; 13:748 - 53; http://dx.doi.org/10.1016/S0955-0674(00)00278-7; PMID: 11698192
- Deng Q, Liao R, Wu BL, Sun P. High intensity ras signaling induces premature senescence by activating p38 pathway in primary human fibroblasts. J Biol Chem 2004; 279:1050 - 9; http://dx.doi.org/10.1074/jbc.M308644200; PMID: 14593117
- Delgado MD, Vaqué JP, Arozarena I, López-Ilasaca MA, Martínez C, Crespo P, et al. H-, K- and N-Ras inhibit myeloid leukemia cell proliferation by a p21WAF1-dependent mechanism. Oncogene 2000; 19:783 - 90; http://dx.doi.org/10.1038/sj.onc.1203384; PMID: 10698496
- Kopnin PB, Ivanov AV, Il’inskaia GV, Sablina AA, Kopnin BP, Chumakov PM. [The protective role of p53 in Ras-induced transformation of REF52 cells]. Mol Biol (Mosk) 2003; 37:458 - 71; http://dx.doi.org/10.1023/A:1024235310268; PMID: 12815953
- Takeuchi S, Takahashi A, Motoi N, Yoshimoto S, Tajima T, Yamakoshi K, et al. Intrinsic cooperation between p16INK4a and p21Waf1/Cip1 in the onset of cellular senescence and tumor suppression in vivo. Cancer Res 2010; 70:9381 - 90; http://dx.doi.org/10.1158/0008-5472.CAN-10-0801; PMID: 21062974
- Atwood AA, Sealy L. Regulation of C/EBPbeta1 by Ras in mammary epithelial cells and the role of C/EBPbeta1 in oncogene-induced senescence. Oncogene 2010; 29:6004 - 15; http://dx.doi.org/10.1038/onc.2010.336; PMID: 20818427
- Bansal R, Nikiforov MA. Pathways of oncogene-induced senescence in human melanocytic cells. Cell Cycle 2010; 9:2782 - 8; http://dx.doi.org/10.4161/cc.9.14.12251; PMID: 20676024
- Bazarov AV, Lee WJ, Bazarov I, Bosire M, Hines WC, Stankovich B, et al. The specific role of pRb in p16 (INK4A) -mediated arrest of normal and malignant human breast cells. Cell Cycle 2012; 11:1008 - 13; http://dx.doi.org/10.4161/cc.11.5.19492; PMID: 22333593
- Lin S, Yang J, Elkahloun AG, Bandyopadhyay A, Wang L, Cornell JE, et al. Attenuation of TGF-β signaling suppresses premature senescence in a p21-dependent manner and promotes oncogenic Ras-mediated metastatic transformation in human mammary epithelial cells. Mol Biol Cell 2012; 23:1569 - 81; http://dx.doi.org/10.1091/mbc.E11-10-0849; PMID: 22357622
- Irani K, Xia Y, Zweier JL, Sollott SJ, Der CJ, Fearon ER, et al. Mitogenic signaling mediated by oxidants in Ras-transformed fibroblasts. Science 1997; 275:1649 - 52; http://dx.doi.org/10.1126/science.275.5306.1649; PMID: 9054359
- Archer H, Bar-Sagi D. Ras and Rac as activators of reactive oxygen species (ROS). Methods Mol Biol 2002; 189:67 - 73; PMID: 12094595
- Martindale JL, Holbrook NJ. Cellular response to oxidative stress: signaling for suicide and survival. J Cell Physiol 2002; 192:1 - 15; http://dx.doi.org/10.1002/jcp.10119; PMID: 12115731
- Finkel T. Oxidant signals and oxidative stress. Curr Opin Cell Biol 2003; 15:247 - 54; http://dx.doi.org/10.1016/S0955-0674(03)00002-4; PMID: 12648682
- Sarsour EH, Kumar MG, Chaudhuri L, Kalen AL, Goswami PC. Redox control of the cell cycle in health and disease. Antioxid Redox Signal 2009; 11:2985 - 3011; http://dx.doi.org/10.1089/ars.2009.2513; PMID: 19505186
- Cataldi A. Cell responses to oxidative stressors. Curr Pharm Des 2010; 16:1387 - 95; http://dx.doi.org/10.2174/138161210791033969; PMID: 20166986
- Ray PD, Huang BW, Tsuji Y. Reactive oxygen species (ROS) homeostasis and redox regulation in cellular signaling. Cell Signal 2012; 24:981 - 90; http://dx.doi.org/10.1016/j.cellsig.2012.01.008; PMID: 22286106
- Lee AC, Fenster BE, Ito H, Takeda K, Bae NS, Hirai T, et al. Ras proteins induce senescence by altering the intracellular levels of reactive oxygen species. J Biol Chem 1999; 274:7936 - 40; http://dx.doi.org/10.1074/jbc.274.12.7936; PMID: 10075689
- Mallette FA, Gaumont-Leclerc MF, Ferbeyre G. The DNA damage signaling pathway is a critical mediator of oncogene-induced senescence. Genes Dev 2007; 21:43 - 8; http://dx.doi.org/10.1101/gad.1487307; PMID: 17210786
- Rai P, Young JJ, Burton DG, Giribaldi MG, Onder TT, Weinberg RA. Enhanced elimination of oxidized guanine nucleotides inhibits oncogenic RAS-induced DNA damage and premature senescence. Oncogene 2011; 30:1489 - 96; http://dx.doi.org/10.1038/onc.2010.520; PMID: 21076467
- Weyemi U, Lagente-Chevallier O, Boufraqech M, Prenois F, Courtin F, Caillou B, et al. ROS-generating NADPH oxidase NOX4 is a critical mediator in oncogenic H-Ras-induced DNA damage and subsequent senescence. Oncogene 2012; 31:1117 - 29; http://dx.doi.org/10.1038/onc.2011.327; PMID: 21841825
- DeNicola GM, Karreth FA, Humpton TJ, Gopinathan A, Wei C, Frese K, et al. Oncogene-induced Nrf2 transcription promotes ROS detoxification and tumorigenesis. Nature 2011; 475:106 - 9; http://dx.doi.org/10.1038/nature10189; PMID: 21734707
- Cho HJ, Jeong HG, Lee JS, Woo ER, Hyun JW, Chung MH, et al. Oncogenic H-Ras enhances DNA repair through the Ras/phosphatidylinositol 3-kinase/Rac1 pathway in NIH3T3 cells. Evidence for association with reactive oxygen species. J Biol Chem 2002; 277:19358 - 66; http://dx.doi.org/10.1074/jbc.M200933200; PMID: 11884408
- Mitsushita J, Lambeth JD, Kamata T. The superoxide-generating oxidase Nox1 is functionally required for Ras oncogene transformation. Cancer Res 2004; 64:3580 - 5; http://dx.doi.org/10.1158/0008-5472.CAN-03-3909; PMID: 15150115
- Adachi Y, Shibai Y, Mitsushita J, Shang WH, Hirose K, Kamata T. Oncogenic Ras upregulates NADPH oxidase 1 gene expression through MEK-ERK-dependent phosphorylation of GATA-6. Oncogene 2008; 27:4921 - 32; http://dx.doi.org/10.1038/onc.2008.133; PMID: 18454176
- Budanov AV, Sablina AA, Feinstein E, Koonin EV, Chumakov PM. Regeneration of peroxiredoxins by p53-regulated sestrins, homologs of bacterial AhpD. Science 2004; 304:596 - 600; http://dx.doi.org/10.1126/science.1095569; PMID: 15105503
- Pirkkala L, Nykänen P, Sistonen L. Roles of the heat shock transcription factors in regulation of the heat shock response and beyond. FASEB J 2001; 15:1118 - 31; http://dx.doi.org/10.1096/fj00-0294rev; PMID: 11344080
- Serù R, Mondola P, Damiano S, Svegliati S, Agnese S, Avvedimento EV, et al. HaRas activates the NADPH oxidase complex in human neuroblastoma cells via extracellular signal-regulated kinase 1/2 pathway. J Neurochem 2004; 91:613 - 22; http://dx.doi.org/10.1111/j.1471-4159.2004.02754.x; PMID: 15485492
- Choi JA, Kim EY, Song H, Kim C, Kim JH. Reactive oxygen species are generated through a BLT2-linked cascade in Ras-transformed cells. Free Radic Biol Med 2008; 44:624 - 34; http://dx.doi.org/10.1016/j.freeradbiomed.2007.10.041; PMID: 18082638
- Ferro E, Goitre L, Retta SF, Trabalzini L. The Interplay between ROS and Ras GTPases: Physiological and Pathological Implications. J Signal Transduct 2012; 2012:365769; http://dx.doi.org/10.1155/2012/365769; PMID: 22175014
- Recktenwald CV, Kellner R, Lichtenfels R, Seliger B. Altered detoxification status and increased resistance to oxidative stress by K-ras transformation. Cancer Res 2008; 68:10086 - 93; http://dx.doi.org/10.1158/0008-5472.CAN-08-0360; PMID: 19074874
- Chen CC, Jeon SM, Bhaskar PT, Nogueira V, Sundararajan D, Tonic I, et al. FoxOs inhibit mTORC1 and activate Akt by inducing the expression of Sestrin3 and Rictor. Dev Cell 2010; 18:592 - 604; http://dx.doi.org/10.1016/j.devcel.2010.03.008; PMID: 20412774
- Yang JY, Hung MC. A new fork for clinical application: targeting forkhead transcription factors in cancer. Clin Cancer Res 2009; 15:752 - 7; http://dx.doi.org/10.1158/1078-0432.CCR-08-0124; PMID: 19188143
- Budanov AV, Lee JH, Karin M. Stressin’ Sestrins take an aging fight. EMBO Mol Med 2010; 2:388 - 400; http://dx.doi.org/10.1002/emmm.201000097; PMID: 20878915
- Rodriguez-Viciana P, Warne PH, Khwaja A, Marte BM, Pappin D, Das P, et al. Role of phosphoinositide 3-OH kinase in cell transformation and control of the actin cytoskeleton by Ras. Cell 1997; 89:457 - 67; http://dx.doi.org/10.1016/S0092-8674(00)80226-3; PMID: 9150145
- Sablina AA, Budanov AV, Ilyinskaya GV, Agapova LS, Kravchenko JE, Chumakov PM. The antioxidant function of the p53 tumor suppressor. Nat Med 2005; 11:1306 - 13; http://dx.doi.org/10.1038/nm1320; PMID: 16286925
- Xia W, Vilaboa N, Martin JL, Mestril R, Guo Y, Voellmy R. Modulation of tolerance by mutant heat shock transcription factors. Cell Stress Chaperones 1999; 4:8 - 18; http://dx.doi.org/10.1379/1466-1268(1999)004<0008:MOTBMH>2.3.CO;2; PMID: 10467104
- Butcher NJ, Minchin RF. Arylamine N-acetyltransferase 1 gene regulation by androgens requires a conserved heat shock element for heat shock factor-1. Carcinogenesis 2010; 31:820 - 6; http://dx.doi.org/10.1093/carcin/bgq042; PMID: 20176657
- Agapova LS, Ivanov AV, Sablina AA, Kopnin PB, Sokova OI, Chumakov PM, et al. P53-dependent effects of RAS oncogene on chromosome stability and cell cycle checkpoints. Oncogene 1999; 18:3135 - 42; http://dx.doi.org/10.1038/sj.onc.1202386; PMID: 10340385
- Agapova LS, Volodina JL, Chumakov PM, Kopnin BP. Activation of Ras-Ral pathway attenuates p53-independent DNA damage G2 checkpoint. J Biol Chem 2004; 279:36382 - 9; http://dx.doi.org/10.1074/jbc.M405007200; PMID: 15208305
- Kopnin PB, Kravchenko IV, Furalyov VA, Pylev LN, Kopnin BP. Cell type-specific effects of asbestos on intracellular ROS levels, DNA oxidation and G1 cell cycle checkpoint. Oncogene 2004; 23:8834 - 40; http://dx.doi.org/10.1038/sj.onc.1208108; PMID: 15480427
