Abstract
As DNA damage checkpoints are barriers to carcinogenesis, G2 checkpoint function was quantified to test for override of this checkpoint during melanomagenesis. Primary melanocytes displayed an effective G2 checkpoint response to ionizing radiation (IR)-induced DNA damage. Thirty-seven percent of melanoma cell lines displayed a significant defect in G2 checkpoint function. Checkpoint function was melanoma subtype-specific with “epithelial-like” melanoma lines, with wild type NRAS and BRAF displaying an effective checkpoint, while lines with mutant NRAS and BRAF displayed defective checkpoint function. Expression of oncogenic B-Raf in a checkpoint-effective melanoma attenuated G2 checkpoint function significantly but modestly. Other alterations must be needed to produce the severe attenuation of G2 checkpoint function seen in some BRAF-mutant melanoma lines. Quantitative trait analysis tools identified mRNA species whose expression was correlated with G2 checkpoint function in the melanoma lines. A 165 gene signature was identified with a high correlation with checkpoint function (p < 0.004) and low false discovery rate (≤ 0.077). The G2 checkpoint gene signature predicted G2 checkpoint function with 77–94% accuracy. The signature was enriched in lysosomal genes and contained numerous genes that are associated with regulation of chromatin structure and cell cycle progression. The core machinery of the cell cycle was not altered in checkpoint-defective lines but rather numerous mediators of core machinery function were. When applied to an independent series of primary melanomas, the predictive G2 checkpoint signature was prognostic of distant metastasis-free survival. These results emphasize the value of expression profiling of primary melanomas for understanding melanoma biology and disease prognosis.
Introduction
Cancer is a genetic disease, and carcinogenesis is the process of acquisition of the numerous genetic and epigenetic alterations that encode malignant phenotypes.Citation1,Citation2 Melanoma is much like other solid organ malignancies, with many mutations and chromosomal aberrations that activate proto-oncogenes and inactivate tumor suppressors.Citation3-Citation5 Common mutations in melanoma include an activating mutation in BRAF codon 600 (V600E) and deletion of the CDKN2A locus that encodes two tumor suppressors, p16INK4A and p19ARF.Citation4,Citation6,Citation7 Although mutation of TP53 is uncommon in melanoma, being seen in 10–25% of primary lesions,Citation4 inactivation of the p53 signaling pathway is common in melanoma cell lines, with 66% displaying a significant defect in p53-dependent G1 checkpoint response to ionizing radiation (IR)-induced DNA damage.Citation8 The common mutation of BRAF, which activates the mitogen-activated protein kinase (MAPK) signaling pathway, appears to be an early event in melanomagenesis, as it is seen as frequently in benign moles (nevi) as in primary melanomas.Citation9 Malignant progression of BRAF-mutant lesions appears to require mutation or inactivation of PTEN.Citation10 Thus, melanoma cell lines can be recovered with mutation in BRAF, inactivation of p53 signaling and severely reduced expression of CDKN2A and PTEN mRNAs. Melanomagenesis involves many genetic and/or epigenetic alterations.
DNA damage checkpoints represent positions of control in the cell division cycle that delay or arrest cell division when DNA damage is detected.Citation11 DNA damage checkpoints are one component of the DNA damage response (DDR) that also includes activation of DNA repair at sites of damage, transcriptional induction and repression and senescence or apoptotic cell death.Citation12 Many studies have demonstrated that activated oncogenes including mutant BRAF induce growth arrest in normal human cells through a process known as oncogene-induced senescence (OIS).Citation13-Citation19 OIS as induced by HRAS in normal human fibroblasts produced full activation of the DDR with expression of DDR markers such as γH2AX, phospho-ATM and phospho-p53.Citation14 Thus has arisen a model that activated oncogenes may induce precocious and aberrant DNA replication, leading to formation of DNA strand breaks and DNA damage checkpoint-induced growth arrest.Citation13,Citation16 Attenuation of DNA damage checkpoint signaling overrides OIS, permitting outgrowth of oncogene-transformed clones.Citation14,Citation17,Citation20 Consequently, it is important to determine the functional capacity of DNA damage checkpoints in oncogene-driven malignancies and the biological consequences of checkpoint defects. This study has quantified the functional capacity of the ATM- and ATR-dependent DNA damage G2 checkpointCitation21 in normal human melanocytes (NHMs) and 35 melanoma cell lines. Defective G2 checkpoint function was detected in 37% of the melanoma cell lines, associated with significant alterations in gene expression. Some changes in gene expression reflected melanoma subtype-dependent variation, and others were correlated with G2 checkpoint function across the melanoma subtypes. A G2 checkpoint-predictive gene signature was found to have prognostic significance for development of distant metastasis in patients with primary melanoma, suggesting that the checkpoint may retard malignant progression.
Results
Defective G2 checkpoint function in melanoma cell lines
NHM cultures displayed a significant inhibition of mitosis when analyzed 2 h after treatment with IR (1.5 Gy), indicative of G2 arrest (). The ratios of mitotic cells in IR-treated cultures in comparison to their sham-treated controls (IR/sham ratio) ranged from 2–20% among eight NHM cultures. The three new NHM cultures that were assayed in the current analysis responded to IR with the same degree of inhibition of mitosis as was seen previously in five other melanocyte cultures.Citation22 NHM strains displayed an average 90% inhibition of mitosis 2 h after 1.5 Gy of IR, indicating that only 10% of melanocytes evaded the checkpoint-induced G2 arrest.
Figure 1. G2 checkpoint function in NHM and melanoma cell lines. Flow cytometry was used to quantify mitotic cells with expression of phospho-H3 (ser10).Citation22 G2 checkpoint function was scored as the ratio of the fractions of cells in mitosis 2 h after treatment with 1.5 Gy IR or a sham treatment (IR/sham ratio). The values shown represent individual determinations in NHM11, NHM16 and NHM18 cultures and mean values in melanoma cell lines (+ sd, n = 2–6). Black bars depict newly determined values while gray bars are from our previous report.Citation22 All melanoma lines with values > 0.3 were determined to have defective G2 checkpoint function in comparison to NHMs (p < 0.05 after correction for multiple comparisons). The SK-Mel-173 line (*) was also defective. (B) G2 checkpoint function in melanoma cell lines belonging to three subtypes, “epithelial-like” with wild-type NRAS and BRAF (WT), NRAS- mutant and BRAF-mutant. Results represent mean + sd (WT, n = 5; NRAS, n = 8; BRAF, n = 22). (*) Denotes significantly different from WT (p = 0.002 for NRAS and p = 0.001 for BRAF). NRAS and BRAF were not significantly different (p = 0.1).
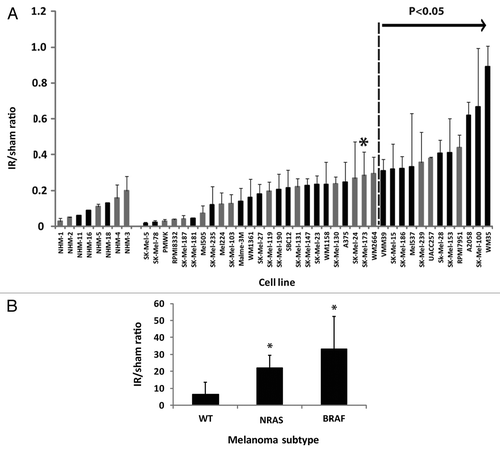
Melanoma cell lines displayed significant attenuation of DNA damage G2 checkpoint function in comparison to NHM, as evidenced by increased fractions of cells present in mitosis 2 h after irradiation (). When analyzed as a class and compared against the normal melanocytes, the melanoma lines displayed a significant defect in checkpoint function (p = 0.02). When compared on an individual basis and corrected for multiple comparisons, 13 of 35 or 37% of the melanoma lines displayed a significant defect in G2 checkpoint function (). The apparent cutoff for effective vs. defective G2 checkpoint function was 0.28–0.3. The WM2664 melanoma line displayed an average IR/sham ratio of 0.30, which was not significantly different from the NHM control (FDR-adjusted p value = 0.08), while the SK-mel173 line displayed an average ratio of 0.28, which was significantly different from the NHM control (FDR-adjusted P value = 0.04). All melanoma lines with ratios > 0.3 were significantly different from the NHM controls and thus defective for G2 checkpoint function. The melanoma lines displayed a broad range of responses to IR, with several lines responding to IR with severe G2 arrest (ratios < 0.05) and three lines with a highly attenuated response (ratios > 0.5).
As previously notedCitation22 and now extended to this larger set of melanoma cell lines, there was significant melanoma subtype-specific variation in G2 checkpoint function (). Epithelial-like melanoma lines with wild-type NRAS and BRAF alleles (here designated WT) displayed effective G2 arrest after IR, while lines with mutant NRAS or BRAF displayed significant attenuation of G2 checkpoint function ().
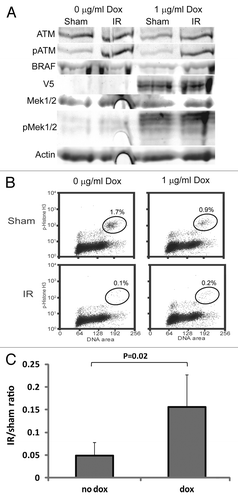
Prior studies indicated that overexpression of RAS family oncogenes could attenuate G2 checkpoint function.Citation23-Citation25 To test whether mutation of BRAF was responsible for defective G2 checkpoint function in melanoma cell lines, V5 epitope-tagged oncogenic B-Raf (V5V600E) under the control of a tetracycline-responsive promoter was induced in a G2 checkpoint-effective melanoma line with wild-type BRAF and NRAS alleles. Addition of 1 μg/ml doxycycline (dox) to culture medium induced the expression of oncogenic B-Raf in RPMI8332 cells and accordingly enhanced expression of P-MEK1/2 (). Induction of oncogenic B-Raf was also associated with attenuation of the G2 arrest in response to treatment with IR (). The attenuation of G2 checkpoint function upon induction of oncogenic B-Raf was statistically significant (p = 0.02) but modest, with a 3-fold increase in the fractions of cells evading G2 arrest (). A control experiment demonstrated that the addition of 1 μg/ml dox did not attenuate G2 checkpoint function in the parental line carrying the tetracycline transactivator but without oncogenic B-Raf (not shown). Thus, activation of MAPK signaling likely contributed to the defective G2 checkpoint function seen in the BRAF-mutant melanoma cell lines, but other changes were probably needed to produce the severe attenuation seen in some of the lines.
Figure 2. Stimulation of MAPK signaling by oncogenic B-Raf attenuates G2 checkpoint function in melanoma cells. (A) Western immunoblot showing induction of V5-V600E B-Raf and stimulation of MAPK signaling (P-MEK1/2) in the melanoma line RPMI8332. Cells were incubated with 1 μg/ml doxycycline (dox) for 48 h before cell harvest. (B) IR-induced G2 arrest. Flow cytometry was used to quantify mitotic cells 2 h after treatment with 1.5 Gy IR given at 48 h after adding dox. (C) Average IR/sham ratios with and without induction of oncogenic B-Raf. Induction of oncogenic B-Raf for 24–48 h produced a modest but significant (p = 0.02, n = 5, Student’s t-test) attenuation of IR-induced G2 arrest.
A signature of G2 checkpoint function in melanoma cell lines
The melanoma cell lines were analyzed by DNA microarray to determine global gene expression during basal growth. Expression of mRNA species in individual melanoma cell lines (measured by Cy5) was determined relative to a universal reference standard (measured by Cy3) that was mixed with each sample. Cy5/Cy3 ratios were determined as a measure of gene expression using 44,000 probes on an Agilent microarray. A quantitative trait analysis (QTA) tool was implemented that determined the Spearman correlation coefficient for the relationship between G2 checkpoint function and gene expression. shows that as the p value for this correlation was reduced incrementally from 0.007 to 0.002, the number of selected genes was reduced. At each increment the least absolute shrinkage and selection operator (LASSO) was applied in a leave-one-out cross validation (LOOCV) analysis to return a predicted value for G2 checkpoint function. The R2 correlation between observed and predicted G2 checkpoint function was maximal (0.62) when the p value of the QTA was ≤ 0.004. At this p value cutoff, the predictive accuracy of LASSO was 85% (i.e., 85% of melanoma lines were correctly predicted to have effective or defective G2 checkpoint function (results not shown) with 370 probes being selected.
Table 1. QTA and LASSO tools identify G2 checkpoint-correlated probes
A second analysis used a Bayesian statistical tool to identify genes whose expression was correlated with G2 checkpoint function in the melanoma cell lines. The Bayesian tool returned a list of genes with variable false discovery rate (FDR), the lower the FDR the greater the correlation. The 370 probes with the lowest FDR (≤ 0.077) were collected and subjected to LASSO with LOOCV. The R2 correlation of the Bayes 370 probe list was 0.64 with a predictive accuracy of 88% (not shown). A total of 165 probes were present on both the QTA and Bayes lists (the QTA370, Bayes370 and overlapping 165 probe lists are given in the Supplemental Materials packet). These probes had a low p value (≤ 0.004) and low FDR (≤ 0.077). For this list of overlapping probes, the R2 correlation by LASSO was 0.64, and its predictive accuracy by LOOCV was 94% as shown in . Because the predictive accuracy of the 165 probe intersection list was greater than the QTA370 and Bayes370 lists, it was used for subsequent analyses.
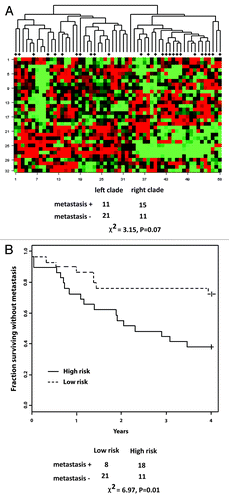
Figure 3. G2 checkpoint probe list predicts G2 checkpoint function. (A) The 165 probe list that was identified as the overlap between the QTA 377 probe list with p ≤ 0.004 and the 377 probe Bayes list with FDR ≤ 0.077 was subjected to LASSO with LOOCV. LASSO returned an equation for prediction of G2 checkpoint function as: ∑i cixi + 0.399, where ci and xi are the coefficient and expression for the i-th transcript, respectively (Supplemental Materials packet). Values of G2 checkpoint function that were predicted by LASSO were plotted against the observed values. The cutoff value for effective vs. defective G2 checkpoint function was 0.31. LASSO correctly classified G2 checkpoint function for 94% of the melanoma cell lines. The two misclassified lines were the checkpoint-effective line SK-Mel-27 with an observed IR/Sham ratio of 0.18 and a predicted ratio of 0.41 and the checkpoint defective line SK-Mel-173 with an observed ratio of 0.28 and a predicted ratio of 0.22. (B) Unsupervised hierarchical cluster of 35 melanoma cell lines using the 165 probes that were correlated with G2 checkpoint function (p ≤ 0.004 and FDR ≤ 0.077). Gene expression in melanoma cell lines was visualized using the method of Eisen et al.,Citation60 which organizes lines and transcripts according to similarity. Transcripts that were expressed at greater levels than the group median are shown in red, and transcripts that were expressed at lesser levels than the group median are shown in green. The intensity of color is proportional to the separation from the median. The two major clades (branches) in the melanoma cell line dendogram largely represented checkpoint-defective (left clade) and checkpoint-effective (right clade) classes. There were eight lines that were misclassified for a correct classification rate of 77%. Melanoma lines with mutations in BRAF and NRAS were represented in both classes. Melanoma lines with wild-type BRAF and NRAS were restricted to the checkpoint-effective class. Chi-square analysis indicated significant separation of checkpoint-effective and -defective lines (χ2 = 10.8, p = 0.02).
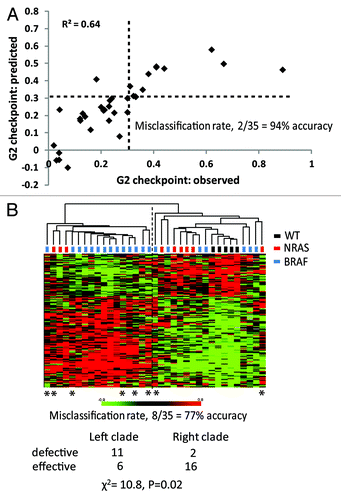
Hierarchical clustering of the melanoma cell lines using the 165 probe list produced two major clades with significant separation of checkpoint-effective and -defective lines (χ2 = 10.8, p = 0.02). The predictive accuracy of this binary hierarchical cluster analysis was 77% ().
Genes on the 165 probe list
Gene ontology analysis using Expression Analysis Systematic Explorer identified one biological category that was significantly over-represented in the 165 probe list, the lysosome. Eight lysosomal genes were on the list, STX3, USE1, FAM176A, ARSA, CTSA, DPP7, M6PR and ACP5. The commercial Ingenuity Pathways analytic tool did not identify a biological process or pathway as significantly associated with the G2 checkpoint signature list when correcting for multiple comparisons using the Benjamini-Hochberg method. However, manual curation of the 165 probe list revealed numerous genes whose expression could be expected to influence cell proliferation and/or G2 checkpoint function ( and ). Many probes on the list act at steps in a KIT receptor tyrosine kinase-initiated, MAPK-dependent signaling cascade leading to DNA replication and culminating in mitosis/cytokinesis. A total of 31 probes on the 165 probe list encoded proteins that perform biological functions that are connected to this signaling cascade. Numerous biochemical activities were represented on the list, including ubiquitin ligation, de-ubiquitination, protein kinase, protein phosphatase, transcription factor, proteosome subunits and histone methylation and acetylation ().
Figure 4. G2 checkpoint-correlated genes encode mediators of a receptor tyrosine kinase signaling cascade initiating DNA replication and culminating in mitotic cell division. KIT activates the MAPK signaling cascade to initiate DNA replication. DNA replication stress produces DNA double-strand breaks, which activate the sensor checkpoint kinases ATM and ATR and the transducer checkpoint kinases Chk1 and Chk2. Inhibition of Cdc25B blocks the activation of mitosis-promoting factor (cyclin B1/Cdk1) to enforce the G2 checkpoint. Once activated in the nucleus, mitosis-promoting factor activates the anaphase-promoting complex to complete chromatid segregation (karyokinesis) and cell division (cytokinesis). Additional signaling from MITF and TGFβ impinges on the core pathway. Checkpoint-correlated gene products are enclosed in ovals near the proteins or processes that they regulate (see for annotations). Arrows denote activation and blunt ends denote inhibition.
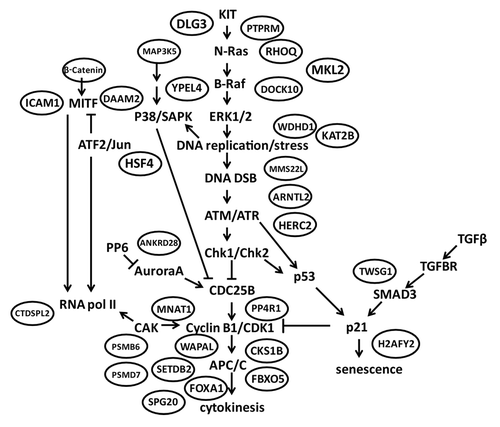
Table 2. G2 checkpoint-correlated genes encode products that mediate regulation of cell division and the G2-M transition
The G2 checkpoint signature gene list included proteins that regulate cell proliferation and migration at numerous steps in the proliferation signaling cascade ( and ). Several proteins regulate mitogen-activated protein kinase signaling (RHOQ, YPEL4, DOCK10, MAP3K5), others regulate melanogenesis through the master transcription factor MITF (β-catenin, DAAM2, ICAM1), and a third cluster appears to influence signaling through the TGF-β receptor (TWSG1, MKL2). A substantial number of proteins on the list participate in DNA metabolism and mitotic cell division. WDHD1, KAT2B, MMS22L, ARTNL2 and HERC2 are implicated in various forms of DNA metabolism or damage response and MNAT1, SETDB2, CKS1B, PP4R1, FBXO5, FOXA1, WAPAL and SPG20 are associated with steps of mitosis (prophase, metaphase, anaphase, telophase) culminating in cytokinesis. Thus, the core machinery of the cell division cycle did not appear to be altered in melanoma cell lines in a way that was correlated with G2 checkpoint function, while many regulators of the core machinery were.
Notable probes on the G2 checkpoint signature list included CKS1B, WDHD1 and H2AFY2 (). CKS1B is a subunit of the cyclin B1/Cdk1 mitosis-promoting factor (MPF) kinase and mediates MPF interaction with the anaphase-promoting complex/cyclosome (APC/C) that ubiquitinates cyclin B1 to trigger the metaphase-to-anaphase transition in mitotic cells. CKS1B mRNA was comparatively low in primary and hTERT-transduced melanocytes and high in melanoma cell lines, consistent with the enhanced proliferation of the melanoma cell lines (). Expression of CKS1B was also high in G2 checkpoint-effective melanoma cell lines and low in checkpoint-defective lines. All three melanoma subtypes displayed reduced expression with decreased G2 checkpoint function, but only in the BRAF-mutant subtype lines was the correlation significant (p = 0.02).
Figure 5. Genes may regulate G2 checkpoint function in a melanoma subtype-dependent and -independent manner. NHMs and NHM lines that were transduced with hTERT are depicted in black. WT melanoma lines are depicted in blue, NRAS-mutant lines in red and BRAF-mutant lines in purple. Gene expression is depicted as the ratio of mRNA expression in experimental samples (Cy5) divided by expression in a pool of cancer cell lines (Cy3, Stratagene universal reference mRNA). CKS1B and WHDH1 generally were expressed at higher levels in melanoma cell lines than in NHMs. Among melanoma lines, all three subtypes displayed a negative correlation between CKS1B and WDHD1 expression and G2 checkpoint function. H2AFY2 was expressed at low levels in NHMs expressing telomerase and in some NRAS- and BRAF-mutant melanoma lines. Expression of H2AFY2 was uniformly high in “epithelial-like” WT lines. Among BRAF-mutant melanoma lines H2AFY2 was not correlated with G2 checkpoint function.
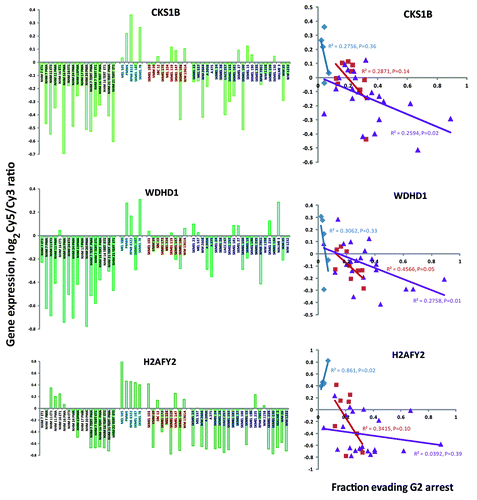
WDHD1, also known as AND1 and CTF4, has been shown to contribute to loading of DNA pol α at replicon origins through a direct interaction with a checkpoint mediator protein Tipin.Citation26 Tipin is a component of the replication fork protection complex that mediates both the intra-S checkpoint response to UV-induced DNA damageCitation27,Citation28 and the G2 checkpoint response to IR-induced DNA damage.Citation29 Low WDHD1 expression was associated with defective G2 checkpoint function (). The correlation of WDHD1 expression with G2 checkpoint function was significant for both the NRAS-mutant (p = 0.05) and BRAF-mutant (p = 0.01) melanoma lines. WDHD1 expression was also higher in the melanoma cell lines than in the primary and telomerized melanocytes.
H2AFY2, also known as macro-H2A2, is a minor histone variant that is concentrated in senescence-associated heterochromatin.Citation30 Expression of H2AFY2 was uniformly high in checkpoint-effective WT melanoma cell lines, in which decreased G2 checkpoint function was correlated with increased expression of H2AFY2 (, p = 0.02). The reduced expression of H2AFY2 in NRAS- and BRAF-mutant melanoma cell lines was not correlated with reduced G2 checkpoint function (p > 0.05). Further inspection of the data revealed substantial variation in expression of H2AFY2 in NHM cultures and melanoma cell lines. In comparison to primary NHM cultures, H2AFY2 expression was suppressed in NHM lines that were transduced with hTERT to induce telomerase activity. Expression of H2AFY2 in NHM primary cultures and NHM-hTERT lines did not differ with supplementation of melanocyte growth medium with phorbol myristylate (PMA) or endothelin-1 (ET1). The NHM-hTERT lines displayed a very low level of expression of H2AFY2 similar to that seen in three of nine melanoma lines with NRAS mutations and 13 of 23 melanoma lines with BRAF mutations. In contrast, the WT melanoma lines uniformly displayed high expression of H2AFY2.
NHM and melanocytic nevi express low levels of telomerase and nodular melanoma, metastatic melanoma and melanoma cell lines express high levels of telomeraseCitation31,Citation32 indicating that induction of telomerase is associated with malignant transformation of melanocytes. The repression of H2AFY2 expression in melanocytes that were transduced with hTERT to induce telomerase activity and immortality suggested that expression of H2AFY2 might be connected to the senescence pathway that recognizes deprotected telomeres that develop during cellular aging. Telomerase enzyme activity was quantified to test whether the elevated expression of H2AFY2 in WT melanoma cell lines affected expression of telomerase. Melanoma lines with high expression of H2AFY2 (PMWK, RPMI8322) displayed high levels of telomerase similar to those seen in melanoma lines with intermediate or low expression of H2AFY2 (Fig. S1). Thus, it appeared that expression of H2AFY2 was not correlated with the induction of telomerase activity in melanoma.
Prognostic significance of G2 checkpoint signature list
To test the biological significance of the G2 checkpoint signature list, an independent melanoma microarray database was analyzed. Winnepenninckx et al. quantified gene expression in 58 primary melanomas that did or did not develop distant metastases within 4 y of primary diagnosis.Citation33 The primary Agilent microarray data were downloaded from an open source and loaded into BRB array tools to generate Cy5/Cy3 ratios as indices of gene expression; a total of 6307 probes passed filtration and were available for analysis.Citation34 Of the 165 probes on the G2 checkpoint signature list, 32 were present in the filtered melanoma data set. These 32 probes were analyzed with a survival risk prediction (SRP) tool to generate two groups, one with low risk of development of distant metastasis, the other with high risk (). The 32 probes that were in the G2 checkpoint gene signature returned a significant separation of outcome in the melanoma patient samples (p = 0.018). Thus, in an independent melanoma data set, genes whose expression was correlated with DNA damage G2 checkpoint function were prognostic of melanoma outcome.
Figure 6. The G2 checkpoint signature list is prognostic for melanoma progression. Primary melanomas were analyzed for global gene expression using the Agilent microarray platform. A 6307 probe set was downloaded from an open source and analyzed for probes that were prognostic for development of distant metastases within four years of resection of the primary tumor.Citation8,Citation33 The 165 probe set that was correlated with G2 checkpoint function was used with survival risk prediction to generate two patient groups, one with low probability of distant metastasis, one with high probability. The separation of the two groups in the Kaplan-Meier survival plot was significant (χ2 = 10.8, p = 0.002).
A similar analysis of DNA damage G1 checkpoint function in melanoma cell lines generated a different signature of gene expression that also was prognostic of melanoma progression.Citation34 The G1 and G2 checkpoint signatures contained no overlapping probes. To test whether a combination of the two prognostic tests performed better than either individual test, SRP was done to identify patients who were classified as high risk in both signatures or low risk in both signatures. The separation of metastasis incidence for the high/high and low/low groups was greater that than obtained using the G2 signature alone but less than that obtained using the G1 signature alone. The χ2 values for the individual tests were 5.6 (p = 0.018) and 10.9 (p = 0.001) for G2 and G1, respectively, and the χ2 value for the combined test was 9.7 (p = 0.002). Combining the G1 and G2 checkpoint signatures did not improve prognostic identification of patients with high risk to develop a distant metastasis, in comparison to the G1 signature used alone.
Discussion
Melanoma cell lines displayed substantial variation in DNA damage G2 checkpoint function with 37% being classified as defective in comparison to NHM cultures. Expression of oncogenic B-Raf appeared to attenuate G2 checkpoint function only modestly, implying that other genetic or epigenetic alterations are required to produce the severely defective G2 checkpoint function seen in some melanoma cell lines. Bioinformatic analyses of global gene expression identified 165 probes that were correlated with G2 checkpoint function with low p-values and low FDR. Gene products that are translated from these mRNAs were not core components of the cell cycle but rather mediators. Probes on the G2 checkpoint signature list were prognostic for melanoma progression in an independent data set.
Defects in G2 checkpoint function were restricted to melanoma cell lines with mutant BRAF and NRAS oncogenes. Many reports have associated defects in G2 checkpoint function with activation of the MAPK signaling pathway,Citation23-Citation25,Citation35 but few studies have focused on the effects of oncogenic B-Raf. Expression of oncogenic B-Raf at levels sufficient to activate MEK1/2 produced a modest but significant attenuation of G2 checkpoint function in the RPMI8322 melanoma line. As some melanoma cell lines displayed a severe attenuation of the G2 checkpoint, the results suggest that other melanoma-associated phenotypic alterations also influence the G2 checkpoint response to IR-induced DNA damage.
Two proteins in the melanomagenesis pathway, PTEN and AKT, have been reported to interact with or influence the checkpoint transducer kinase CHK1.Citation36,Citation37 Inactivation of PTEN appeared to reduce CHK1 kinase activity within the nucleus by cytoplasmic sequestration.Citation37 AKT was shown to phosphorylate CHK1 on ser180 to promote its cytoplasmic sequestration.Citation37 Reduced activity of PTEN or activation of AKT therefore might attenuate the G2 checkpoint response to IR-induced DNA damage by deregulating CHK1. BRAF mutations appear to cooperate with inactivation of PTEN in melanomagenesis.Citation4,Citation10,Citation38 In the current series, many of the melanoma lines with mutations in BRAF were identified with severe reductions in PTEN mRNA levels. However, PTEN mRNA expression was not correlated with G2 checkpoint function (not shown). The WM35 melanoma line with mutant BRAF and a severe defect in G2 checkpoint function expressed PTEN mRNA at levels seen in NHM and telomerase-expressing NHM. Moreover, the checkpoint-effective PMWK line displayed very low expression of PTEN mRNA associated with homozygous deletion of the PTEN gene locus (results not shown). Reduced expression of PTEN mRNA did not account for the reduced G2 checkpoint function in BRAF-mutant melanoma cell lines. Activation of AKT was recognized in many of the melanoma cell lines studied here and the “epithelial-like” melanoma lines with wild-type NRAS and BRAF expressed lower levels of phospho-AKT than the lines with oncogene mutations.Citation39 Mutational inactivation of PTEN and/or mutational activation of AKT (without alteration in mRNA levels) might contribute to reduced G2 checkpoint function in BRAF-mutant melanoma cell lines. A parallel branch of the MAPK pathway leading to activation of ERK1/2, p38SAPK and JNK includes MAP3K5 and MAP3K9. Inactivating base-substitution mutations in MAP3K5, a member of the 165 probe G2 checkpoint signature list, were found in 9% of melanoma cell lines.Citation40 MAP3K5 mRNA was negatively correlated with G2 checkpoint function; thus, reduced expression of MAP3K5 mRNA was associated with increased fractions of cells evading IR-induced G2 arrest.
Bioinformatic analysis of the G2 checkpoint signature list identified the lysosome as a potential modifier of checkpoint function. The lysosome is a key organelle in the process of autophagy that degrades intracellular proteins by a non-proteosomal mechanism.Citation41 Autophagy has been linked to activation of cytoplasmic ATM,Citation42 a key transducer kinase in the G2 checkpoint immediately upstream of CHK1.Citation12,Citation43,Citation44 Autophagy is also regulated by protein acetylation and deacetylation,Citation45,Citation46 and recent studies demonstrate the requirement of protein acetylation and deacetylation in the response to DNA double-strand breaks.Citation47 The presence of the histone acetyltransferase KAT2B on the G2 checkpoint gene list provides a possible connection to lysosomes and autophagy.Citation47,Citation48
The list of checkpoint-correlated probes contained many genes that are connected to regulation of mitosis, including CKS1B, WHDH1 and MNAT1. A recent study has associated alterations in CKS family proteins with override of the replication checkpoint that blocks the initiation of mitosis in cells with incomplete DNA replication.Citation49 The protein product of WDHD1, AND1, is known to interact with Tipin, an established mediator of G2 checkpoint function.Citation29 MNAT1 is a subunit of CAK, the CDK-activating kinase that phosphorylates CDK1 on thr161.Citation50 It is conceivable that a variety of combinations of alterations in gene expression are manifested as a functional defect in the ability to respond to IR-induced DNA damage and arrest in G2.
H2AFY2 appeared to be on the G2 checkpoint signature list because of its high expression in the “epithelial-like” melanoma lines and reduced expression in NRAS- and BRAF-mutant lines. Among the BRAF-mutant lines, expression of H2AFY2 was not correlated with G2 checkpoint function. Macro-H2A.2, the protein product of the gene locus, has been linked to cellular aging being induced in senescent cells.Citation51 Macro-H2A proteins appear to concentrate in senescence-associated heterochromatin, suggesting that macro-H2A may help to organize a repressive chromatin structure that enforces senescence. Macro-H2A was shown to repress CDK8 in a melanoma cell line as a potential mechanism of tumor suppression.Citation52 In the current data series, there was no correlation between H2AFY2 and CDK8 mRNA expression among the 35 melanoma cell lines (data not shown). The repression of H2AFY2 expression in melanocytes that were transduced with hTERT to induce telomerase activity and immortality suggested that expression of H2AFY2 might be connected to the mechanisms of regulation of telomerase and immortality in melanoma. However, no correlation between H2AFY2 and telomerase enzyme activity was observed in the melanoma cell lines, and lines with high expression of H2AFY2 expressed telomerase activity at the same levels as lines with low expression of H2AFY2. The biological significance of high expression of H2AFY2 in WT melanoma cell lines remains to be determined.
Given that DNA damage checkpoints slow cell cycling and stabilize the genome,Citation53-Citation55 it is axiomatic that defects in checkpoint function enhance neoplastic growth and genomic instability, thereby fueling malignant progression. This facet of cancer biology may be reflected in the result that signatures of gene expression that were predictive of G1 and G2 checkpoint function were also prognostic for a measure of melanoma disease progression, i.e., development of a distant metastasis. The G1 and G2 checkpoint signatures did not contain any overlapping transcripts, and there was no correlation between G1 and G2 checkpoint function in the melanoma lines (R2 < 0.001). The result that combination of the G1 and G2 signatures did not improve prognosis suggests that the DNA damage G1 and G2 checkpoints use different pathways to enforce a common barrier to melanomagenesis.
Materials and Methods
Molecular biology and viral transduction
A V5-tagged oncogenic BRAF (V600E) insert was synthesized and cloned into the pRetro-X-Tight-Hyg (Clonetech) vector by Blue Heron Biotechnology. The V5-BRAF insert was confirmed by sequenceing (data not shown). Virus was packaged and cells infected using standard methods as described previously.Citation56 The RPMI8322 cell line that is wild-type for NRAS and BRAF was first infected with the Retro-X-TetON-Advanced (Clonetech) virus to express the TetON transactivator. Following 1 wk of selection in 500 µg/ml G418 (Life Technologies), the cells were infected with the V5-BRAF-expressing virus. These cells were subsequently selected in 100 µg/ml Hygromycin B (Roche) for 1 wk prior to use.
Cell culture and assay of G2 checkpoint function
Normal human melanocytes (NHMs) and melanoma cell lines were grown and assayed for G2 checkpoint function as previously described.Citation22 Cells were routinely assayed for mycoplasma contamination using commercial kits (Geneprobe, Gene-Probe and PlasmoTest™, Invivogen). Contaminated cultures were cleansed with ciprofloxacin and/or a commercial antibiotic (Plasmocin, Invivogen). Results are reported only for mycoplasma-negative cell cultures. NHM cultures were grown in growth medium supplemented with phorbol myristylate (PMA) as previously describedCitation22 or when indicated PMA was replaced with endothelin-1 (ET1) at 100 ng/ml. To induce expression of telomerase and generate immortal lines NHM were transduced with hTERT by retroviral infection and selection with puromycin (50 μg/ml) as previously describedCitation56 then grown with PMA or ET1.
G2 checkpoint function was quantified by flow cytometric determination of the fraction of cells that were positive for expression of phospho-ser10 histone H3 as measured 2 h after irradiation with 1.5 Gy IR using a RS2000 Biological Irradiator (Rad-Source). The fraction of cells in mitosis in IR-treated cultures was expressed as a percentage of the same fraction scored in sham-treated controls.
The RPMI8322 cell line and its derivative were grown in high-glucose DMEM (Life Technologies or Cellgro) supplemented with 10% bovine growth serum (Hyclone). Addition of 1 μg/ml doxycycline (dox) to culture medium activated the tetracycline transactivator and induced expression of V5-tagged, oncogenic B-Raf (V5V600E). The parental RPMI8322 melanoma line was shown to display a severely defective G1 checkpoint response to ionizing radiation, demonstrating functional inactivation of p53 signaling.Citation8 Expression of V5V600E was monitored by immunoblot analysis using antibodies against V5 (Sigma), B-Raf (Cell Signaling) and phospho-MEK1/2 (Cell Signaling). Cells were assayed for G2 checkpoint function 24 or 48 h after addition of 1 μg/ml dox.
G2 checkpoint function was compared between individual melanoma cell lines and a group of eight NHM strains, based on a linear mixed effects modelCitation57 to account for the potential correlation of multiple measurements (median of 3 with interquartile range of 2–4) per cell line. A one-sided t-test used the predicted empirical Bayesian estimate of each cell line from the output of the linear mixed effects model to identify melanoma cell lines with significantly reduced IR-induced mitotic inhibition in comparison to the set of NHMs. P values were adjusted for multiple comparisons using the method of Benjamini and Hochberg.Citation58
Signature of G2 checkpoint function
Analysis of gene expression using cDNA microarrays was done as previously described.Citation8,Citation22 mRNA expression in NHM and melanoma cell lines (Cy5 dye) was expressed relative to a universal human mRNA standard (Cy3 dye). The log2 ratio of Cy5 to Cy3 intensities was computed for each probe.
Analysis of microarray data was done using BRB array tools software.Citation59 Quantitative trait analysis (QTA) used the Spearman correlation coefficient to identify genes whose expression was correlated with G2 checkpoint function in melanoma cell lines. A Bayesian method for selection of significant genes was applied as previously describedCitation22 to identify G2 checkpoint-correlated genes with low false-discovery rate (FDR < 0.077). The least absolute shrinkage and selection operator (LASSO) was used with leave-one-out cross validation (LOOCV) to predict G2 checkpoint function from gene expression signatures. Hierarchical clustering was also used to predict G2 checkpoint-effective and -defective melanoma cell lines.
Gene ontology analysis was done using DAVID 6.7 (http://david.abcc.ncifcrf.gov/). The Ingenuity Pathways tool was used to search for biological functions and pathways that are associated with genes in the G2 checkpoint signature. The survival risk prediction BRB array tool was used to determine whether a G2 checkpoint gene signature predicted development of distant metastasis in an independent data setCitation33 as was done previously using a G1 checkpoint gene signature.Citation8
| Abbreviations: | ||
| BrdU | = | 5′-bromo-deoxyuridine |
| DDR | = | DNA damage response |
| dox | = | doxycycline |
| ET1 | = | endothelin-1 |
| FDR | = | false-discovery rate |
| IR | = | ionizing radiation |
| LASSO | = | least absolute shrinkage and selection operator |
| LOOCV | = | leave-one-out cross-validation |
| MAPK | = | mitogen-activated protein kinase |
| NHM | = | normal human melanocyte |
| OIS | = | oncogene-induced senescence |
| PMA | = | phorbol myristylate |
| SRP | = | survival risk prediction |
| TTA | = | tetracycline transactivator |
| QTA | = | quantitative trait analysis |
Additional material
Download Zip (166.1 KB)Acknowledgments
We are grateful to Drs Jayne Boyer and Leena Nylander-French for providing primary melanocyte cultures. Supported in part by PHS grants ES10126, CA16086 and ES014635. This research was supported in part by the Intramural Research Program of the NIH, National Institute of Environmental Health Sciences.
Disclosure of Potential Conflicts of Interest
No potential conflicts of interest were disclosed.
Supplemental Materials
Supplemental materials may be found here: www.landesbioscience.com/journals/cc/article/24067
Related Research Data
References
- Hanahan D, Weinberg RA. The hallmarks of cancer. Cell 2000; 100:57 - 70; http://dx.doi.org/10.1016/S0092-8674(00)81683-9; PMID: 10647931
- Hanahan D, Weinberg RA. Hallmarks of cancer: the next generation. Cell 2011; 144:646 - 74; http://dx.doi.org/10.1016/j.cell.2011.02.013; PMID: 21376230
- Ibarrola-Villava M, Fernandez LP, Pita G, Bravo J, Floristan U, Sendagorta E, et al. Genetic analysis of three important genes in pigmentation and melanoma susceptibility: CDKN2A, MC1R and HERC2/OCA2. Exp Dermatol 2010; 19:836 - 44; http://dx.doi.org/10.1111/j.1600-0625.2010.01115.x; PMID: 20629734
- Daniotti M, Oggionni M, Ranzani T, Vallacchi V, Campi V, Di Stasi D, et al. BRAF alterations are associated with complex mutational profiles in malignant melanoma. Oncogene 2004; 23:5968 - 77; http://dx.doi.org/10.1038/sj.onc.1207780; PMID: 15195137
- Lin WM, Baker AC, Beroukhim R, Winckler W, Feng W, Marmion JM, et al. Modeling genomic diversity and tumor dependency in malignant melanoma. Cancer Res 2008; 68:664 - 73; http://dx.doi.org/10.1158/0008-5472.CAN-07-2615; PMID: 18245465
- Bastian BC, LeBoit PE, Hamm H, Bröcker EB, Pinkel D. Chromosomal gains and losses in primary cutaneous melanomas detected by comparative genomic hybridization. Cancer Res 1998; 58:2170 - 5; PMID: 9605762
- Palmieri G, Capone M, Ascierto ML, Gentilcore G, Stroncek DF, Casula M, et al. Main roads to melanoma. J Transl Med 2009; 7:86; http://dx.doi.org/10.1186/1479-5876-7-86; PMID: 19828018
- Carson C, Omolo B, Chu H, Zhou Y, Sambade MJ, Peters EC, et al. A prognostic signature of defective p53-dependent G1 checkpoint function in melanoma cell lines. Pigment Cell Melanoma Res 2012; 25:514 - 26; http://dx.doi.org/10.1111/j.1755-148X.2012.01010.x; PMID: 22540896
- Kumar R, Angelini S, Snellman E, Hemminki K. BRAF mutations are common somatic events in melanocytic nevi. J Invest Dermatol 2004; 122:342 - 8; http://dx.doi.org/10.1046/j.0022-202X.2004.22225.x; PMID: 15009715
- Tsao H, Goel V, Wu H, Yang G, Haluska FG. Genetic interaction between NRAS and BRAF mutations and PTEN/MMAC1 inactivation in melanoma. J Invest Dermatol 2004; 122:337 - 41; http://dx.doi.org/10.1046/j.0022-202X.2004.22243.x; PMID: 15009714
- Kaufmann WK, Paules RS. DNA damage and cell cycle checkpoints. FASEB J 1996; 10:238 - 47; PMID: 8641557
- Ciccia A, Elledge SJ. The DNA damage response: making it safe to play with knives. Mol Cell 2010; 40:179 - 204; http://dx.doi.org/10.1016/j.molcel.2010.09.019; PMID: 20965415
- Bartkova J, Rezaei N, Liontos M, Karakaidos P, Kletsas D, Issaeva N, et al. Oncogene-induced senescence is part of the tumorigenesis barrier imposed by DNA damage checkpoints. Nature 2006; 444:633 - 7; http://dx.doi.org/10.1038/nature05268; PMID: 17136093
- Di Micco R, Fumagalli M, Cicalese A, Piccinin S, Gasparini P, Luise C, et al. Oncogene-induced senescence is a DNA damage response triggered by DNA hyper-replication. Nature 2006; 444:638 - 42; http://dx.doi.org/10.1038/nature05327; PMID: 17136094
- Gorgoulis VG, Vassiliou LV, Karakaidos P, Zacharatos P, Kotsinas A, Liloglou T, et al. Activation of the DNA damage checkpoint and genomic instability in human precancerous lesions. Nature 2005; 434:907 - 13; http://dx.doi.org/10.1038/nature03485; PMID: 15829965
- Halazonetis TD, Gorgoulis VG, Bartek J. An oncogene-induced DNA damage model for cancer development. Science 2008; 319:1352 - 5; http://dx.doi.org/10.1126/science.1140735; PMID: 18323444
- Negrini S, Gorgoulis VG, Halazonetis TD. Genomic instability--an evolving hallmark of cancer. Nat Rev Mol Cell Biol 2010; 11:220 - 8; http://dx.doi.org/10.1038/nrm2858; PMID: 20177397
- Hömig-Hölzel C, van Doorn R, Vogel C, Germann M, Cecchini MG, Verdegaal E, et al. Antagonistic TSC22D1 variants control BRAF(E600)-induced senescence. EMBO J 2011; 30:1753 - 65; http://dx.doi.org/10.1038/emboj.2011.95; PMID: 21448135
- Michaloglou C, Vredeveld LC, Mooi WJ, Peeper DS. BRAF(E600) in benign and malignant human tumours. Oncogene 2008; 27:877 - 95; http://dx.doi.org/10.1038/sj.onc.1210704; PMID: 17724477
- Haferkamp S, Tran SL, Becker TM, Scurr LL, Kefford RF, Rizos H. The relative contributions of the p53 and pRb pathways in oncogene-induced melanocyte senescence. Aging (Albany NY) 2009; 1:542 - 56; PMID: 20157537
- Brown EJ, Baltimore D. Essential and dispensable roles of ATR in cell cycle arrest and genome maintenance. Genes Dev 2003; 17:615 - 28; http://dx.doi.org/10.1101/gad.1067403; PMID: 12629044
- Kaufmann WK, Nevis KR, Qu P, Ibrahim JG, Zhou T, Zhou Y, et al. Defective cell cycle checkpoint functions in melanoma are associated with altered patterns of gene expression. J Invest Dermatol 2008; 128:175 - 87; http://dx.doi.org/10.1038/sj.jid.5700935; PMID: 17597816
- Santana C, Ortega E, García-Carrancá A. Oncogenic H-ras induces cyclin B1 expression in a p53-independent manner. Mutat Res 2002; 508:49 - 58; http://dx.doi.org/10.1016/S0027-5107(02)00172-0; PMID: 12379461
- Agapova LS, Volodina JL, Chumakov PM, Kopnin BP. Activation of Ras-Ral pathway attenuates p53-independent DNA damage G2 checkpoint. J Biol Chem 2004; 279:36382 - 9; http://dx.doi.org/10.1074/jbc.M405007200; PMID: 15208305
- Knauf JA, Ouyang B, Knudsen ES, Fukasawa K, Babcock G, Fagin JA. Oncogenic RAS induces accelerated transition through G2/M and promotes defects in the G2 DNA damage and mitotic spindle checkpoints. J Biol Chem 2006; 281:3800 - 9; http://dx.doi.org/10.1074/jbc.M511690200; PMID: 16316983
- Errico A, Cosentino C, Rivera T, Losada A, Schwob E, Hunt T, et al. Tipin/Tim1/And1 protein complex promotes Pol alpha chromatin binding and sister chromatid cohesion. EMBO J 2009; 28:3681 - 92; http://dx.doi.org/10.1038/emboj.2009.304; PMID: 19893489
- Unsal-Kaçmaz K, Chastain PD, Qu PP, Minoo P, Cordeiro-Stone M, Sancar A, et al. The human Tim/Tipin complex coordinates an Intra-S checkpoint response to UV that slows replication fork displacement. Mol Cell Biol 2007; 27:3131 - 42; http://dx.doi.org/10.1128/MCB.02190-06; PMID: 17296725
- Smith-Roe SL, Patel SS, Simpson DA, Zhou YC, Rao S, Ibrahim JG, et al. Timeless functions independently of the Tim-Tipin complex to promote sister chromatid cohesion in normal human fibroblasts. Cell Cycle 2011; 10:1618 - 24; http://dx.doi.org/10.4161/cc.10.10.15613; PMID: 21508667
- Chou DM, Elledge SJ. Tipin and Timeless form a mutually protective complex required for genotoxic stress resistance and checkpoint function. Proc Natl Acad Sci USA 2006; 103:18143 - 7; http://dx.doi.org/10.1073/pnas.0609251103; PMID: 17116885
- Schulz L, Tyler J. Heterochromatin focuses on senescence. Mol Cell 2005; 17:168 - 70; http://dx.doi.org/10.1016/j.molcel.2005.01.003; PMID: 15664186
- Bandyopadhyay D, Timchenko N, Suwa T, Hornsby PJ, Campisi J, Medrano EE. The human melanocyte: a model system to study the complexity of cellular aging and transformation in non-fibroblastic cells. Exp Gerontol 2001; 36:1265 - 75; http://dx.doi.org/10.1016/S0531-5565(01)00098-5; PMID: 11602203
- Miracco C, Pacenti L, Santopietro R, Laurini L, Biagioli M, Luzi P. Evaluation of telomerase activity in cutaneous melanocytic proliferations. Hum Pathol 2000; 31:1018 - 21; http://dx.doi.org/10.1053/hupa.2000.9779; PMID: 11014565
- Winnepenninckx V, Lazar V, Michiels S, Dessen P, Stas M, Alonso SR, et al, Melanoma Group of the European Organization for Research and Treatment of Cancer. Gene expression profiling of primary cutaneous melanoma and clinical outcome. J Natl Cancer Inst 2006; 98:472 - 82; http://dx.doi.org/10.1093/jnci/djj103; PMID: 16595783
- Carson C, Omolo B, Chu H, Zhou Y, Sambade MJ, Peters EC, et al. A prognostic signature of defective p53-dependent G1 checkpoint function in melanoma cell lines. Pigment Cell Melanoma Res 2012; 25:514 - 26; http://dx.doi.org/10.1111/j.1755-148X.2012.01010.x; PMID: 22540896
- Mikhailov A, Patel D, McCance DJ, Rieder CL. The G2 p38-mediated stress-activated checkpoint pathway becomes attenuated in transformed cells. Curr Biol 2007; 17:2162 - 8; http://dx.doi.org/10.1016/j.cub.2007.11.028; PMID: 18060783
- Ming M, He YY. PTEN in DNA damage repair. Cancer Lett 2012; 319:125 - 9; http://dx.doi.org/10.1016/j.canlet.2012.01.003; PMID: 22266095
- Puc J, Keniry M, Li HS, Pandita TK, Choudhury AD, Memeo L, et al. Lack of PTEN sequesters CHK1 and initiates genetic instability. Cancer Cell 2005; 7:193 - 204; http://dx.doi.org/10.1016/j.ccr.2005.01.009; PMID: 15710331
- Damsky WE, Curley DP, Santhanakrishnan M, Rosenbaum LE, Platt JT, Gould Rothberg BE, et al. β-catenin signaling controls metastasis in Braf-activated Pten-deficient melanomas. Cancer Cell 2011; 20:741 - 54; http://dx.doi.org/10.1016/j.ccr.2011.10.030; PMID: 22172720
- Shields JM, Thomas NE, Cregger M, Berger AJ, Leslie M, Torrice C, et al. Lack of extracellular signal-regulated kinase mitogen-activated protein kinase signaling shows a new type of melanoma. Cancer Res 2007; 67:1502 - 12; http://dx.doi.org/10.1158/0008-5472.CAN-06-3311; PMID: 17308088
- Stark MS, Woods SL, Gartside MG, Bonazzi VF, Dutton-Regester K, Aoude LG, et al. Frequent somatic mutations in MAP3K5 and MAP3K9 in metastatic melanoma identified by exome sequencing. Nat Genet 2012; 44:165 - 9; http://dx.doi.org/10.1038/ng.1041; PMID: 22197930
- Rajawat YS, Hilioti Z, Bossis I. Aging: central role for autophagy and the lysosomal degradative system. Ageing Res Rev 2009; 8:199 - 213; http://dx.doi.org/10.1016/j.arr.2009.05.001; PMID: 19427410
- Alexander A, Cai SL, Kim J, Nanez A, Sahin M, MacLean KH, et al. ATM signals to TSC2 in the cytoplasm to regulate mTORC1 in response to ROS. Proc Natl Acad Sci USA 2010; 107:4153 - 8; http://dx.doi.org/10.1073/pnas.0913860107; PMID: 20160076
- Paules RS, Levedakou EN, Wilson SJ, Innes CL, Rhodes N, Tlsty TD, et al. Defective G2 checkpoint function in cells from individuals with familial cancer syndromes. Cancer Res 1995; 55:1763 - 73; PMID: 7712486
- Kastan MB, Lim DS, Kim ST, Yang D. ATM--a key determinant of multiple cellular responses to irradiation. Acta Oncol 2001; 40:686 - 8; http://dx.doi.org/10.1080/02841860152619089; PMID: 11765061
- New M, Olzscha H, La Thangue NB. HDAC inhibitor-based therapies: can we interpret the code?. Mol Oncol 2012; 6:637 - 56; http://dx.doi.org/10.1016/j.molonc.2012.09.003; PMID: 23141799
- Pietrocola F, Marino G, Lissa D, Vacchelli E, Malik SA, Niso-Santano M, et al. Pro-autophagic polyphenols reduce the acetylation of cytoplasmic proteins. Cell Cycle 2012; 11; http://dx.doi.org/10.4161/cc.22027
- Shubassi G, Robert T, Vanoli F, Minucci S, Foiani M. Acetylation: a novel link between double-strand break repair and autophagy. Cancer Res 2012; 72:1332 - 5; http://dx.doi.org/10.1158/0008-5472.CAN-11-3172; PMID: 22422989
- Robert T, Vanoli F, Chiolo I, Shubassi G, Bernstein KA, Rothstein R, et al. HDACs link the DNA damage response, processing of double-strand breaks and autophagy. Nature 2011; 471:74 - 9; http://dx.doi.org/10.1038/nature09803; PMID: 21368826
- Liberal V, Martinsson-Ahlzén HS, Liberal J, Spruck CH, Widschwendter M, McGowan CH, et al. Cyclin-dependent kinase subunit (Cks) 1 or Cks2 overexpression overrides the DNA damage response barrier triggered by activated oncoproteins. Proc Natl Acad Sci USA 2012; 109:2754 - 9; http://dx.doi.org/10.1073/pnas.1102434108; PMID: 21697511
- Lolli G, Johnson LN. CAK-Cyclin-dependent Activating Kinase: a key kinase in cell cycle control and a target for drugs?. Cell Cycle 2005; 4:572 - 7; http://dx.doi.org/10.4161/cc.4.4.1607; PMID: 15876871
- Kreiling JA, Tamamori-Adachi M, Sexton AN, Jeyapalan JC, Munoz-Najar U, Peterson AL, et al. Age-associated increase in heterochromatic marks in murine and primate tissues. Aging Cell 2011; 10:292 - 304; http://dx.doi.org/10.1111/j.1474-9726.2010.00666.x; PMID: 21176091
- Kapoor A, Goldberg MS, Cumberland LK, Ratnakumar K, Segura MF, Emanuel PO, et al. The histone variant macroH2A suppresses melanoma progression through regulation of CDK8. Nature 2010; 468:1105 - 9; http://dx.doi.org/10.1038/nature09590; PMID: 21179167
- Kaufmann WK, Kaufman DG. Cell cycle control, DNA repair and initiation of carcinogenesis. FASEB J 1993; 7:1188 - 91; PMID: 8375618
- Hartwell LH, Weinert TA. Checkpoints: controls that ensure the order of cell cycle events. Science 1989; 246:629 - 34; http://dx.doi.org/10.1126/science.2683079; PMID: 2683079
- Kastan MB, Bartek J. Cell-cycle checkpoints and cancer. Nature 2004; 432:316 - 23; http://dx.doi.org/10.1038/nature03097; PMID: 15549093
- Simpson DA, Livanos E, Heffernan TP, Kaufmann WK. Telomerase expression is sufficient for chromosomal integrity in cells lacking p53 dependent G1 checkpoint function. J Carcinog 2005; 4:18; http://dx.doi.org/10.1186/1477-3163-4-18; PMID: 16209708
- Verbeke GaM. G. Linear Mixed Models for Longitudinal Data. Springer Series in Statistics. New York: Springer-Verlag, 2000.
- Benjamini Y, Hochberg Y. Controlling the false discovery rate: a practical and powerful approach to multiple testing. J R Stat Soc, B 1995; 57:289 - 300
- Simon R, Lam A, Li MC, Ngan M, Menenzes S, Zhao Y. Analysis of gene expression data using BRB-ArrayTools. Cancer Inform 2007; 3:11 - 7; PMID: 19455231
- Eisen MB, Spellman PT, Brown PO, Botstein D. Cluster analysis and display of genome-wide expression patterns. Proc Natl Acad Sci USA 1998; 95:14863 - 8; http://dx.doi.org/10.1073/pnas.95.25.14863; PMID: 9843981
- Van Campenhout CA, Eitelhuber A, Gloeckner CJ, Giallonardo P, Gegg M, Oller H, et al. Dlg3 trafficking and apical tight junction formation is regulated by nedd4 and nedd4-2 e3 ubiquitin ligases. Dev Cell 2011; 21:479 - 91; http://dx.doi.org/10.1016/j.devcel.2011.08.003; PMID: 21920314
- Burgoyne AM, Palomo JM, Phillips-Mason PJ, Burden-Gulley SM, Major DL, Zaremba A, et al. PTPmu suppresses glioma cell migration and dispersal. Neuro Oncol 2009; 11:767 - 78; http://dx.doi.org/10.1215/15228517-2009-019; PMID: 19304959
- Sander EE, Collard JG. Rho-like GTPases: their role in epithelial cell-cell adhesion and invasion. Eur J Cancer 1999; 35:1302 - 8; http://dx.doi.org/10.1016/S0959-8049(99)00145-8; PMID: 10658518
- Liang P, Wan Y, Yan Y, Wang Y, Luo N, Deng Y, et al. MVP interacts with YPEL4 and inhibits YPEL4-mediated activities of the ERK signal pathway. Biochem Cell Biol 2010; 88:445 - 50; http://dx.doi.org/10.1139/O09-166; PMID: 20555386
- Gadea G, Sanz-Moreno V, Self A, Godi A, Marshall CJ. DOCK10-mediated Cdc42 activation is necessary for amoeboid invasion of melanoma cells. Curr Biol 2008; 18:1456 - 65; http://dx.doi.org/10.1016/j.cub.2008.08.053; PMID: 18835169
- Lee HK, Deneen B. Daam2 is required for dorsal patterning via modulation of canonical Wnt signaling in the developing spinal cord. Dev Cell 2012; 22:183 - 96; http://dx.doi.org/10.1016/j.devcel.2011.10.025; PMID: 22227309
- Chen LM, Kuo CH, Lai TY, Lin YM, Su CC, Hsu HH, et al. RANKL increases migration of human lung cancer cells through intercellular adhesion molecule-1 up-regulation. J Cell Biochem 2011; 112:933 - 41; http://dx.doi.org/10.1002/jcb.23009; PMID: 21328467
- Pham L, Beyer K, Jensen ED, Rodriguez JS, Davydova J, Yamamoto M, et al. Bone morphogenetic protein 2 signaling in osteoclasts is negatively regulated by the BMP antagonist, twisted gastrulation. J Cell Biochem 2011; 112:793 - 803; http://dx.doi.org/10.1002/jcb.23003; PMID: 21328453
- Lee SM, Vasishtha M, Prywes R. Activation and repression of cellular immediate early genes by serum response factor cofactors. J Biol Chem 2010; 285:22036 - 49; http://dx.doi.org/10.1074/jbc.M110.108878; PMID: 20466732
- Jin X, Eroglu B, Cho W, Yamaguchi Y, Moskophidis D, Mivechi NF. Inactivation of heat shock factor Hsf4 induces cellular senescence and suppresses tumorigenesis in vivo. Mol Cancer Res 2012; 10:523 - 34; http://dx.doi.org/10.1158/1541-7786.MCR-11-0530; PMID: 22355043
- Gatta R, Mantovani R. Single nucleosome ChIPs identify an extensive switch of acetyl marks on cell cycle promoters. Cell Cycle 2010; 9:2149 - 59; http://dx.doi.org/10.4161/cc.9.11.11839; PMID: 20505338
- Li Y, Jaramillo-Lambert AN, Yang Y, Williams R, Lee NH, Zhu W. And-1 is required for the stability of histone acetyltransferase Gcn5. Oncogene 2012; 31:643 - 52; PMID: 21725360
- O’Donnell L, Panier S, Wildenhain J, Tkach JM, Al-Hakim A, Landry MC, et al. The MMS22L-TONSL complex mediates recovery from replication stress and homologous recombination. Mol Cell 2010; 40:619 - 31; http://dx.doi.org/10.1016/j.molcel.2010.10.024; PMID: 21055983
- Shi S, Hida A, McGuinness OP, Wasserman DH, Yamazaki S, Johnson CH. Circadian clock gene Bmal1 is not essential; functional replacement with its paralog, Bmal2. Curr Biol 2010; 20:316 - 21; http://dx.doi.org/10.1016/j.cub.2009.12.034; PMID: 20153195
- Izawa N, Wu W, Sato K, Nishikawa H, Kato A, Boku N, et al. HERC2 Interacts with Claspin and regulates DNA origin firing and replication fork progression. Cancer Res 2011; 71:5621 - 5; http://dx.doi.org/10.1158/0008-5472.CAN-11-0385; PMID: 21775519
- Zeng K, Bastos RN, Barr FA, Gruneberg U. Protein phosphatase 6 regulates mitotic spindle formation by controlling the T-loop phosphorylation state of Aurora A bound to its activator TPX2. J Cell Biol 2010; 191:1315 - 32; http://dx.doi.org/10.1083/jcb.201008106; PMID: 21187329
- Ma YN, Zhang X, Yu HC, Zhang JW. CTD small phosphatase like 2 (CTDSPL2) can increase ε- and γ-globin gene expression in K562 cells and CD34+ cells derived from umbilical cord blood. BMC Cell Biol 2010; 11:75; http://dx.doi.org/10.1186/1471-2121-11-75; PMID: 20932329
- Nakada S, Chen GI, Gingras AC, Durocher D. PP4 is a gamma H2AX phosphatase required for recovery from the DNA damage checkpoint. EMBO Rep 2008; 9:1019 - 26; http://dx.doi.org/10.1038/embor.2008.162; PMID: 18758438
- Falandry C, Fourel G, Galy V, Ristriani T, Horard B, Bensimon E, et al. CLLD8/KMT1F is a lysine methyltransferase that is important for chromosome segregation. J Biol Chem 2010; 285:20234 - 41; http://dx.doi.org/10.1074/jbc.M109.052399; PMID: 20404330
- Renvoisé B, Parker RL, Yang D, Bakowska JC, Hurley JH, Blackstone C. SPG20 protein spartin is recruited to midbodies by ESCRT-III protein Ist1 and participates in cytokinesis. Mol Biol Cell 2010; 21:3293 - 303; http://dx.doi.org/10.1091/mbc.E09-10-0879; PMID: 20719964
- Bhatt KV, Hu R, Spofford LS, Aplin AE. Mutant B-RAF signaling and cyclin D1 regulate Cks1/S-phase kinase-associated protein 2-mediated degradation of p27Kip1 in human melanoma cells. Oncogene 2007; 26:1056 - 66; http://dx.doi.org/10.1038/sj.onc.1209861; PMID: 16924241
- van Zon W, Ogink J, ter Riet B, Medema RH, te Riele H, Wolthuis RM. The APC/C recruits cyclin B1-Cdk1-Cks in prometaphase before D box recognition to control mitotic exit. J Cell Biol 2010; 190:587 - 602; http://dx.doi.org/10.1083/jcb.200912084; PMID: 20733055
- Wang Q, Li W, Zhang Y, Yuan X, Xu K, Yu J, et al. Androgen receptor regulates a distinct transcription program in androgen-independent prostate cancer. Cell 2009; 138:245 - 56; http://dx.doi.org/10.1016/j.cell.2009.04.056; PMID: 19632176
- Moshe Y, Bar-On O, Ganoth D, Hershko A. Regulation of the action of early mitotic inhibitor 1 on the anaphase-promoting complex/cyclosome by cyclin-dependent kinases. J Biol Chem 2011; 286:16647 - 57; http://dx.doi.org/10.1074/jbc.M111.223339; PMID: 21454540
- Shintomi K, Hirano T. Sister chromatid resolution: a cohesin releasing network and beyond. Chromosoma 2010; 119:459 - 67; http://dx.doi.org/10.1007/s00412-010-0271-z; PMID: 20352243
- Akiyama K, Kagawa S, Tamura T, Shimbara N, Takashina M, Kristensen P, et al. Replacement of proteasome subunits X and Y by LMP7 and LMP2 induced by interferon-gamma for acquirement of the functional diversity responsible for antigen processing. FEBS Lett 1994; 343:85 - 8; http://dx.doi.org/10.1016/0014-5793(94)80612-8; PMID: 8163024
- Mahalingam S, Ayyavoo V, Patel M, Kieber-Emmons T, Kao GD, Muschel RJ, et al. HIV-1 Vpr interacts with a human 34-kDa mov34 homologue, a cellular factor linked to the G2/M phase transition of the mammalian cell cycle. Proc Natl Acad Sci USA 1998; 95:3419 - 24; http://dx.doi.org/10.1073/pnas.95.7.3419; PMID: 9520381