Abstract
Reducing activity of the mTORC1/S6K1 pathway has been shown to extend lifespan in both vertebrate and invertebrate models. For instance, both pharmacological inhibition of mTORC1 with the drug rapamycin or S6K1 knockout extends lifespan in mice. Since studies with invertebrate models suggest that reducing translational activity can increase lifespan, we reasoned that the benefits of decreased mTORC1 or S6K1 activity might be due, at least in part, to a reduction of general translational activity. Here, we report that mice given a single dose of rapamycin have reduced translational activity, while mice receiving multiple injections of rapamycin over 4 weeks show no difference in translational activity compared with vehicle-injected controls. Furthermore, mice lacking S6K1 have no difference in global translational activity compared with wild-type littermates as measured by the percentage of ribosomes that are active in multiple tissues. Translational activity is reduced in S6K1-knockout mice following single injection of rapamycin, demonstrating that rapamycin’s effects on translation can occur independently of S6K1. Taken together, these data suggest that benefits of chronic rapamycin treatment or lack of S6K1 are dissociable from potential benefits of reduced translational activity, instead pointing to a model whereby changes in translation of specific subsets of mRNAs and/or translation-independent effects of reduced mTOR signaling underlie the longevity benefits.
Introduction
Reducing activity of the target of rapamycin complex I (TORC1, mTORC1 in mammals) has been shown to benefit lifespan in a range of model organisms, such as yeast, nematodes, flies, and mice.Citation1,Citation2 Furthermore, mTOR has emerged as a potential target for therapies for age-related diseases such as cardiac hypertrophy,Citation3 cancer,Citation4,Citation5 age-related macular degeneration,Citation6 and neurodegenerative diseases such as Alzheimer, Parkinson, and Huntington.Citation7 Rapamycin suppresses accelerated,Citation8 physiological,Citation9,Citation10 and oncogene-inducedCitation11,Citation12 senescence in human and rodent cells, which may explain anti-aging effects seen in mammals. In addition, deletion of the mTORC1 substrate S6K1, one of two mammalian S6 kinases, and its invertebrate orthologs have also been shown to increase lifespan in invertebrate and mouse models of aging.Citation13-Citation16 Given the variety of model organisms where beneficial effects have been observed, these data suggest that disrupting the mTORC1 pathway may enhance human longevity and alleviate age-related diseases, thereby extending healthspan as well.
mTORC1 signaling is known to promote translation initiation. Mammalian TORC1 stimulates translational activity by phosphorylating two targets, eif4E binding protein (4EBP) and S6K.Citation17 Phosphorylation of 4EBP by mTORC1 releases 4EBP from initiation factor eiF4E, allowing eiF4E to facilitate the addition of ribosomes to mRNA.Citation18-Citation20 Additionally, active TORC1 phosphorylates and activates S6K1 in mammalian cells,Citation21 which, in turn, phosphorylates several targets, including the ribosomal protein S6, eIF4B, and eEF2 kinase.Citation22 However, there has been some controversy as to the contribution of S6K activity to translation.Citation23-Citation25 For example, while phosphorylation of S6 correlates with translation activity, translation is not reduced when phosphorylation of S6 is prevented.Citation26
Evidence in invertebrates suggests that the process of protein translation is linked to lifespan regulation. In C. elegans, RNAi against genes involved in translation initiation have been reported to increase lifespan. In addition to orthologs of mTOR and S6K1, these genes include orthologs of eIF4G, eIF2B, and eIF4E.Citation13,Citation14,Citation27 Additional genetic screens in C. elegans focusing on genes required for development also identified homologs of eIF2G, eIF3F, and eIF4A.Citation28,Citation29 Ribosomes themselves may regulate lifespan; in both yeast and C. elegans, reduced expression of genes encoding ribosomal proteins leads to lifespan extension.Citation13,Citation28,Citation30-Citation33 When 300 genes that regulate lifespan in C. elegans were examined in yeast, a number statistically greater than chance of these genes were found to regulate lifespan in yeast as well. Among the 25 genes identified, 8 were shown to regulate aspects of translation, including yeast orthologs of eIF4A and eIF4G.Citation34 Given the evolutionary distance between these two organisms, these data suggest that the regulation of translation may couple to longevity in an evolutionarily conserved manner.
Reducing TORC1/S6K1 signaling or reducing translational activity can each extend lifespan in invertebrate models. Since the inhibition of mTORC1 with rapamycin or a lack of S6K1 can extend lifespan in mice,Citation15,Citation29,Citation35,Citation36 we reasoned that this might be due to reduced translational activity. Since both mTORC1 and S6K1 activity can promote translation initiation, we hypothesized that mice treated with rapamycin or mice lacking S6K1 would have reduced ribosome activity compared with control mice. Here, we report that while a single dose of rapamycin reduces the portion of active ribosomes in liver and muscle tissue, mice chronically treated with multiple doses of rapamycin show no change in ribosome activity. Furthermore, liver and muscle tissue from S6K1−/− mice have normal ribosomal activity. Thus, while both chronic treatment with rapamycin and knockout of S6K1 can extend lifespan in mice, they appear do so without altering ribosome activity.
Results
Polysome analysis allows quantification of translational activity in cells or tissues. When ribosomes are actively synthesizing protein, 40S subunits with associated initiation factors bind ribosomes and scan mRNA, pausing at the site of translation initiation. A 60S subunit then interacts with the 40S subunit initiation complex to initiate translation. Thus, assembled 80S ribosomes are associated with mRNA. As translational activity increases, additional ribosomes are loaded onto the mRNA. When a tissue sample is treated with cycloheximide, translational activity ceases, and actively translating ribosomes are locked into place on mRNA. After sedimentation on a sucrose gradient, mRNAs are fractionated according to the number of ribosomes bound to the mRNA. Under these conditions, the high salt concentrations prevent formation of inactive 80S couples by the free ribosome subunits. When absorbance at 254 nm is measured from top to bottom of the gradient, it creates a polysome profile that shows different ribosomal subunit and polysome peaks (). These peaks are quantified by taking the ratio of the area under each peak to the total area under all ribosome peaks. When translational activity is reduced in a tissue, fewer ribosomes will be loaded onto mRNA, resulting in higher levels of free 40S and 60S subunits and lower levels of mRNA-bound polysomes.
Figure 1. Acute treatment with rapamycin alters polysome profile in mouse liver tissue. (A) Example liver polysome profile. Polysome gradients contain peaks representing an insoluble fraction, free ribosome subunits (40s and 60S), and active ribosomes (R) separated by the amount of ribosomes tethered to mRNA. (B) Acute rapamycin treatment involved a single injection of vehicle or rapamycin (8 mg/kg). Tissue was harvested 1 h after injection. (C and D) representative liver polysome profiles from vehicle (C) and rapamycin (D) treated mice. Arrows indicate 40 and 60S peaks. (E) Quantification of polysome peaks from vehicle and rapamycin-treated liver tissue. *P < 0.05; 2-way ANOVA, Bonferroni post hoc test. For both groups, n = 8.
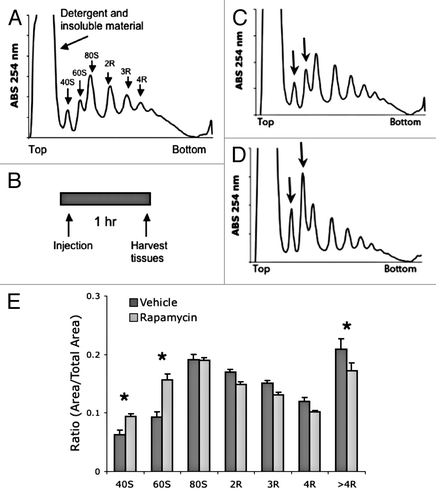
We initially examined translation in liver tissue for two reasons: first, liver has a high portion of active ribosomes compared with other tissues and, second, liver shares functions with invertebrate fat bodies, a tissue that plays a role in the regulation of lifespan.Citation37,Citation38 We injected mice with rapamycin (8 mg/kg i.p.) or vehicle control, and tissues were harvested 1 h after injection (). Polysome analysis of liver tissue demonstrated a significant increase in free ribosomal subunits and a significant decrease in polysomes consisting of four or more ribosomes (). Further experiments demonstrated that rapamycin reduced translation initiation activity most robustly at 1 h following injection, with translational activity recovering by 6 h post injection (Fig. S1). These results are consistent with reports that inhibiting mTORC1 reduces translation initiation.
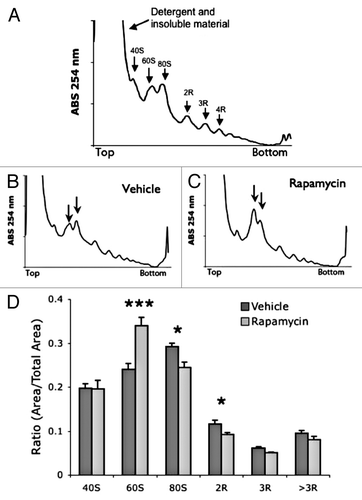
To verify that the effects of rapamycin are not specific to liver tissue, we examined muscle tissue polysomes (). Injection of rapamycin increased levels of free 60S ribosomal subunits and significantly decreased active 80S and 2R peaks (). As with the liver, the increased levels of inactive subunits coupled with the decreased levels of active monomer and dimer polysome peaks suggested a reduction in global translation initiation. These data demonstrate that the reduction of protein synthesis by single injection of rapamycin occurs in multiple tissues.
Figure 2. Acute treatment with rapamycin alters polysome profile in mouse muscle tissue. (A) Example muscle polysome profile. (B and C) representative muscle polysome profiles from vehicle (B) and rapamycin (C) treated mice. Arrows indicate 60S and 80S peaks. (D) Quantification of polysome peaks from vehicle and rapamycin-treated liver tissue. ***P < 0.001; *P < 0.05; 2-way ANOVA, Bonferroni post hoc test. For both groups, n = 6.
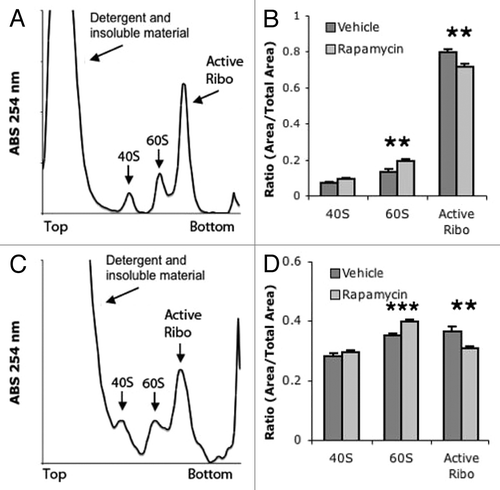
In order to confirm that a single dose of rapamycin reduces the activity of ribosomes in vivo, liver samples were analyzed with ARA. The ARA takes advantage of the fact that high salt contractions inhibit the formation of 80S inactive monosomes.Citation39 This assay involves applying low levels of RNase to ribosome-bound, mRNA-degrading exposed stretches of mRNA that are not bound to ribosomes. Following this treatment, sedimenting these samples in a sucrose gradient will result in three peaks; two inactive peaks corresponding to 40S and 60S, and an 80S peak representing ribosomes that were bound to RNA and thus actively translating (). Acute rapamycin treatment significantly reduces the number of active ribosomes in mouse liver, from 79% of active ribosomes in the vehicle-injected group compared with 71% of active ribosomes in rapamycin-treated livers (). While muscle tissue has a less active ribosome profile, rapamycin treatment still resulted in a significant reduction of active ribosomes in muscle; 36.6% of ribosomes were active in muscle from vehicle-treated muscle compared with 30.7% of active rapamycin-treated ribosomes (). These results are consistent with previous reports that rapamycin reduces, but not eliminates, translational activity in tissue.
Figure 3. ARA demonstrates that acute rapamycin reduces ribosome activity. (A) Example liver ARA profile. Unlike polysome gradients, active ribosomes are combined into a single peak. (B) Quantification of liver ARA from vehicle and rapamycin-treated mice. (C) Example muscle ARA profile. (D) Quantification of muscle ARA from vehicle and rapamycin-treated mice. ***P < 0.001; **P < 0.05; 2-way ANOVA, Bonferroni post hoc test. For all groups, n = 6.
Long-term rapamycin treatment has been shown to increase lifespan in several model systems,Citation1 including mice.Citation26 Furthermore, long-term rapamycin treatment has been shown to ameliorate pathology in several mouse models of disease, including some cancer models, neurodegenerative disease models, and models of muscular disease.Citation1 In our lab, chronic rapamycin treatment increases lifespan and reduces severity of heart and muscle defects in a Lmna−/− mouse model of muscular dystrophy and dilated cardiomyopathy.Citation3 In order to see if reduced translation initiation activity might contribute to the benefits of long-term rapamycin treatment, we injected mice with 8 mg/kg rapamycin every other day for 4 wk (). This regimen reduces cardiac abnormalities and muscle weakness in the Lmna−/− mice, demonstrating that this regimen is physiologically relevant to disease models.
Figure 4. Chronic treatment with rapamycin does not alter polysome profiles in mouse tissue. (A) Chronic treatment involved an injection every 48 h with vehicle or rapamycin. Tissue was collected 1 h after the final injection. (B and C) representative liver polysome profiles from vehicle (B) and rapamycin (C) treated mice. (D) Quantification of polysome peaks from vehicle and rapamycin-treated liver tissue. (E and F) representative muscle polysome profiles from vehicle (E) and rapamycin (F) treated mice. (G) Quantification of polysome peaks from vehicle and rapamycin-treated liver tissue. For all groups, n = 8.
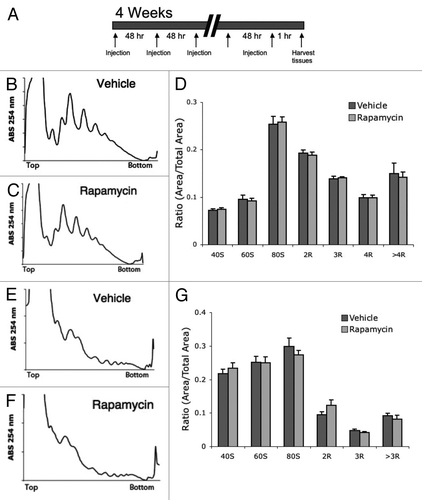
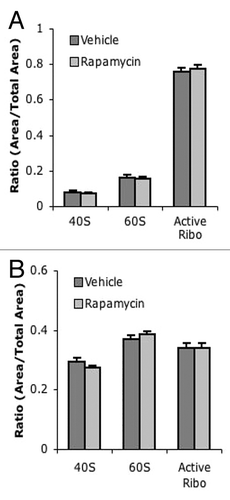
Surprisingly, liver tissue harvested 1 h after the final injection of rapamycin had similar polysome profiles to liver from vehicle-injected mice (). Furthermore, no significant difference was observed in any polysome peak between rapamycin and vehicle-treated liver (). Similarly, no difference was seen between polysome profiles in muscle tissue between mice chronically treated with rapamycin or with vehicle (). These results were confirmed with ARA; no difference was observed in levels of free or active ribosome peaks between vehicle- and rapamycin-treated liver () or muscle (). These data suggest that while rapamycin treatment can initially reduce translational activity in vivo, chronic treatment with rapamycin does not continue to suppress translational activity.
Figure 5. No difference in ARA profiles between chronic vehicle and rapamycin-injected mice. (A) Quantification of liver ARA from chronically vehicle and rapamycin-treated mice. (B) Quantification of muscle ARA from chronically treated vehicle and rapamycin-treated mice. For all groups, n = 6.
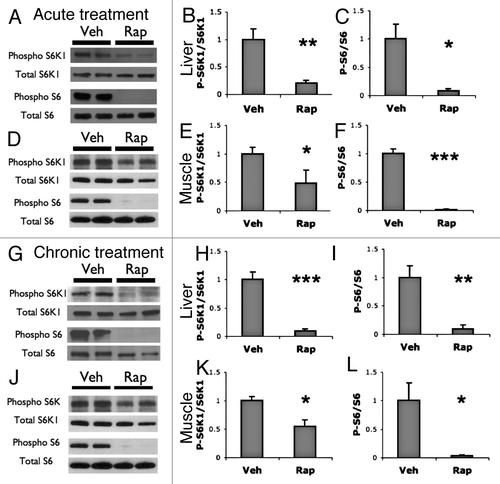
Since a single treatment of rapamycin reduced translation, but multiple treatments did not, we sought to verify that chronic treatment with rapamycin still inhibits mTORC1 using western blot analysis. We assessed liver and muscle tissues for levels of phospho-S6K1 and phospho-S6 following acute or chronic treatments with rapamycin. A single dose of rapamycin reduced the ratio of phospho-S6K1 to total S6K1 protein and phospho-S6 to total S6 protein in both liver and muscle tissue (). Similarly, phospho-S6K1 and phospho-S6 levels were reduced in liver and muscle tissue collected 1 h after the final injection following 4 weeks of treatment (). Thus, while translational activity resembles the vehicle treatment following chronic rapamycin treatment, the chronic treatment is sufficient to sustain reduced phosphorylation of the mTORC1 target S6K1 and its downstream target S6.
Figure 6. Acute and chronic rapamycin treatments reduce levels of phospho S6K1 and phospho S6. (A– C) Western blot analysis of liver following acute treatment with vehicle or rapamycin. (A) Representative blots showing westerns against phospho-S6K1 (T389) and total S6K1 and phospho-S6 (S240/S244) in vehicle (Veh) or rapamycin (Rap) treated liver. (B) Quantification of phospho-S6K1 to total S6K1. (C) Quantification of phospho-S6 to total S6. (D–F) western blot analysis of muscle following acute treatment with vehicle or rapamycin. (D) Representative blots (E) Quantification of phospho S6K1 to total S6K1. (F) Quantification of phospho-S6 to total S6. (G–I) Western analysis of liver following chronic treatment with vehicle or rapamycin. (G) Representative blots. (H) Quantification of phospho S6K1 to total S6K1. (I) Quantification of phospho-S6 to total S6. (J–L) Western analysis of muscle following chronic treatment with vehicle or rapamycin. (G) Representative blots. (E) Quantification of phospho S6K1 to total S6K1. (F) Quantification of phospho-S6 to total S6. T-test was used to compare Veh to Rap: *P < 0.05; **P < 0.01; ***P < 0.001. For all experiments n = 4 samples per group.
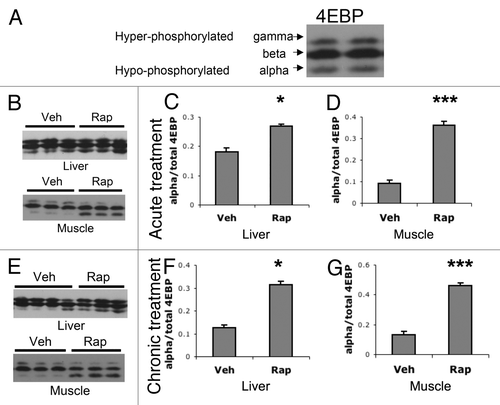
It has been proposed that mTORC1’s targets may be differentially affected by rapamycin.Citation40 For example, when cells are exposed to rapamycin, levels of phospho-4EBP recover to baseline before levels of phospho-S6K1.Citation41 If mTORC1’s ability to target 4EBP recovered under chronic treatment conditions, this could explain why chronic rapamycin treatment did not alter ribosome activity. To test this, we examined 4EBP following acute and chronic rapamycin treatment. On a western blot, 4EBP shows 3 bands. The high weight (gamma) and middle (β) bands correspond to phosphorylated 4EBP, and the low weight (α) band corresponds to hypo-phosphorylated 4EBPCitation42,Citation43 (). A single injection of rapamycin significantly increased intensity of the α 4EBP band in liver () and muscle tissues (). Chronic treatment of rapamycin also resulted in increased signal of the hypo-phosphorylated α band in liver () and muscle tissues (). These results suggest that chronic treatment of multiple rapamycin injections sustains the inhibition of mTORC1 phosphorylation of 4EBP.
Figure 7. Acute and chronic rapamycin treatments increase levels of hypo-phosphorylated 4EBP. (A) western blots of 4EBP show 3 bands, hyperphosphorylated high weight (gamma) and middle (beta) bands, and a lower weight hypo-phosphorylated (alpha) band. (B–D) Western blot analysis of liver and muscle following acute treatment with vehicle or rapamycin. (B) Representative western blots of liver and muscle tissues following acute vehicle (Veh) or rapamycin (Rap) treatment. (C) Quantification of the ratio of hypo-phosphorylated alpha band of 4EBP over the total 4EBP bands in liver tissue. (D) Quantification of the ratio of alpha to total 4EBP bands in muscle tissue. (E–G) western blot analysis of liver and muscle following chronic treatment with vehicle or rapamycin. (E) Representative western blots of liver and muscle tissues following chronic vehicle or rapamycin treatment. (F) Quantification of the ratio of alpha to total 4EBP bands in liver tissue following chronic treatments. (G) Quantification of the ratio of alpha to total 4EBP bands in liver tissue following chronic treatments. T-test was used to compare Veh to Rap: *P < 0.05; **P < 0.01; ***P < 0.001. For all acute treated groups, n = 8. For all chronic vehicle groups, n = 8. For chronic rapamycin groups, n = 6.
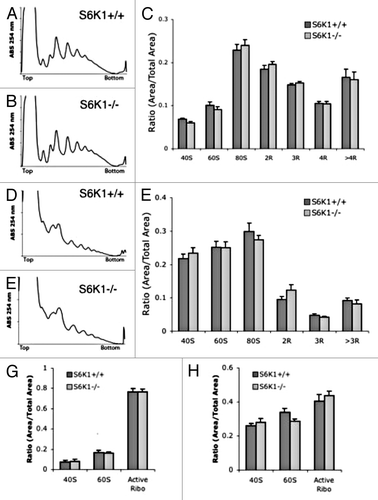
Since rapamycin treatment reduces mTORC1 phosphorylation of S6K1 and the subsequent phosphorylation of S6 by S6K1, we sought to see if mice lacking S6K1 had altered translational activity. S6K1-/- mice have enhanced lifespan compared with wild-type littermates,Citation15 suggesting that the resultant decrease of S6K1 activity from mTORC1 inhibition contributes to rapamycin’s effects on longevity. Since both the acute and chronic rapamycin treatments reduced levels of phospho-S6K1 and since both treatments reduced levels of phospho-S6, a kinase target of S6K1, we tested if a lack of S6K1 results in reduced translational activity in mice. Previous work has demonstrated that mouse embryonic fibroblasts lacking S6K1 have normal polysome profiles,Citation44 but cultured fibroblasts do not necessarily reflect conditions of adult tissues, particularly conditions that may enhance lifespan. We compared liver and muscle tissue from S6K1-/- and wild-type S6K1+/+ littermates, but observed no significant difference in polysome profiles of liver () or muscle (). In agreement with these data, no significant difference between S6K1-/- and S6K1+/+ littermates in ARA of liver () or muscle tissue () were detected.
Figure 8.S6K1−/− mice do not have altered polysome profiles. (A and B) representitive liver polysome profiles from S6K1+/+ mice (A) and S6K1−/− mice (B). (C) Quantification of polysome peaks from S6K1+/ + mice and S6K1−/− liver tissue. For both groups, n = 10. (D and E) representative muscle polysome profiles from S6K1+/+ mice (D) and S6K1−/− mice (E). (F) Quantification of polysome peaks from S6K1+/+ mice and S6K1−/− liver tissue. (G and H) No difference in ARA profiles between chronic vehicle and rapamycin-injected mice. (G) Quantification of liver ARA from S6K1+/+ mice and S6K1−/− mice. (H) Quantification of muscle ARA from S6K1+/+ mice and S6K1−/− mice. For all groups, n = 6.
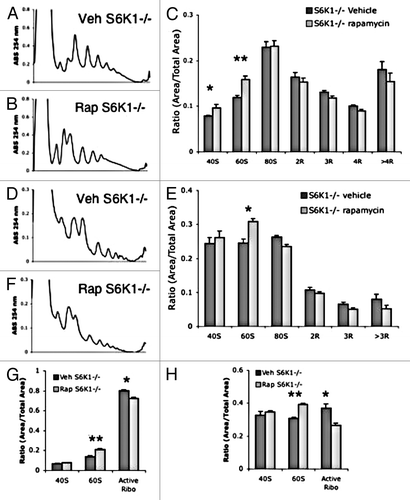
Since long-lived S6K1-/- mice lack S6K1 during their entire lifespan, including development, it is possible that compensation occurs reducing the contribution of mTOR signaling to translation in adult tissues. To test this, we injected adult S6K1-/- mice with a single dose of either vehicle or rapamycin. Analysis of polysomes showed a significant increase of free ribosomal subunits in liver () and muscle tissue (). In support of these data, ARA analysis showed a significant decrease in active ribosomes following rapamycin treatment in liver () and muscle (). These data demonstrate that a single dose rapamycin can reduce general translation activity independently of S6K1 activity.
Figure 9. Acute rapamycin treatment reduces translation in S6K1−/− mice. (A and B) representative liver polysome profiles from S6K1+/+ mice (A) and S6K1−/− mice (B). (C) Quantification of polysome peaks from S6K1+/+ mice and S6K1−/− liver tissue, vehicle n = 6, rapamycin n = 5. (D and E) representative muscle polysome profiles from S6K1+/+ mice (D) and S6K1−/− mice (E). (F) Quantification of polysome peaks from S6K1+/+ mice and S6K1−/− liver tissue, for both groups n = 6.. (G and H) ARA profiles between chronic vehicle and rapamycin-injected mice. (G) Quantification of liver ARA from S6K1+/+ mice and S6K1−/− mice. (H) Quantification of muscle ARA from S6K1+/+ mice and S6K1−/− mice. For all groups, n = 6. **P < 0.01; *P < 0.05; 2-way ANOVA, Bonferroni post hoc test.
Discussion
Both chronic treatment with the drug rapamycin or knockout of its downstream target S6K1 extend lifespan in mice.Citation15,Citation26 Here we demonstrate that a single dose of rapamycin results in reduced ribosome activity in liver and muscle tissue, as measured by polysome and ARA analysis. However, multiple injections of the same dose of rapamycin over 4 weeks fail to reduce ribosome activity in these same tissues. Western blot analysis showed that both single and multiple injections of rapamycin led to decreased levels of phospho-S6K1 and phospho-S6, suggesting that the drug was active in both groups. Furthermore, mice lacking S6K1 show no difference in polysome profiles compared with wild-type littermates. Since both chronic rapamycin treatment and lack of S6K1 can increase lifespan in mice,Citation15,Citation26 these data suggest that these interventions may benefit lifespan in a manner that is independent from overall changes in translation levels.
This is not to say that lack of S6K1 or chronic rapamycin treatment does not affect translation. While we fail to see a change in polysome profiles of mice treated chronically with rapamycin compared with vehicle-injected controls or in mice lacking S6K1, we cannot rule out more subtle changes in translational activity. Polysome and ARA indicate the overall rates of ribosome activity but cannot account for the translation of specific mRNAs. Some mRNAs have been reported to be particularly sensitive to mTORC1 signaling. For example, mRNAs containing an oligopyrimidine tract in the 5′ untranslated region of their mRNA (5′TOP mRNAs) are translated faster in response to mTORC1 activation than other mRNAs.Citation45,Citation46 Conversely, the translation of specific mRNAs can be actively inhibited by mTORC1 activity; one example is the translation of the voltage-gated potassium channel KV1.1.Citation47 Thus, while we can conclude that the global rates of ribosome activity are similar in chronically rapamycin-treated and S6K1-/- mice compared with controls, we cannot rule out subtle changes in translational activity on the level of specific mRNAs.
Experiments that demonstrated rapamycin extends lifespan in mice delivered rapamycin orally by mixing it with mouse chow that was available ad libitum.Citation26 Thus, rapamycin intake occurred slowly and varied from mouse to mouse with feeding behavior. For this study, we delivered rapamycin at 8 mg/kg I.P. This method has the advantage of having a defined dose and time point to examine acute effects of the drug (Fig. S1) This allowed for specific comparisons of the effects of rapamycin between the first injection and the last of multiple injections. Repeated I.P. injections of rapamycin have been shown to benefit rodent models of disease, including cardiac hypertrophy,Citation48 cancer,Citation49,Citation50 autoimmune disease,Citation29 and neurodegeneration,Citation51,Citation52 suggesting that repeated injections of rapamycin is physiologically relevant to the treatment of disease models. These studies used doses of rapamycin ranging from 2 mg/kg to 20 mg/kg; the dose of rapamycin used in our study fell within this range.
We focused on translational activity of liver and skeletal muscle tissue, because they are both translationally active, and because they may be relevant to the regulation of lifespan. Liver polysomes have long been used to study how ribosome activity responds to different conditions, including diet and stress. The liver shares functions with the fat body in Drosophila, and genetic manipulation specific to the fat body can be sufficient to extend lifespan.Citation37,Citation38 For example, specifically reducing Drosophila (dTOR) activity by selectively expressing dTOR mutants or overexpressing TSC1 or TSC2 selectively in fat bodies extends mean lifespan by 20%.Citation38 These data suggest that liver could play a role in the regulation of mammalian lifespan, and that mTORC1 signaling could be relevant to this role. In a similar vein, skeletal muscle may also be relevant to regulation of lifespan. Muscle undergoes cellular stress with aging that can be reduced by calorie restriction,Citation53 suggesting that muscle tissue can respond to interventions that regulate lifespan. Furthermore, overexpression of the gene PEPCK-C selectively in skeletal muscle increases lifespan in mice by 20%,Citation54 demonstrating that manipulation of muscle tissue can be sufficient to influence longevity in mammals.
Our results suggest that S6K1 does not mediate mTORC1’s effects on translation. Levels of phospho-S6K1 and phospho-S6 are reduced after a single dose of rapamycin (), where we detect a decrease in ribosome activity by polysome analysis and by ARA (–). However, under chronic rapamycin treatment, where we see no reduction in ribosome activity ( and ), we still observe decreased levels of phospho-S6K1 and phospho-S6 (). This dissociates rapamycin’s ability to inhibit S6K1 activity with its ability to reduce ribosome activity. Furthermore, lack of S6K1 is not sufficient to reduce ribosome activity (), nor is lack of S6K1 sufficient to prevent acute rapamycin from reducing translation (). While previous work has shown that cultured mouse embryonic fibroblasts lacking S6K1 do not have altered polysome profiles,Citation44 polysome profiles had not been examined from tissues in the adult S6K1-/- mice. Together, these results suggest that S6K1 does not mediate mTORC1’s effects on global translation activity.
Rapamycin is an allosteric inhibitor of mTORC1, promoting binding between mTOR and the protein FKB12. Since rapamycin inhibits mTORC1 by forming a trimeric complex, as opposed to directly inhibiting mTOR’s kinase activity, it has been proposed that mTORC1’s targets may be differentially affected by rapamycin.Citation40 For example, when cells are exposed to rapamycin, levels of phospho-4EBP recover to baseline before levels of phospho-S6K1.Citation41 Additionally, kinases other than mTOR can phosphorylate 4EBP and promote translation, such as ERK/MAPK and MNK.Citation3 Our observation that 4EBP hypo-phosphorylation is increased by acute and chronic rapamycin treatments () suggests that the recovery of translational activity seen following chronic treatment of rapamycin is not explained by recovery of 4EBP activity.
Our results may shed light on seemingly disparate findings regarding rapamycin’s effects on the brain. For example, it is well established that when rodents learn, the formation of a stable memory can be disrupted by drugs that inhibit protein synthesis. This is the case with rapamycin, which has been shown to disrupt the formation of several kinds of long-term memory.Citation55,Citation56 However, long-term rapamycin treatment can also slow disease progression in several rodent models of neurodegenerationCitation51,Citation57 and even improve memory in mouse models of Alzheimer disease.Citation58 Our results suggest that the single dose might disrupt memory by interfering with the synthesis of new proteins, but that the long-term rapamycin treatment might spare the protein synthesis activity required for memory while upregulating beneficial processes such as autophagy.Citation57,Citation58
The regulation of translation has been implicated in longevity. Since rapamycin treatment and S6K1 knockout can extend lifespan in mice, we hypothesized that targeting this pathway in mice would result in reduced translational activity. Here, we report that while a single dose of rapamycin reduces general translation activity in liver and muscle tissue, mice chronically treated with multiple doses of rapamycin show no change in overall translation profiles. Similarly, S6K1-/- mice do not have altered polysome profiles. These results indicate a dissociation between the regulation of global translational activity by mTOR and the enhancement of longevity by rapamycin.
Materials and Methods
Animals
Experiments were in accordance with and approved by the animal care committee's guidelines at the University of Washington. C57BL/6 mice were obtained from Charles River. Mice had free access to food and water and were kept on a 12h/12h light/dark (6 AM/6 PM) cycle at a temperature of 25 °C. S6K1-knockout miceCitation21 were obtained from the lab of George Thomas and were backcrossed into a C57BL6 background. Mice were sacrificed by cervical dislocation, and tissue was flash frozen with dry ice. While we did not observe effects of circadian rhythm on liver polysomes when tissue was collected at different times (data not shown), all injections and tissue collections were performed at the same time each day to avoid any complications from circadian rhythms. For polysome and western experiments, liver tissue was collected from the left lobe, and right and left gastrocnemius were collected for analyzing muscle. Tissue was stored at −80 °C.
Polysome analysis
Tissue homogenates were sedimented through sucrose gradients containing high concentrations of salt to prevent the formation of inactive 80S subunit couples. Gradients were collected from the top with an ISCO fractionator system. Absorption was measured at 254 nM. The data were digitally recorded with a DI-148U data acquisition starter kit (Dataq) using WinDaq software. Polysome profiles were quantified by collecting the area under the peaks corresponding to 40S, 60S, 80S, and polysome peaks and dividing them by the total area under all of the peaks.
We modified existing liver polysome protocols.Citation59,Citation60 Frozen liver tissue was homogenized in a 2 ml dounce homogenenzer in 1.5 mM KCl, 2.5 mM MgCl2, 5 mM Tris, pH 7.5, 1% Triton X-100 and 1% sodium deoxycholate. Samples were spun at 2500 g for 15 min at 4 °C and the supernatant was collected. Heparin and cycloheximide were added to each sample to a final concentration of 1 mg/ml and 100 mg/ml, respectively. Cycloheximide was added to prevent ribosomes from dissociating from mRNA. Samples were then spun at 16000 g for 10 min at 4 °C. Supernatant was collected and optical density was measured at 260 nM. The samples were adjusted to 20 OD260 in 1 ml of homogenization buffer, which was loaded onto a 10.8 ml linear 7–47% sucrose gradient in 0.8 M KCl, 15 mM MgCl2, 50 mM Tris, pH 7.5 0.5 mg/ml heparin, and 50 mg/ml cycloheximide. Samples were sedimented in an SW41 Ti rotor (Beckman) at 39000 rpm at 4 °C for 2 h.
The muscle polysomes were performed with a modified protocol.Citation61,Citation62 Frozen gastrocnemious muscle was minced with a razor blade on dry ice and homogenized with a Dounce homogenizer in homogenization buffer composed of 50 mM Hepes, pH 7.4, 250 mM sucrose, 250 mM KCl, 5 mM MgCl2, 2 mM DTT, 0.1 mg/ml cycloheximide, and 400 units/ml Riboock (Frementas). Samples sat on ice for 5 min, at which point Tween-20 and sodium deoxycholate were added to each sample to a final concentration of 0.56% Tween 20 and 0.27% deoxycholate. Samples were kept at 4 °C for 15 min with periodic vortex mixing. Samples were then spun at 3000 g for 5 min. Supernatant was collected and optical density at 260 nM was measured. The samples were adjusted to 15 OD260 in 1 ml homogenization and applied to a 10.8 ml linear 15–60% sucrose gradient in 100 mM Tris, pH 7.4, 200 mM KCl, 30 mM MgCl2, 200 μg/ml cycloheximide and 2 mg/ml heparin. Samples were spun in an SW41 Ti rotor (Beckman) at 39000 rpm at 4 °C for 4 h.
Active ribosome analysis
Actively translating ribosomes can be quantitated by a brief treatment of polysome-containing lysates prepared as described above with low amounts of RNase.Citation39 This treatment degrades exposed stretches of mRNA that are not protected by ribosomes, while the subunits of actively translating ribosomes remain associated through binding to the mRNA fragment. Thus, all polysomes are reduced to a single peak of 80S monosomes when sedimented through a sucrose gradient. Sedimentation of the samples takes place on sucrose gradients in buffer containing high salt gradients, preventing free subunits from forming inactive couples. Three peaks are observed corresponding to 40S and 60S subunits and the 80S peak derived from actively translating ribosomes.
Muscle and liver tissues were prepared as they were for polysome analysis. Four OD260 of lysate in 100 ml of ice-cold homogenization buffer was treated for 2 min with 2 ml of 0.2 mg/ml RNase A (Qiagen) diluted in 250 mM TRIS-acetate, pH 7.0. The reactions were stopped by the addition of reactions were stopped by the addition of 32 ml 2 M KCl and 5 ml 20 mg/ml heparin. RNase-treated samples were sedimented through 4.8 ml 10–30% sucrose gradients in 0.8 M KCl, 15 mM MgCl2, 50 mM TRIS-HCl, pH7.5, 0.5 mg/ml heparin, and 50 mg/ml cycloheximide. Samples were sedimented in an SW50.1 Ti rotor (Beckman) at 45000 rpm at 4 °C for 2 h.
Western blot analysis
Frozen tissue was homogenized in a Dounce homogenizer in RIPA buffer (50 mM Tris, pH 7.4, 150 mM NaCl, 1% NP40, and 0.5% sodium deoxycholate) with 1 mM PMSF and 1:100 dilutions of Sigma Protease, Phosphatase 1 and Phosphatase 2 Inhibitor Cocktails. Protein concentrations were normalized with the Bradford protein assay. An equal volume of 2× Laemmli sample buffer was added to each sample and samples were heated at 95 °C for 5 min. For experiments examining S6K1 and S6, samples were loaded on TGX precast gels (Bio-Rad) for SDS-PAGE analysis. Proteins were then transferred to nitrocellulose membranes (Bio-Rad) and blocked in 5% BSA and 0.05% Tween-20 in TBS (TBST). Experiments investigating 4EBP were performed in a similar manner; however the samples were loaded on a 16 × 16 cm 15% SDS-PAGE gel to maximize separation of the bands. Primary antibodies were used at 1:1000 dilution overnight at 4 °C in 5% BSA in TBST. Primary antibodies included rabbit anti-phospho-S6K1 (T389), rabbit anti-S6K1, rabbit anti-phospho-S6, rabbit anti-S6, and rabbit 4EBP, all from Cell Signaling Technology. ECl Horseradish peroxidase-conjugated secondary antibodies (GE Healthcare) were used at room temperature for 3 h in 5% non-fat dried milk in TBST. Immunoblots staining for 4EBP were developed with ECL Prime Western Blotting Detection Reagent (GE Healthcare). All other immunoblots were developed using Super Signal west Pico Chemiluminescent Substrate (Thermo Scientific). When necessary, immunoblots were stripped in 25 mM glycine, pH 2, with 1% SDS for 1 h. Bands were visualized with Kodak Biomax Light film and digitized with a scanner calibrated to measure optical density. ImageJ was then used to measure the integrated optical density of bands.
Additional material
Download Zip (324 KB)Acknowledgments
The authors would like to thank members of the Ladiges lab in the Department of Comparative Medicine for their help and expertise in the maintenance of mouse colonies and members of the Kennedy lab for their advice and assistance with experimental approaches. These studies have been supported by NIA grants R01 AG033373 and R01 AG035336 to BKK. MGG was supported by NIH Training Grant T32AG000057.
Disclosure of Potential Conflicts of Interest
No potential conflicts of interest were disclosed.
Supplemental Materials
Supplemental materials may be found here: http://www.landesbioscience.com/journals/cc/article/25512
Refernces
- Johnson SC, Rabinovitch PS, Kaeberlein M. mTOR is a key modulator of ageing and age-related disease. Nature 2013; 493:338 - 45; http://dx.doi.org/10.1038/nature11861; PMID: 23325216
- Blagosklonny MV. An anti-aging drug today: from senescence-promoting genes to anti-aging pill. Drug Discov Today 2007; 12:218 - 24; http://dx.doi.org/10.1016/j.drudis.2007.01.004; PMID: 17331886
- Ramos FJ, Chen SC, Garelick MG, Dai DF, Liao CY, Schreiber KH, et al. Rapamycin reverses elevated mTORC1 signaling in lamin A/C-deficient mice, rescues cardiac and skeletal muscle function, and extends survival. Sci Transl Med 2012; 4:ra103; http://dx.doi.org/10.1126/scitranslmed.3003802; PMID: 22837538
- Shaw RJ, Cantley LC. Ras, PI(3)K and mTOR signalling controls tumour cell growth. Nature 2006; 441:424 - 30; http://dx.doi.org/10.1038/nature04869; PMID: 16724053
- Anisimov VN, Zabezhinski MA, Popovich IG, Piskunova TS, Semenchenko AV, Tyndyk ML, et al. Rapamycin extends maximal lifespan in cancer-prone mice. Am J Pathol 2010; 176:2092 - 7; http://dx.doi.org/10.2353/ajpath.2010.091050; PMID: 20363920
- Kolosova NG, Muraleva NA, Zhdankina AA, Stefanova NA, Fursova AZ, Blagosklonny MV. Prevention of age-related macular degeneration-like retinopathy by rapamycin in rats. Am J Pathol 2012; 181:472 - 7; http://dx.doi.org/10.1016/j.ajpath.2012.04.018; PMID: 22683466
- Garelick MG, Kennedy BK. TOR on the brain. Exp Gerontol 2011; 46:155 - 63; http://dx.doi.org/10.1016/j.exger.2010.08.030; PMID: 20849946
- Demidenko ZN, Zubova SG, Bukreeva EI, Pospelov VA, Pospelova TV, Blagosklonny MV. Rapamycin decelerates cellular senescence. Cell Cycle 2009; 8:1888 - 95; http://dx.doi.org/10.4161/cc.8.12.8606; PMID: 19471117
- Mercier I, Camacho J, Titchen K, Gonzales DM, Quann K, Bryant KG, et al. Caveolin-1 and accelerated host aging in the breast tumor microenvironment: chemoprevention with rapamycin, an mTOR inhibitor and anti-aging drug. Am J Pathol 2012; 181:278 - 93; http://dx.doi.org/10.1016/j.ajpath.2012.03.017; PMID: 22698676
- Leontieva OV, Blagosklonny MV. DNA damaging agents and p53 do not cause senescence in quiescent cells, while consecutive re-activation of mTOR is associated with conversion to senescence. Aging (Albany NY) 2010; 2:924 - 35; PMID: 21212465
- Kolesnichenko M, Hong L, Liao R, Vogt PK, Sun P. Attenuation of TORC1 signaling delays replicative and oncogenic RAS-induced senescence. Cell Cycle 2012; 11:2391 - 401; http://dx.doi.org/10.4161/cc.20683; PMID: 22627671
- Pospelova TV, Leontieva OV, Bykova TV, Zubova SG, Pospelov VA, Blagosklonny MV. Suppression of replicative senescence by rapamycin in rodent embryonic cells. Cell Cycle 2012; 11:2402 - 7; http://dx.doi.org/10.4161/cc.20882; PMID: 22672902
- Hansen M, Taubert S, Crawford D, Libina N, Lee SJ, Kenyon C. Lifespan extension by conditions that inhibit translation in Caenorhabditis elegans. Aging Cell 2007; 6:95 - 110; http://dx.doi.org/10.1111/j.1474-9726.2006.00267.x; PMID: 17266679
- Pan KZ, Palter JE, Rogers AN, Olsen A, Chen D, Lithgow GJ, et al. Inhibition of mRNA translation extends lifespan in Caenorhabditis elegans. Aging Cell 2007; 6:111 - 9; http://dx.doi.org/10.1111/j.1474-9726.2006.00266.x; PMID: 17266680
- Selman C, Tullet JM, Wieser D, Irvine E, Lingard SJ, Choudhury AI, et al. Ribosomal protein S6 kinase 1 signaling regulates mammalian life span. Science 2009; 326:140 - 4; http://dx.doi.org/10.1126/science.1177221; PMID: 19797661
- Demidenko ZN, Blagosklonny MV. Quantifying pharmacologic suppression of cellular senescence: prevention of cellular hypertrophy versus preservation of proliferative potential. Aging (Albany NY) 2009; 1:1008 - 16; PMID: 20157583
- Hay N, Sonenberg N. Upstream and downstream of mTOR. Genes Dev 2004; 18:1926 - 45; http://dx.doi.org/10.1101/gad.1212704; PMID: 15314020
- Brunn GJ, Hudson CC, Sekulić A, Williams JM, Hosoi H, Houghton PJ, et al. Phosphorylation of the translational repressor PHAS-I by the mammalian target of rapamycin. Science 1997; 277:99 - 101; http://dx.doi.org/10.1126/science.277.5322.99; PMID: 9204908
- Burnett PE, Barrow RK, Cohen NA, Snyder SH, Sabatini DM. RAFT1 phosphorylation of the translational regulators p70 S6 kinase and 4E-BP1. Proc Natl Acad Sci U S A 1998; 95:1432 - 7; http://dx.doi.org/10.1073/pnas.95.4.1432; PMID: 9465032
- Gingras AC, Gygi SP, Raught B, Polakiewicz RD, Abraham RT, Hoekstra MF, et al. Regulation of 4E-BP1 phosphorylation: a novel two-step mechanism. Genes Dev 1999; 13:1422 - 37; http://dx.doi.org/10.1101/gad.13.11.1422; PMID: 10364159
- Shima H, Pende M, Chen Y, Fumagalli S, Thomas G, Kozma SC. Disruption of the p70(s6k)/p85(s6k) gene reveals a small mouse phenotype and a new functional S6 kinase. EMBO J 1998; 17:6649 - 59; http://dx.doi.org/10.1093/emboj/17.22.6649; PMID: 9822608
- Ruvinsky I, Meyuhas O. Ribosomal protein S6 phosphorylation: from protein synthesis to cell size. Trends Biochem Sci 2006; 31:342 - 8; http://dx.doi.org/10.1016/j.tibs.2006.04.003; PMID: 16679021
- Tang H, Hornstein E, Stolovich M, Levy G, Livingstone M, Templeton D, et al. Amino acid-induced translation of TOP mRNAs is fully dependent on phosphatidylinositol 3-kinase-mediated signaling, is partially inhibited by rapamycin, and is independent of S6K1 and rpS6 phosphorylation. Mol Cell Biol 2001; 21:8671 - 83; http://dx.doi.org/10.1128/MCB.21.24.8671-8683.2001; PMID: 11713299
- Barth-Baus D, Stratton CA, Parrott L, Myerson H, Meyuhas O, Templeton DJ, et al. S6 phosphorylation-independent pathways regulate translation of 5′-terminal oligopyrimidine tract-containing mRNAs in differentiating hematopoietic cells. Nucleic Acids Res 2002; 30:1919 - 28; http://dx.doi.org/10.1093/nar/30.9.1919; PMID: 11972328
- Stolovich M, Tang H, Hornstein E, Levy G, Cohen R, Bae SS, et al. Transduction of growth or mitogenic signals into translational activation of TOP mRNAs is fully reliant on the phosphatidylinositol 3-kinase-mediated pathway but requires neither S6K1 nor rpS6 phosphorylation. Mol Cell Biol 2002; 22:8101 - 13; http://dx.doi.org/10.1128/MCB.22.23.8101-8113.2002; PMID: 12417714
- Ruvinsky I, Sharon N, Lerer T, Cohen H, Stolovich-Rain M, Nir T, et al. Ribosomal protein S6 phosphorylation is a determinant of cell size and glucose homeostasis. Genes Dev 2005; 19:2199 - 211; http://dx.doi.org/10.1101/gad.351605; PMID: 16166381
- Syntichaki P, Troulinaki K, Tavernarakis N. eIF4E function in somatic cells modulates ageing in Caenorhabditis elegans. Nature 2007; 445:922 - 6; http://dx.doi.org/10.1038/nature05603; PMID: 17277769
- Curran SP, Ruvkun G. Lifespan regulation by evolutionarily conserved genes essential for viability. PLoS Genet 2007; 3:e56; http://dx.doi.org/10.1371/journal.pgen.0030056; PMID: 17411345
- Chen C, Liu Y, Liu Y, Zheng P. mTOR regulation and therapeutic rejuvenation of aging hematopoietic stem cells. Sci Signal 2009; 2:ra75; http://dx.doi.org/10.1126/scisignal.2000559; PMID: 19934433
- Kaeberlein M, Powers RW 3rd, Steffen KK, Westman EA, Hu D, Dang N, et al. Regulation of yeast replicative life span by TOR and Sch9 in response to nutrients. Science 2005; 310:1193 - 6; http://dx.doi.org/10.1126/science.1115535; PMID: 16293764
- Chen D, Pan KZ, Palter JE, Kapahi P. Longevity determined by developmental arrest genes in Caenorhabditis elegans. Aging Cell 2007; 6:525 - 33; http://dx.doi.org/10.1111/j.1474-9726.2007.00305.x; PMID: 17521386
- Chiocchetti A, Zhou J, Zhu H, Karl T, Haubenreisser O, Rinnerthaler M, et al. Ribosomal proteins Rpl10 and Rps6 are potent regulators of yeast replicative life span. Exp Gerontol 2007; 42:275 - 86; http://dx.doi.org/10.1016/j.exger.2006.11.002; PMID: 17174052
- Steffen KK, MacKay VL, Kerr EO, Tsuchiya M, Hu D, Fox LA, et al. Yeast life span extension by depletion of 60s ribosomal subunits is mediated by Gcn4. Cell 2008; 133:292 - 302; http://dx.doi.org/10.1016/j.cell.2008.02.037; PMID: 18423200
- Smith ED, Tsuchiya M, Fox LA, Dang N, Hu D, Kerr EO, et al. Quantitative evidence for conserved longevity pathways between divergent eukaryotic species. Genome Res 2008; 18:564 - 70; http://dx.doi.org/10.1101/gr.074724.107; PMID: 18340043
- Harrison DE, Strong R, Sharp ZD, Nelson JF, Astle CM, Flurkey K, et al. Rapamycin fed late in life extends lifespan in genetically heterogeneous mice. Nature 2009; 460:392 - 5; PMID: 19587680
- Anisimov VN, Zabezhinski MA, Popovich IG, Piskunova TS, Semenchenko AV, Tyndyk ML, et al. Rapamycin increases lifespan and inhibits spontaneous tumorigenesis in inbred female mice. Cell Cycle 2011; 10:4230 - 6; http://dx.doi.org/10.4161/cc.10.24.18486; PMID: 22107964
- Giannakou ME, Goss M, Jünger MA, Hafen E, Leevers SJ, Partridge L. Long-lived Drosophila with overexpressed dFOXO in adult fat body. Science 2004; 305:361; http://dx.doi.org/10.1126/science.1098219; PMID: 15192154
- Kapahi P, Zid BM, Harper T, Koslover D, Sapin V, Benzer S. Regulation of lifespan in Drosophila by modulation of genes in the TOR signaling pathway. Curr Biol 2004; 14:885 - 90; http://dx.doi.org/10.1016/j.cub.2004.03.059; PMID: 15186745
- Martin TE. A simple general method to determine the proportion of active ribosomes in eukaryotic cells. Exp Cell Res 1973; 80:496 - 8; http://dx.doi.org/10.1016/0014-4827(73)90333-9; PMID: 4745392
- Choo AY, Blenis J. Not all substrates are treated equally: implications for mTOR, rapamycin-resistance and cancer therapy. Cell Cycle 2009; 8:567 - 72; http://dx.doi.org/10.4161/cc.8.4.7659; PMID: 19197153
- Choo AY, Yoon SO, Kim SG, Roux PP, Blenis J. Rapamycin differentially inhibits S6Ks and 4E-BP1 to mediate cell-type-specific repression of mRNA translation. Proc Natl Acad Sci U S A 2008; 105:17414 - 9; http://dx.doi.org/10.1073/pnas.0809136105; PMID: 18955708
- Schalm SS, Fingar DC, Sabatini DM, Blenis J. TOS motif-mediated raptor binding regulates 4E-BP1 multisite phosphorylation and function. Curr Biol 2003; 13:797 - 806; http://dx.doi.org/10.1016/S0960-9822(03)00329-4; PMID: 12747827
- Jiang YP, Ballou LM, Lin RZ. Rapamycin-insensitive regulation of 4e-BP1 in regenerating rat liver. J Biol Chem 2001; 276:10943 - 51; http://dx.doi.org/10.1074/jbc.M007758200; PMID: 11278364
- Pende M, Um SH, Mieulet V, Sticker M, Goss VL, Mestan J, et al. S6K1(-/-)/S6K2(-/-) mice exhibit perinatal lethality and rapamycin-sensitive 5′-terminal oligopyrimidine mRNA translation and reveal a mitogen-activated protein kinase-dependent S6 kinase pathway. Mol Cell Biol 2004; 24:3112 - 24; http://dx.doi.org/10.1128/MCB.24.8.3112-3124.2004; PMID: 15060135
- Jefferies HB, Reinhard C, Kozma SC, Thomas G. Rapamycin selectively represses translation of the “polypyrimidine tract” mRNA family. Proc Natl Acad Sci U S A 1994; 91:4441 - 5; http://dx.doi.org/10.1073/pnas.91.10.4441; PMID: 8183928
- Terada N, Patel HR, Takase K, Kohno K, Nairn AC, Gelfand EW. Rapamycin selectively inhibits translation of mRNAs encoding elongation factors and ribosomal proteins. Proc Natl Acad Sci U S A 1994; 91:11477 - 81; http://dx.doi.org/10.1073/pnas.91.24.11477; PMID: 7972087
- Raab-Graham KF, Haddick PC, Jan YN, Jan LY. Activity- and mTOR-dependent suppression of Kv1.1 channel mRNA translation in dendrites. Science 2006; 314:144 - 8; http://dx.doi.org/10.1126/science.1131693; PMID: 17023663
- Shioi T, McMullen JR, Tarnavski O, Converso K, Sherwood MC, Manning WJ, et al. Rapamycin attenuates load-induced cardiac hypertrophy in mice. Circulation 2003; 107:1664 - 70; http://dx.doi.org/10.1161/01.CIR.0000057979.36322.88; PMID: 12668503
- Scott KL, Kabbarah O, Liang MC, Ivanova E, Anagnostou V, Wu J, et al. GOLPH3 modulates mTOR signalling and rapamycin sensitivity in cancer. Nature 2009; 459:1085 - 90; http://dx.doi.org/10.1038/nature08109; PMID: 19553991
- Zhang W, Zhu J, Efferson CL, Ware C, Tammam J, Angagaw M, et al. Inhibition of tumor growth progression by antiandrogens and mTOR inhibitor in a Pten-deficient mouse model of prostate cancer. Cancer Res 2009; 69:7466 - 72; http://dx.doi.org/10.1158/0008-5472.CAN-08-4385; PMID: 19738074
- Malagelada C, Jin ZH, Greene LA. RTP801 is induced in Parkinson’s disease and mediates neuron death by inhibiting Akt phosphorylation/activation. J Neurosci 2008; 28:14363 - 71; http://dx.doi.org/10.1523/JNEUROSCI.3928-08.2008; PMID: 19118169
- Santini E, Heiman M, Greengard P, Valjent E, Fisone G. Inhibition of mTOR signaling in Parkinson’s disease prevents L-DOPA-induced dyskinesia. Sci Signal 2009; 2:ra36; http://dx.doi.org/10.1126/scisignal.2000308; PMID: 19622833
- Lee CK, Klopp RG, Weindruch R, Prolla TA. Gene expression profile of aging and its retardation by caloric restriction. Science 1999; 285:1390 - 3; http://dx.doi.org/10.1126/science.285.5432.1390; PMID: 10464095
- Hakimi P, Yang J, Casadesus G, Massillon D, Tolentino-Silva F, Nye CK, et al. Overexpression of the cytosolic form of phosphoenolpyruvate carboxykinase (GTP) in skeletal muscle repatterns energy metabolism in the mouse. J Biol Chem 2007; 282:32844 - 55; http://dx.doi.org/10.1074/jbc.M706127200; PMID: 17716967
- Dash PK, Orsi SA, Moore AN. Spatial memory formation and memory-enhancing effect of glucose involves activation of the tuberous sclerosis complex-Mammalian target of rapamycin pathway. J Neurosci 2006; 26:8048 - 56; http://dx.doi.org/10.1523/JNEUROSCI.0671-06.2006; PMID: 16885218
- Parsons RG, Gafford GM, Helmstetter FJ. Translational control via the mammalian target of rapamycin pathway is critical for the formation and stability of long-term fear memory in amygdala neurons. J Neurosci 2006; 26:12977 - 83; http://dx.doi.org/10.1523/JNEUROSCI.4209-06.2006; PMID: 17167087
- Ravikumar B, Vacher C, Berger Z, Davies JE, Luo S, Oroz LG, et al. Inhibition of mTOR induces autophagy and reduces toxicity of polyglutamine expansions in fly and mouse models of Huntington disease. Nat Genet 2004; 36:585 - 95; http://dx.doi.org/10.1038/ng1362; PMID: 15146184
- Caccamo A, Majumder S, Richardson A, Strong R, Oddo S. Molecular interplay between mammalian target of rapamycin (mTOR), amyloid-beta, and Tau: effects on cognitive impairments. J Biol Chem 2010; 285:13107 - 20; http://dx.doi.org/10.1074/jbc.M110.100420; PMID: 20178983
- Oliver ER, Saunders TL, Tarlé SA, Glaser T. Ribosomal protein L24 defect in belly spot and tail (Bst), a mouse Minute. Development 2004; 131:3907 - 20; http://dx.doi.org/10.1242/dev.01268; PMID: 15289434
- Martin BJ, Spicer SS. Ultrastructural features of cellular maturation and aging in human trophoblast. J Ultrastruct Res 1973; 43:133 - 49; http://dx.doi.org/10.1016/S0022-5320(73)90074-9; PMID: 4349958
- Zomzely CE, Roberts S, Gruber CP, Brown DM. Cerebral protein synthesis. II. Instability of cerebral messenger ribonucleic acid-ribosome complexes. J Biol Chem 1968; 243:5396 - 409; PMID: 5702052
- Williamson DL, Kubica N, Kimball SR, Jefferson LS. Exercise-induced alterations in extracellular signal-regulated kinase 1/2 and mammalian target of rapamycin (mTOR) signalling to regulatory mechanisms of mRNA translation in mouse muscle. J Physiol 2006; 573:497 - 510; http://dx.doi.org/10.1113/jphysiol.2005.103481; PMID: 16543272