
Abstract
Entry and progression through mitosis has traditionally been linked directly to the activity of cyclin-dependent kinase 1 (Cdk1). In this study we utilized low doses of the Cdk1-specific inhibitor, RO3306 from early G2 phase onwards. Addition of low doses of RO3306 in G2 phase induced minor chromosome congression and segregation defects. In contrast, mild doses of RO3306 during G2 phase resulted in cells entering an aberrant mitosis, with cells fragmenting centrosomes and failing to fully disassemble the nuclear envelope. Cells often underwent cytokinesis and metaphase simultaneously, despite the presence of an active spindle assembly checkpoint, which prevented degradation of cyclin B1 and securin, resulting in the random partitioning of whole chromosomes. This highly aberrant mitosis produced a significant increase in the proportion of viable polyploid cells present up to 3 days post-treatment. Furthermore, cells treated with medium doses of RO3306 were only able to reach the threshold of Cdk1 substrate phosphorylation required to initiate nuclear envelope breakdown, but failed to reach the levels of phosphorylation required to correctly complete pro-metaphase. Treatment with low doses of Okadaic acid, which primarily inhibits PP2A, rescued the mitotic defects and increased the number of cells that completed a normal mitosis. This supports the current model that PP2A is the primary phosphatase that counterbalances the activity of Cdk1 during mitosis. Taken together these results show that continuous and subtle disruption of Cdk1 activity from G2 phase onwards has deleterious consequences on mitotic progression by disrupting the balance between Cdk1 and PP2A.
Introduction
The decision to enter and progress through mitosis is critically linked with the activity of cyclin-dependent kinase 1 (Cdk1). During G2 phase, the levels of cyclin B1 rise rapidly, allowing the formation of cyclin B1/Cdk1 complexes.Citation1,Citation2 These complexes are held in an inactive state until mitotic entry by 2 inhibitory phosphorylations on Cdk1 (T14 and Y15).Citation3 Removal of these phosphorylations by the phosphatase Cdc25C activates Cdk1/cyclin B1, allowing it to phosphorylate over 300 target substrates, including those involved in chromosome condensation, nuclear envelope breakdown (NEVB), and cytoskeleton reorganization, all of which drives cells into mitosis.Citation4 The activity of Cdk1 is required until the metaphase-to-anaphase transition, with the spindle assembly checkpoint (SAC) maintaining Cdk1 activity until all chromosomes are correctly aligned at the metaphase plate and attached by their kinetochores to opposing spindle poles.Citation5 Satisfaction of the SAC removes its inhibitory pressure on the anaphase-promoting complex (APC), allowing the APC to target key mitotic substrates for degradation by the proteasome.Citation6,Citation7 These substrates include securin, which, when degraded, allows separation of sister chromatids, and cyclin B1, which inactivates Cdk1.
The recent discovery of specific Cdk1 inhibitors such as RO3306 (RO)Citation8,Citation9 have resulted in a number of studies that have looked at the consequences of Cdk1 inhibition on cell cycle progression. The majority of studies utilizing RO have used doses of 9–10 µM which, when given to interphase cells is sufficient to prevent mitotic entry, suggesting that this dose blocks the majority of Cdk1 activity.Citation8,Citation10,Citation11 When mitotic cells are exposed to comparable doses of Cdk1 inhibitors similar to RO, cells undergo a rapid mitotic exit.Citation8,Citation12 Wash-out of the Cdk1 inhibitor before significant cyclin B1 degradation,Citation13 or addition of the proteasome inhibitor MG132,Citation14 allows cells to return to metaphase, indicating that degradation controls the directionality of mitosis, with phosphorylation determining the mitotic state. Together these studies have advanced our understanding of how Cdk1 activity controls mitotic entry and exit.
Recent work from our and others’ laboratories have shown that inhibition of the phosphatase that dephosphorylates the substrates of Cdk1 is just as critical for mitotic entry and progression as Cdk1 itself. This primary counter-balancing phosphatase during mitotic entry in Xenopus and mammalian cells is PP2A bound with the B55 regulatory subunit.Citation15-Citation17 The inhibition of PP2A-B55 is controlled by Greatwall (Gwl) kinase through the phosphorylation of 2 small inhibitory proteins Arpp19 and α-Endosulfine (ENSA).Citation18-Citation20 We have previously shown that knockdown of human Gwl delays mitotic entry and results in cells undergoing increasingly aberrant mitoses that correlate with the level of Gwl knockdown and reduced level of Cdk1 substrate phosphorylation.Citation16 Simultaneous knockdown or chemical inhibition of PP2A restores Cdk1 substrate phosphorylation levels.Citation16,Citation20 Taken together, these results show that Gwl is required to ensure that during mitotic entry and progression, activity of Cdk1 is coordinated with the inhibition of PP2A, ensuring correct mitotic progression. However, it is not clear how or if cells respond to subtle changes in the balance between Cdk1 and PP2A during mitotic entry and progression. In this study, we have utilized low doses of the Cdk1-specific inhibitor, RO, and found that continuous and subtle inhibition of Cdk1 activity from G2 phase onwards, disrupts mitotic progression, promoting premature cytokinesis, despite an active SAC. These defects are rescued by low doses of the PP2A inhibitor Okadaic acid (OA), showing that the fidelity of mitosis is highly sensitive to small disruptions in the balance between Cdk1 and PP2A.
Results
Dose-dependent effects of RO3306 on mitosis
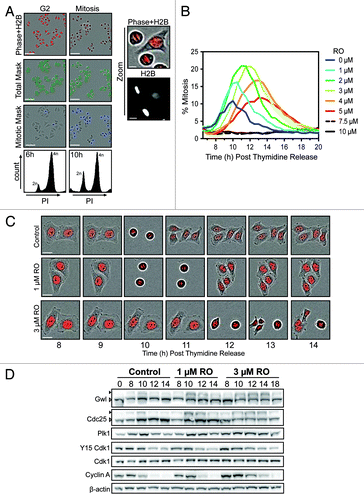
To assess the consequence of partial inhibition of Cdk1, we developed a semi-automated mitotic counting assay with the IncuCyte Zoom Kinetic Imaging System (). Using this assay with thymidine-synchronized HeLa cells stably expressing histone H2B-mCherry, we were able to rapidly assess the percentage of cells in mitosis. The H2B-mCherry provided both a nuclear marker for total cell count, and due to differential intensity between interphase and mitotic cells could be used to accurately distinguish these 2 populations (). This assay was used to examine the effects of increasing doses of the Cdk1 inhibitor RO, which is a specific inhibitor of cyclin B/Cdk1 (Ki for cyclin B-Cdk1 35 nM, Ki for cyclin A-Cdk1 100 nM).Citation8,Citation10,Citation11 Untreated control cells began to enter mitosis at approximately 8 h post-thymidine release, peaking at 10 h, with the majority of cells completing mitosis by 12 h. RO was added at 6 h post-thymidine release, which corresponded to the majority of cells containing 4n DNA content, without an increase in mitotic index, indicating that they were in G2 phase (). Addition of 1 and 2 µM of RO (low dose) increased the percentage of mitotic cells compared with control cells (15–20% compared with 10%) (). The average time of a normal mitosis in HeLa cells is approximately 30–60 min, resulting in most cells appearing in only one frame of the IncuCyte assay. In contrast, treatment with low-dose RO often resulted in an individual cell being observed in mitosis for more than one frame. Therefore the increase in the percentage of mitotic cells in response to low-dose RO is most likely due to cells taking longer to complete mitosis (). However, this increase in mitotic index began to decline from 3 µM (mild dose), and by 5 µM, the peak percentage of mitotic cells had returned to control levels, suggesting that transit time was not affected at higher doses (). Doses of 7.5 and 10 µM prevented the appearance of mitotic figures throughout the time course, suggesting that cells were arrested in G2 and the majority of Cdk1 activity was blocked (). Taken together, this data shows that partial inhibition of Cdk1 both delays mitotic entry and increases transit time; however, at doses of 3 µM and above, transit time begins to decrease.
Figure 1. Effects of partial pre-mitotic Cdk1 inhibition. (A) Synchronized HeLa-H2B-mCherry cells were released from G1/S and treated at 6 h post-release (early G2 phase) with increasing doses of the Cdk1 inhibitor RO3306 (RO). Shown are characteristic fields of G2 and mitotic images captured, along with specific masks generated using the IncuCyte to count total cell number (green) and accurately identify mitotic cells (blue) based on differential H2B-mCherry intensity and shape. Scale bar = 200 µM (10 µM for zoom). (B) Data from (A) presented as a graph showing the percentage of mitotic cells at each time point. Images were taken every hour up to 20 h post-release from thymidine. Graph is representative of 3 independent experiments. (C) Time-lapse images of representative cells from (B), showing the timing of cell division. Scale bar = 20 µM. (D) HeLa cells were synchronized with thymidine, released and treated with RO at 6 h post-release. Samples were then harvested at the indicated times post-release, lysed, and analyzed by western blot with the indicated antibodies. Triangles indicate phosphorylated (black) and non-phosphorylated (white) forms of Greatwall (Gwl) and Cdc25C. All data shown are representative images from 3 independent experiments.
Low-dose RO3306 does not affect the Cdk1 auto-amplification loop
During mitotic entry, Plk1 phosphorylates and partially activates Cdc25C, which, in turn, removes the inhibitory (T14/Y15) phosphorylations on Cdk1, partially activating it. Cdk1 then further activates Cdc25C, creating a positive feedback loop and the complete activation of Cdk1.Citation21 Cdk1 then phosphorylates and activates Gwl kinase, which leads to the inhibition of PP2A, allowing Cdk1 substrates to remain phosphorylated.Citation22 Therefore, to assess if the partial inhibition of Cdk1 was disrupting this auto-amplification loop, western blots were performed on synchronized HeLa cells treated with or without RO (1 and 3 µM). In control cells, activation of Gwl and Cdc25 was observable from 8 h and peaked at 10 h (). This corresponded with a reduction of inhibitory Y15 phosphorylation on Cdk1 and peak of Plk1 levels, indicating that the majority of cells were in mitosis. By 12 h, cyclin A and Plk1 levels began to decline, while phosphorylation of Gwl and Cdc25C decreased, indicating that most cells had begun exiting mitosis and returning to G1. Surprisingly, treatment with either 1 or 3 µM RO did not alter the timing of Gwl or Cdc25C activation, or the accumulation of Plk1, with all matching control samples at 8 and 10 h. However, activated Gwl and Cdc25C persisted for longer, with the decline observed at 14 h for 1 µM and 18 h for 3 µM treated cells. Likewise, degradation of Plk1 and cyclin A was delayed, indicating that cells were taking longer to transit through mitosis. Taken together, these results suggest that the Cdk1 auto-amplification loop is not significantly disrupted by partial Cdk1 inhibition, and therefore not the cause of the delayed entry into mitosis observed in the IncuCyte assay.
Low-dose RO3306 induces mitotic defects, centrosome fragmentation, and polyploidy
The results above show that low-dose inhibition of Cdk1 results in cells taking significantly longer to enter and complete mitosis. Therefore, to examine the effects of low-dose RO on mitosis in more detail, HeLa cells were treated with 1 and 3 µM of RO, fixed as they progressed through mitosis, and analyzed using immunofluorescence. Mild defects in chromosome congression and separation were observed at the low 1 µM dose. More severe defects were observed in the 3 µM treated cells, with chromosomes failing to congress to the metaphase plate and remaining on the astral side of the spindle poles. Severe segregation defects were also observed, with some cells showing condensed chromosomes scattered along poorly formed and elongated mid-spindles, while unequal division of chromosome mass was observed in others (). Unequal division of chromosomes and genomic instability in cancer cells is often related to the presence of multiple centrosomes. We assessed this possibility by using antibodies against centrin, a core centriole component, and the surrounding pericentriolar material (PCM) with Plk1. Control pro-metaphase cells contained the expected 2-centriole pairs of centrin (4 in total), with Plk1 staining the PCM and kinetochores. As cells entered metaphase, the 2-centriole pairs remained clearly visible, while Plk1 concentration was reduced at kinetochores. During telophase, Plk1 was present only at the mid-body, while the 4 centrin foci clearly stained the 2-centriole pairs (). Addition of either 1 or 3 µM RO during G2 phase did not result in any immediate observable defects to centriole number or localization of Plk1, with prophase cells containing the expected 2-centriole pairs and Plk1 localization at the PCM and kinetochores. However, as RO-treated cells entered pro-metaphase, centrin staining became more diffuse, and multiple foci were visible. As cells attempted telophase, this fragmentation of centrin staining was enhanced, with 3 µM treated cells showing more severe defects compared with 1 µM treated cells. Plk1 localization was also affected, with Plk1 simultaneously associated with kinetochores, spindle poles and the cleavage furrow (mid-body). The presence of Plk1 at kinetochores in 3 µM treated cells attempting to undergo cytokinesis suggested that the SAC was still active in these cells.Citation23
Figure 2. Exposure to increasing doses of RO leads to more severe mitotic defects and polyploidy. (A) Immunofluorescence of synchronized HeLa cells treated with indicated dose of RO at 6 h post-release from G1/S, and captured as they progressed through mitosis. Cells were counter-stained with β-tubulin (red) and DAPI (DNA, blue). Shown are the de-convolved maximum projections from 0.3 µm z-stacks. (B) Cells were treated as per (A), and stained for centrin (red), Plk1 (green) and DNA (blue). (C) Similar to (A), except cells were captured at 48 h post-release from thymidine. (D) DNA FACS analysis was performed on samples treated as per (A), with samples collected at 24, 48, and 72 h post-release. All data shown are representative images from 3 independent experiments. All scale bars = 5 µm.
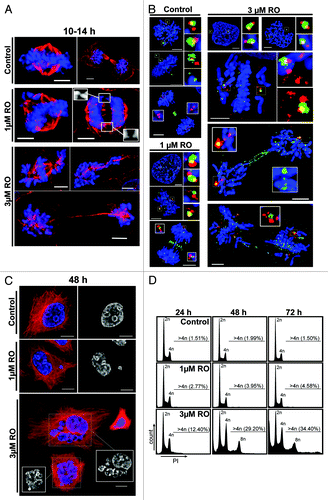
To determine the consequence of these mitotic defects, cells were captured at 48 h post-treatment. Control cells showed no observable defects; however, cells treated with 3 µM RO contained numerous large multi-nuclear cells, indicating that some of these aberrant mitotic cells failed cytokinesis, but remained viable (). In contrast, 48 h treatment with 1 µM RO did not produce such severe phenotypes, with most cells appearing similar to controls but with small micro-nuclei (). This was confirmed by flow cytometry, with 1 µM treated cells showing only a mild increase in cells with >4n DNA content (4–5%) over control levels (<2%) between 48 and 72 h. In contrast, 3 µM treated samples showed a large (29–34%) increase in cells containing >4n DNA content at 48 h and 72 h post-release, indicating the accumulation of polyploid cells (). During this period the number of cells with <2n DNA content also rose, indicating cell death was also induced by addition of RO3306.
Partial Cdk1 inhibition from G2 induces premature cytokinesis despite an active SAC
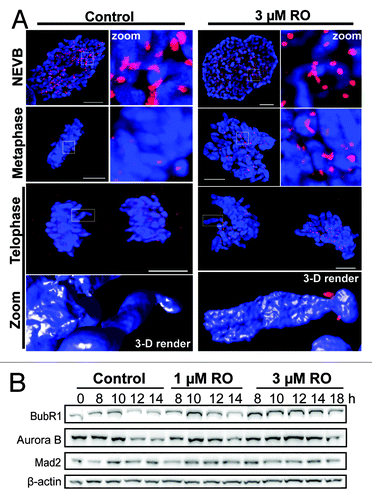
During mitosis the SAC delays mitotic exit until all chromosomes are correctly attached to opposing spindle poles and aligned on the metaphase plate.Citation5,Citation24 The continued presence of Plk1 at kinetochores in cells attempting cytokinesis indicates that stable bi-polar spindle attachment of chromosomes has not been achieved.Citation25 The severe mitotic defects we observed in cells treated with 3 µM RO should trigger a robust SAC and thereby prevent mitotic exit. To assess how cells were overcoming the SAC and undergoing aberrant mitotic exit, immunofluorescence was performed on mitotic cells treated with or without 3 µM RO. Cells were counter-stained with Mad2, a key protein involved in SAC signaling that inhibits the APC in concert with checkpoint protein BubR1.Citation26 As expected, a strong Mad2 signal was observed at kinetochores in control cells up to and including mitotic entry (NEVB). Once the SAC became satisfied in metaphase, Mad2 was removed from kinetochores, and cells progressed through anaphase and cytokinesis without any observable Mad2 staining at kinetochores (). Treatment with 3 µM RO had no effect on the loading of Mad2 onto kinetochores, with prophase- and pro-metaphase-“like” cells showing clear Mad2 staining. However, Mad2 was still present at the kinetochores of cells that had separated their chromosomes and attempted to undergo cytokinesis, indicating that mitotic exit was occurring despite continued presence of Mad2 on kinetochores (). In agreement, western blot analysis showed a clear stabilization of both BubR1 and Aurora B in 3 µM treated samples from 8 to 14 h, while Mad2 was relatively stable throughout the time course (). These data suggest that the SAC is still active in RO treated cells, and therefore likely preventing the degradation of key mitotic substrates required for exit. In support, whole chromosomes were still intact despite clear separation of DNA material, suggesting that chromatid cohesion was maintained in these cells (, 3-D render).
Figure 3. Mild G2 inhibition of Cdk1 induces rapid mitotic exit whole chromosome segregation. (A) Immunofluorescence of synchronized HeLa cells treated with 3 µM or without (control) RO at 6 h post-release from G1/S. Cells were captured as they progressed through mitosis, and counter-stained with the kinetochore protein Mad2 (red) and DAPI (DNA, blue). Shown are the de-convolved maximum projections from 0.3 µm z-stacks, and the 3D surface renders of zoomed single chromosome (3 µM) and chromatid (control). All scale bars = 5 µm. (B) HeLa cells were synchronized with thymidine, released, and treated with RO at 6 h post-release. Samples were then harvested at the indicated times post-release, lysed, and analyzed by western blot with the indicated antibodies. All data shown are representative images from 3 independent experiments.
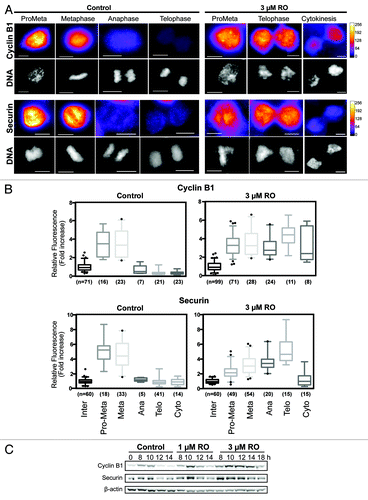
To confirm this, the levels of 2 key APC substrates, cyclin B1 and securin, were measured by quantitative immunofluorescence on cells treated with or without 3 µM RO. As expected, both cyclin B1 and securin were rapidly degraded in control cells at the metaphase-to-anaphase transition (). In contrast, cells treated with 3 µM RO maintained significantly high levels of both cyclin B1 (P < 0.0001) and securin (P < 0.0001) through to telophase, despite the attempted segregation of their DNA (). As cells attempted cytokinesis, the levels of cyclin B and securin began to reduce. Western blot analysis supported the immunofluorescence data with both cyclin B1 and securin stable in 3 µM treated cells from 8 to 14 h, with partial degradation observed at 18 h (). Taken together, these results show that partial inhibition of Cdk1 during G2 phase overrides the SAC and forces cells to prematurely attempt to undergo mitotic exit, with delayed degradation cyclin B1, securin, BubR1, and Aurora B, indicating that the APC is inhibited.
Figure 4. Cyclin B1 and securin are not degraded during decoupled mitotic exit. (A) Quantitative immunofluorescence was performed on HeLa cells treated as in and stained with DAPI (DNA, gray), and antibodies against cyclin B1 and securin. A Fire LUT was applied using ImageJ to the original raw unaltered images to clearly show the levels of staining for each protein. Scale bar = 10 µm. (B) The intensity of staining for each antibody (cyclin B1 and securin) was measured in each unaltered cell, normalized to interphase levels, expressed as fold increase and displayed as box-plots with 5 to 95% confidence intervals. The total number (n) of cells counted for each group is indicated. (C) HeLa cells were synchronized with thymidine, released, and treated with RO at 6 h post-release. Samples were then harvested at the indicated times post-release, lysed, and analyzed by western blot with the indicated antibodies. All data shown are representative images from 3 independent experiments.
Distinct thresholds of Cdk substrate phosphorylation define mitotic defects
The above data showed that at a dose of 1 µM RO, cells delayed progression through mitosis, while 3 µM RO caused cells to segregate whole chromosomes and prematurely attempt cytokinesis. A simple explanation is that RO prevents Cdk1 activity cells from fully phosphorylating all of its substrates to the level required to correctly perform each distinct phase of mitosis. To assess this in greater detail we performed quantitative immunofluorescence on cells treated with 1 µM, 3 µM, or without (control) RO. Cells were stratified into the various distinct cell cycle and mitotic phases, and the level of Cdk1 substrate phosphorylation was determined using an antibody that specifically recognizes serine residues phosphorylated by Cdk1 (pSerCdk). In control cells, the levels of pSerCdk increased as cells entered mitosis, peaking at pro-metaphase, and then declined as cells exited mitosis (). Cells treated with 1 µM RO showed a similar pattern, with the level of pSerCdk peaking at pro-metaphase, before declining as cells exited mitosis. The peak mean level reached during pro-metaphase was slightly lower than controls, but this was not statistically significant (). In contrast, cells treated with 3 µM RO displayed a statistically significant reduction in the total level of pSerCdk levels in pro-metaphase compared with controls (P = 0.0064, ). Furthermore, 3 µM treated cells failed to show any reduction in pSerCdk levels during anaphase to telophase, with the mean level stable throughout this period (). This was confirmed by western blot analysis, with pSerCdk levels stable until 18 h in cells treated with 3 µM RO (). The increased level of pSerCdk observed at 10 h in the 1 µM treated sample corresponds with the increased number of mitotic cells at this time point (), which, in turn, increases the total level of pSerCdk across the population ().
Figure 5. Partial Cdk1 inhibition prevents cells from reaching the substrate phosphorylation threshold require to correctly complete pro-metaphase. (A) Quantitative immunofluorescence was performed on HeLa cells treated as in , and stained with DAPI (DNA, gray), and an antibody against Cdk substrates phosphorylated on Ser (pSerCdk). A Fire LUT was applied using Fiji (ImageJ) to the original raw unaltered pSerCdk images to clearly show the levels of staining in each condition. (B) The intensity of staining for pSerCdk was measured in each unaltered cell, normalized to interphase levels, expressed as fold increase, and displayed as box plots with 5–95% confidence intervals. Dotted red and green lines indicate mean control levels of phosphorylation reached for pro-metaphase and NEVB respectively. The total number (n) of cells counted for each group is indicated. **P < 0.001 for 3 µM RO pro-metaphase (Pro-Meta) vs. control pro-metaphase. (C) HeLa cells were synchronized with thymidine, released, and treated with RO at 6 h post-release. Samples were then harvested at the indicated times post-release, lysed, and analyzed by western blot with the indicated antibodies. All data shown are representative images from 3 independent experiments. (D) Immunofluorescence of synchronized HeLa cells treated with 3 µM or without (control) RO at 6 h post-release from G1/S. Cells were captured as they progressed through mitosis, and counter-stained with Lamin A/C (red) and DAPI (DNA, blue). Shown are the de-convolved maximum projections from 0.3 µm z-stacks. All scale bars = 5 µm.
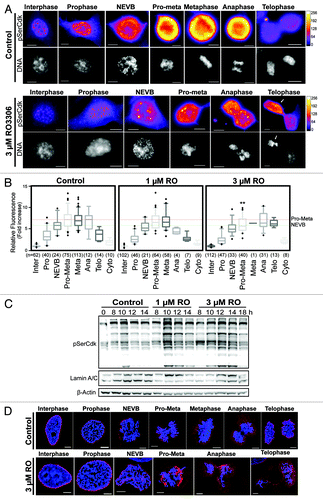
Interestingly, in some 3 µM treated cells, an asymmetrical division of pSerCdk levels in telophase was observed, with the side containing higher levels corresponding with condensed chromosomes, and what appeared to be an attempt to form a second metaphase plate (, white arrow; Video S1).
Finally, the mean peak level of pSerCdk reached in 3 µM treated cells (from pro-metaphase to telophase) was almost identical to the level required to induce NEVB in control cells. To further explore this observation, cells treated with or without (control) 3 µM RO were analyzed by immunofluorescence for the disassembly of the nuclear envelope. Cells treated with 3 µM RO only partially broke down the nuclear envelope, with large fragments of Lamin A/C present in cells from pro-metaphase through to telophase (). Taken together, these results show that the threshold of Cdk1 activity required to correctly complete pro-metaphase is not reached in cells treated with 3 µM RO ().
Okadaic acid rescues mitotic defects induced by partial Cdk1 inhibition
The above data shows that partial inhibition of Cdk1 during G2 phase prevents cells from reaching the level of substrate phosphorylation require to correctly complete metaphase. Recent studies have shown that the phosphatase PP2A is responsible for counter-balancing the activity of Cdk1 during mitotic entry.Citation15,Citation16 Therefore, reducing the activity of PP2A should rescue the partial loss of Cdk1 activity, by preventing the removal of phosphorylations from Cdk1 substrates. To assess this possibility we utilized the phosphatase inhibitor Okadaic acid (OA).
Although OA can inhibit both PP2A and PP1, at low doses only PP2A is significantly affected (PP2A IC50 = 0.5 nM, PP1 IC50 = 42 nM).Citation27 To determine the maximal dose of OA that could be used without perturbing mitosis, we utilized the same IncuCyte-based live cell-imaging assay used to characterize RO (). Using this assay, a clear increase in the percentage of mitotic cells was observable with doses of 30 nM and above. At doses of 25 nM and below, there was no major observable difference in the total number or timing of mitosis, with all cells reaching peak mitosis approximately 10 h post-release (). Therefore, a dose of 20 nM of OA was chosen for subsequent assays.
Figure 6. Mitotic decoupling induced by partial pre-mitotic inhibition of Cdk1 is rescued by Okadaic acid. (A) Similar to , except cells were treated with increasing doses of Okadaic acid (OA) instead of RO. (B) Time-lapse microscopy was performed on HeLa cells stably expressing EB3-GFP (green) and H2B-mCherry (red) that were synchronized by thymidine block and treated at 6 h post-release with or without Okadaic acid (OA 20 nM) and with increasing doses of the Cdk1 inhibitor RO (RO, 1 and 3 μM). Images were captured every 10 min. Notations indicate the time of the frame in minutes, lagging chromosomes (yellow arrows), metaphase plate orientation (dotted white lines), and cell death (yellow d). Scale bars = 5 µm. (C) Cells were split into 4 categories according to how they performed mitosis (normal, arrest, delay, exit) and expressed as a percentage for each condition. The total number (n) of cells counted for each group is indicated. (D) Individual cells from (B) were manually followed and scored for when they entered, and exited mitosis, as determined by the condensation and separation of chromosomes during prophase and anaphase, respectively. The time of mitotic entry and the mitotic length was then calculated and displayed as box plots, with 5 to 95% confidence intervals. The total number (n) of cells counted for each group is indicated *P < 0.01, **P < 0.001 ***P < 0.0001.
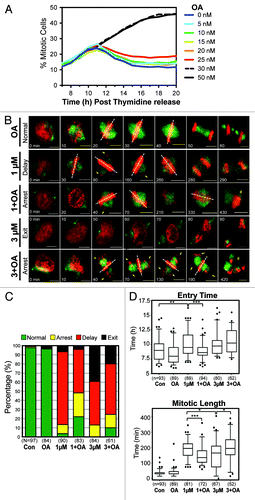
To assess mitosis in greater detail, higher temporal and visual resolution time-lapse movies were obtained using HeLa cells stably expressing H2B-mCherry and the microtubule end-binding protein EB3-GFP. Treatment of cells with 20 nM OA did not produce any significant mitotic defects, with cells correctly congressing all chromosomes to the metaphase plate and separating chromatids, with timing similar to untreated controls (; Video S1). A dose of 1 μM RO induced a number of minor mitotic defects including lagging chromosomes and rotating spindles (; Video S1). Most cells (~80%) eventually underwent cytokinesis (delay), although approximately 10% of cells remained arrested in mitosis and died (arrest). In addition, a small percentage (~5%) of cells showed no significant mitotic delay, but rapidly underwent cytokinesis before aligning their chromosomes at the metaphase plate (exit) (). These 4 phenotypes, normal, arrest, delay, and exit, were used to categorize the effects of cells, with the delay and exit phenotypes deemed more severe than the arrest phenotype (). Increasing the dose of RO to 3 µM increased the percentage of cells showing the severe mitotic exit phenotype to approximately 40%, with no cells correctly completing mitosis (). Co-addition of OA with 1 µM RO increased the number of cells that remained arrested in mitosis (arrest phenotype), and more importantly, the number of cells that correctly performed mitosis increased from 3 to 20% (). As with 1 µM RO, the addition of OA with 3 μM RO shifted cells from the more to the less severe phenotypes (). The percentage of exit phenotype cells decreased from 40% to 20%, while the percentage of cells with the delay phenotype increased by ~10% compared with 3 µM RO alone (). Importantly, addition of OA resulted in the reappearance of cells completing mitosis correctly, with approximately 10% undergoing a normal mitosis compared with none in 3 µM RO alone.
The IncuCyte assay in indicated that treatment with low-dose RO affected both the time of entry and transit through mitosis. To confirm this observation, time-lapse data from was used to accurately assess both entry time and length for individual cells. Control cells entered mitosis on average 9 h after release from G1/S, and took 35 min from entry to anaphase. In contrast, cells treated with 1 µM RO showed a highly significant delay to both the time of entry into and transit through mitosis, with most cells entering at 10 h post-release and taking 187 min to progress to anaphase (). Likewise, cells treated with 3 µM RO showed a similar delayed entry into mitosis with a mean entry time of 10 h; however, mitotic length was statistically shorter compared with 1 µM RO, with cells taking on average 153 min to reach anaphase. Co-treatment with OA was able to visually rescue the phenotypic effects of RO treatment. For 1 µM RO, OA reduced both entry time and mitotic length back toward control levels (P < 0.0001) (). While addition of OA to 3 µM RO resulted in cells behaving similar to cells treated with only 1 µM RO, with a significant global increase in mitotic length (P < 0.01) ().
In summary, this data shows that low dose treatment with the PP2A inhibitor OA, can rescue the mitotic defects induced by partial Cdk1 inhibition. This suggests that reducing PP2A activity shifts the balance back toward the maintenance of phosphorylation on cyclin B1/Cdk1 substrates, thereby promoting correct mitotic progression.
Discussion
The inhibition of Cdk1 activity during mitosis forces cells to rapidly undergo mitotic exit.Citation8,Citation12,Citation14,Citation28 In this study we analyzed the effects on mitosis of adding low-dose Cdk1 inhibitor during early G2 phase. Low-dose (1 µM) inhibition of Cdk1 slightly reduced the peak pro-metaphase level of substrate phosphorylation (pSerCdk) during mitosis, which may explain why cells struggled to correctly align chromosomes on the metaphase plate. This led to a prolonged mitosis, with mild segregation defects and minor increases in polyploidy. Increasing the dose of Cdk1 inhibitor to 3 µM further reduced the peak level of Cdk1 substrate phosphorylation during mitosis, with cells reaching the threshold required to initiate NEVB, but not pro-metaphase. The consequence was a decoupling of mitotic events, with cells failing to correctly degrade the nuclear envelope, segregating whole chromosomes, and attempting to undergo cytokinesis at the same time. This likely caused abnormal physical stress on the cell, which, in turn, resulted in the fragmentation of the centrosomes.Citation29,Citation30 Cell division often failed, and cells would attempt a second round of metaphase. This highly aberrant mitosis did cause increased cell death; however, surprisingly, many cells survived with an increase in proportion of polyploid cells present up to 3 days post-treatment. Polyploidy has been associated with chromosome instability, chemo-resistance, and the generation of cancer stem-like cells.Citation31-Citation33 Over the past 10 years, a large number of Cdk1 inhibitors have been developed and are currently undergoing clinical trials for the treatment of various cancer types.Citation34 Our results suggest that the dose of Cdk1 inhibitor used clinically will be a critical factor in the efficacy of these compounds. In support, the mitotic chemotherapeutic Taxol shows a variable mitotic response at different concentrations: cells treated with either a low or high dose of Taxol arrest for short periods and show greater levels of survival. In contrast, medium doses induce a robust prolonged mitotic arrest, and a greater chance that cell death will be induced either in mitosis or in the subsequent G1 phase.Citation35-Citation37
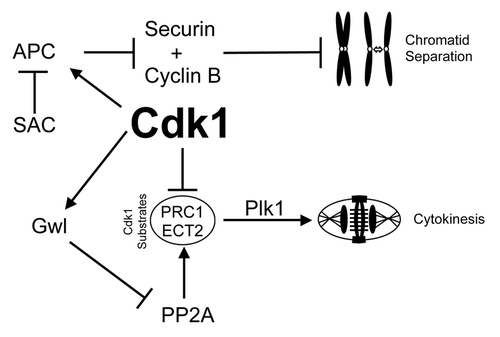
Our data show that there are distinct thresholds of Cdk1 substrate phosphorylation that need to be sequentially reached to ensure the correct completion of each phase of mitosis. This is supported by prior observations in mammalian cells, where progression from NEVB to metaphase corresponds with step-wise increases in the total level of Cdk1 substrate phosphorylation,Citation28 and this has been proposed as the trigger for specific mitotic events.Citation13 Likewise in yeast, sequentially setting Cdk1 activity at different thresholds is sufficient to allow correct cell cycle division.Citation38 We found that mild (3 µM RO) inhibition of Cdk1 activity in G2 phase led to cells reaching the level of Cdk1 substrate phosphorylation capable of initiating NEVB, but not that required to correctly complete pro-metaphase. As a result cells attempted both cytokinesis and mitosis simultaneously, highlighted by partial delocalization of Plk1 to the cytokinesis furrow. Cdk1 activity prevents cytokinesis by phosphorylating many proteins that control cytokinesis, such as PRC1 and ECT2,Citation39-Citation41 with the phosphorylation of PRC1 preventing Plk1 binding and re-localization to the central spindle.Citation42 Therefore, lower substrate phosphorylation levels observed with 3 µM RO are likely insufficient to fully maintain these inhibitory phosphorylations, thereby allowing cytokinesis to begin prematurely (). However, during this period, Mad2 and Plk1 remained localized at kinetochores, indicating that stable bi-polar microtubule attachments had not been achieved. Therefore, a strong SAC signal maintained the inhibition of the APC, preventing degradation of cyclin B1 and securinCitation7,Citation43 and, consequently, chromatid separation ().
Figure 7. Mechanisms of mitotic decoupling by low-dose Cdk1 inhibitor. A summary of the possible mechanism of how cytokinesis can be induced without separation of chromatids. Briefly, reduced Cdk1 activity during mitotic entry results in reduced phosphorylation of Cdk1 target substrates (such as ECT2 and PRC1). Without this negative phosphorylation, these substrates can bind Plk1 and initiate cytokinesis. However, during this period the large number of incorrectly attached kinetochores would provide a strong SAC signal to suppress APC mediated degradation of cyclin B1 and securin, thereby preventing segregation of chromatids and maintaining Cdk1 activity.
Previous studies have shown that the timed addition of high doses of a Cdk1 inhibitor prior to and during mitosis leads to different cell fates; addition during prophase returns the cell to a G2 state; treatment after NEVB induces mitotic exit without chromatid separation; while treatment at metaphase induces chromatid segregation and exit.Citation13,Citation28,Citation44 Our results expand and qualify these previous studies, showing that treatment with low doses of Cdk1 inhibitor from early G2 results in a novel phenotype where cells attempt to enter pro-metaphase and perform cytokinesis simultaneously, without deactivation of the SAC. Taken together, these results suggest that cells do not actively monitor Cdk1 activity during mitotic entry and are willing to enter mitosis despite being unable to achieve the level of Cdk1 activity needed to reach the threshold of substrate phosphorylation required to complete mitosis.
The total level of Cdk1 substrate phosphorylation is a combined function of the activity of Cdk1 and the counter-balancing phosphatase. We and several other labs have demonstrated in vertebrate cells that during mitotic entry, inhibition of PP2A-B55 is required in order to allow Cdk1 substrates to remain phosphorylated.Citation15-Citation17,Citation20,Citation41,Citation45 Our results here further support PP2A as the primary phosphatase counter-balancing Cdk1 during mitotic entry and progression, as we were able to rescue the mitotic defects caused by RO with low doses of Okadaic acid. In cells, this balance between Cdk1 and PP2A is controlled by Greatwall kinase (Gwl).Citation16,Citation19,Citation41 Surprisingly knockdown of Gwl induces different mitotic defects to those induced by partial Cdk1 inhibition. When Gwl is fully depleted, cells enter into prophase but then rapidly undergo mitotic collapse, with cells failing to segregate chromosomes or perform cytokinesis.Citation16,Citation46 Partial knockdown induces multiple mitotic defects, including elongated spindles, chromosome congression and segregation errors, and cytokinesis failure.Citation16,Citation47 These are distinct from the phenotypes observed here, with partial Cdk1 inhibition inducing premature cytokinesis and whole-chromosome separations. This suggests that Gwl may have additional functions beyond controlling the balance between Cdk1 and PP2A.
In summary, we show here that subtle disruption of the balance between Cdk1 and PP2A can dramatically alter mitotic fate. Further investigations of how these balances are maintained and regulated will be critical to understanding the mechanisms controlling mitosis, and could help improve the clinical efficacy of compounds targeting Cdk1.
Materials and Methods
Chemicals, reagents, and antibodies
The following chemicals were used: RO3306 (Axon MedChem), Okadaic Acid sodium salt (A.G. Scientifix), Thymidine and 2’-Deoxycytidine hydrate (Santa Cruz Biotechnology). The following antibodies were used; BUB1B (BubR1) (#4116), Cyclin B1 (#12231), Phospho-(Ser) CDK Substrate (#2324), pCdc2-Tyr15 (CDK1-Y15) (#9111), Plk1 (#4535), Aurora B (#3094) and Lamin A/C (#4777) (Cell Signaling Technologies), Securin (ab3306) (Abcam), Cyclin A (sc-596), Cdc2 (CDK1) (sc-137034), Mad2 (sc-47747), Cdc25C (sc-327) (Santa Cruz Biotechnology), centrin (#04–1624) (Millipore) and β-actin (A5441) (Sigma-Aldrich). Anti-Greatwall was obtained as previously described (Vigneron et al., 2009), and monoclonal β-Tubulin hybridoma antibody was a generous donation from Dr Natalie Morin (CRBM, France).
Cell culture and synchrony
HeLa cells were grown in Dulbecco modified Eagle medium supplemented with HEPES and 10% (v/v) fetal calf serum (Invitrogen). Thymidine block/release synchronizations were performed as previously described.Citation48 Briefly, cells were blocked in G1/S with 1 mM thymidine for 20–24 h, then released into S phase by washing 3 times with pre-warmed media, and then addition of fresh media plus 25 µM deoxycytidine. At 6 h post-release (post-S phase) cells were treated with either the Cdk1 inhibitor RO3306 (RO) or the PP2A/PP1 inhibitor Okadaic acid (OA). The efficiency of the cell synchrony was confirmed by flow cytometry (FACS) as previously described.Citation49 HeLa cells stably expressing H2B-mCherry were made by transiently transfecting cells with a pH2B_mCherry_IRES_neo3 plasmid (H2B-mCherry)(Addgene #21044) using Turbofect (Thermo Scientific #R0533) as per the manufacturer instructions. Cells were selected for 1–2 wk with 500 µg/ml of G418 and sorted by flow cytometry to isolate a homogenous pool of cells expressing a medium level of H2B-mCherry. These were then maintained in 500 µg/ml of G418. HeLa cells co-expressing H2B-mCherry and EB3-GFP were a generous gift from Dr J Ellenberg (European Molecular Biology Laboratory) and Dr V Doye (Institut Jacques-Monod), and were cultured as previously described.Citation16
IncuCyte assay
HeLa cells stably expressing H2B-mCherry were seeded onto 48-well plates, synchronized with 1 mM thymidine, treated with RO or OA at 6 h post-release, and then immediately placed on the IncuCyte Zoom Kinetic Imaging System (Essen BioScience). Four fields per well were imaged every 60 min for between 16 to 72 h. All images were analyzed by the IncuCyte Software. Two masks were created, total cell count and mitotic cell count (see ). For the total cell count mask, Adaptive Threshold Adjustment was set at >1.0 RCU and no filters were applied. For the mitotic mask Adaptive Threshold Adjustment was set at >5.0 RCU and maximum area filter was set at <200 µm2. Percent mitosis was calculated as (mitotic count/total count) × 100.
Western blot analysis
Proteins from whole-cell lysates were resolved under reducing conditions on 4–12% Bis-Tris polyacrylamide gels (Invitrogen) using standard methods. Resolved proteins were transferred to 0.45 µm PVDF membranes (Bio-Rad) and incubated with the indicated antibodies overnight at 4 °C. Protein bands were detected by the appropriate anti-IgG secondary antibodies conjugated with horseradish peroxidase followed by enhanced chemiluminescence (Pierce), then imaged using a Fusion-FX (Vilber Lourmat). Blots were checked for equal loading by re-probing with anti-β-actin.
Immunofluorescent staining
Cells were grown on Histogrip (Invitrogen) coated glass coverslips and fixed using ice-cold 100% methanol (β-tubulin) or with 3.7% formaldehyde diluted in PBS with 0.5% Triton X-100 for 10 min (Mad2, pSerCdk, Lamin A/C, Plk1, cyclin B1, and securin). All cells were washed and then blocked (3% BSA, 0,1% Tween 20 in PBS) for 30 min. Cells were incubated with primary antibodies were incubated for 2 h at room temperature in blocking solution. DNA was stained with DAPI. For Lamin A/C staining a Leica DM6000 SP8 confocal with a 63× lens was used. All other images were captured using Leica DM5500 microscope coupled with a Coolsnap HQ2 camera, using a Leica 100× or 40× APO 1.4 lens, powered by Leica LAS AF v3 software. To quantify pSer-CDK, cyclin B and secruin levels in cells, a single in-focus plane was acquired. Using ImageJ (v1.48, NIH), an outline was drawn around each cell and circularity, area, mean fluorescence measured, along with several adjacent background readings. The total corrected cellular fluorescence (TCCF) = integrated density – (area of selected cell × mean fluorescence of background readings), was calculated. This TCCF was then equalized against the mean TCCF of neighboring interphase cells in the same field of view, with results presented as fold increase over interphase levels. Box plots and statistical analysis (2-sided unpaired Student t tests) were performed using GraphPad Prism 5. For all other images, 0.3 µm z-sections were taken, de-convolved, and displayed as 2D maximum projections using ImageJ. False coloring and overlays were performed using Adobe Photoshop CS5 software.
Live cell imaging
Cells were filmed with a Micromax YHS 1300 camera coupled to a Zeiss Axiovert 200M inverted microscope fitted with a Zeiss 40×/0.6 Plan-Neofluar PH2 lens, Zeiss mercury lamp, and controlled by Metamorph 7.1 software (Molecular Devices). Phase-contrast, H2B-mCherry and EB3-GFP fluorescence images were taken every 10 min. The resulting images were processed, analyzed and false colored using Photoshop CS5 Extended software. Box plots and statistical analysis (2-sided unpaired student t tests) were performed using GraphPad Prism 5.
| Abbreviations: | ||
| Cdk | = | cyclin-dependent kinase |
| SAC | = | spindle assembly checkpoint |
| Gwl | = | Greatwall |
| NEVB | = | nuclear envelope breakdown |
| RO | = | RO3306 |
| OA | = | Okadaic acid |
| APC | = | anaphase-promoting complex |
| ENSA | = | αEndosulfine |
Additional material
Download Zip (5.1 MB)Disclosure of Potential Conflicts of Interest
No potential conflicts of interest were disclosed.
Acknowledgments
We thank Sylvain De Rossi (Montpellier RIO Imaging), Dr Will Hughes (Pieter Huveneers Molecular Imaging Unit, Garvan Institute), Dr Kim Moran-Jones, and Dr Paul Timpson for helpful comments. This work was supported by the Cancer Institute of NSW, and the Ligue Nationale Contre le Cancer (Equipe Labelisée) and Agence Nationale de la Recherche (ANR) 2010 BLAN 120701. A.B. is a CINSW FRL fellow and C.E.C. is an NBCF Australia fellow and CI NSW CD fellow.
Related Research Data
References
- Sherr CJ. Cancer cell cycles. Science 1996; 274:1672 - 7; http://dx.doi.org/10.1126/science.274.5293.1672; PMID: 8939849
- Satyanarayana A, Kaldis P. Mammalian cell-cycle regulation: several Cdks, numerous cyclins and diverse compensatory mechanisms. Oncogene 2009; 28:2925 - 39; http://dx.doi.org/10.1038/onc.2009.170; PMID: 19561645
- Pines J. Cyclins, CDKs and cancer. Semin Cancer Biol 1995; 6:63 - 72; http://dx.doi.org/10.1006/scbi.1995.0009; PMID: 7647308
- Holt LJ, Tuch BB, Villén J, Johnson AD, Gygi SP, Morgan DO. Global analysis of Cdk1 substrate phosphorylation sites provides insights into evolution. Science 2009; 325:1682 - 6; http://dx.doi.org/10.1126/science.1172867; PMID: 19779198
- Lara-Gonzalez P, Westhorpe FG, Taylor SS. The spindle assembly checkpoint. Curr Biol 2012; 22:R966 - 80; http://dx.doi.org/10.1016/j.cub.2012.10.006; PMID: 23174302
- Collin P, Nashchekina O, Walker R, Pines J. The spindle assembly checkpoint works like a rheostat rather than a toggle switch. Nat Cell Biol 2013; 15:1378 - 85; http://dx.doi.org/10.1038/ncb2855; PMID: 24096242
- Pines J. Cubism and the cell cycle: the many faces of the APC/C. Nat Rev Mol Cell Biol 2011; 12:427 - 38; http://dx.doi.org/10.1038/nrm3132; PMID: 21633387
- Vassilev LT, Tovar C, Chen S, Knezevic D, Zhao X, Sun H, Heimbrook DC, Chen L. Selective small-molecule inhibitor reveals critical mitotic functions of human CDK1. Proc Natl Acad Sci U S A 2006; 103:10660 - 5; http://dx.doi.org/10.1073/pnas.0600447103; PMID: 16818887
- Chircop M, Malladi CS, Lian AT, Page SL, Zavortink M, Gordon CP, McCluskey A, Robinson PJ. Calcineurin activity is required for the completion of cytokinesis. Cell Mol Life Sci 2010; 67:3725 - 37; http://dx.doi.org/10.1007/s00018-010-0401-z; PMID: 20496096
- Vassilev LT. Cell cycle synchronization at the G2/M phase border by reversible inhibition of CDK1. Cell Cycle 2006; 5:2555 - 6; http://dx.doi.org/10.4161/cc.5.22.3463; PMID: 17172841
- Echalier A, Cot E, Camasses A, Hodimont E, Hoh F, Jay P, Sheinerman F, Krasinska L, Fisher D. An integrated chemical biology approach provides insight into Cdk2 functional redundancy and inhibitor sensitivity. Chem Biol 2012; 19:1028 - 40; http://dx.doi.org/10.1016/j.chembiol.2012.06.015; PMID: 22921070
- Skoufias DA, Indorato R-L, Lacroix F, Panopoulos A, Margolis RL. Mitosis persists in the absence of Cdk1 activity when proteolysis or protein phosphatase activity is suppressed. J Cell Biol 2007; 179:671 - 85; http://dx.doi.org/10.1083/jcb.200704117; PMID: 18025303
- Gavet O, Pines J. Progressive activation of CyclinB1-Cdk1 coordinates entry to mitosis. Dev Cell 2010; 18:533 - 43; http://dx.doi.org/10.1016/j.devcel.2010.02.013; PMID: 20412769
- Potapova TA, Daum JR, Pittman BD, Hudson JR, Jones TN, Satinover DL, Stukenberg PT, Gorbsky GJ. The reversibility of mitotic exit in vertebrate cells. Nature 2006; 440:954 - 8; http://dx.doi.org/10.1038/nature04652; PMID: 16612388
- Mochida S, Ikeo S, Gannon J, Hunt T. Regulated activity of PP2A-B55 delta is crucial for controlling entry into and exit from mitosis in Xenopus egg extracts. EMBO J 2009; 28:2777 - 85; http://dx.doi.org/10.1038/emboj.2009.238; PMID: 19696736
- Burgess A, Vigneron S, Brioudes E, Labbé J-C, Lorca T, Castro A. Loss of human Greatwall results in G2 arrest and multiple mitotic defects due to deregulation of the cyclin B-Cdc2/PP2A balance. Proc Natl Acad Sci U S A 2010; 107:12564 - 9; http://dx.doi.org/10.1073/pnas.0914191107; PMID: 20538976
- Schmitz MHA, Held M, Janssens V, Hutchins JRA, Hudecz O, Ivanova E, Goris J, Trinkle-Mulcahy L, Lamond AI, Poser I, et al. Live-cell imaging RNAi screen identifies PP2A-B55alpha and importin-beta1 as key mitotic exit regulators in human cells. Nat Cell Biol 2010; 12:886 - 93; http://dx.doi.org/10.1038/ncb2092; PMID: 20711181
- Mochida S, Maslen SL, Skehel M, Hunt T. Greatwall phosphorylates an inhibitor of protein phosphatase 2A that is essential for mitosis. Science 2010; 330:1670 - 3; http://dx.doi.org/10.1126/science.1195689; PMID: 21164013
- Gharbi-Ayachi A, Labbé J-C, Burgess A, Vigneron S, Strub J-M, Brioudes E, Van-Dorsselaer A, Castro A, Lorca T. The substrate of Greatwall kinase, Arpp19, controls mitosis by inhibiting protein phosphatase 2A. Science 2010; 330:1673 - 7; http://dx.doi.org/10.1126/science.1197048; PMID: 21164014
- Vigneron S, Brioudes E, Burgess A, Labbé J-C, Lorca T, Castro A. Greatwall maintains mitosis through regulation of PP2A. EMBO J 2009; 28:2786 - 93; http://dx.doi.org/10.1038/emboj.2009.228; PMID: 19680222
- Lindqvist A, Rodríguez-Bravo V, Medema RH. The decision to enter mitosis: feedback and redundancy in the mitotic entry network. J Cell Biol 2009; 185:193 - 202; http://dx.doi.org/10.1083/jcb.200812045; PMID: 19364923
- Lorca T, Castro A. Deciphering the New Role of the Greatwall/PP2A Pathway in Cell Cycle Control. Genes Cancer 2012; 3:712 - 20; http://dx.doi.org/10.1177/1947601912473478; PMID: 23634258
- Beck J, Maerki S, Posch M, Metzger T, Persaud A, Scheel H, Hofmann K, Rotin D, Pedrioli P, Swedlow JR, et al. Ubiquitylation-dependent localization of PLK1 in mitosis. Nat Cell Biol 2013; 15:430 - 9; http://dx.doi.org/10.1038/ncb2695; PMID: 23455478
- Silva P, Barbosa J, Nascimento AV, Faria J, Reis R, Bousbaa H. Monitoring the fidelity of mitotic chromosome segregation by the spindle assembly checkpoint. Cell Prolif 2011; 44:391 - 400; http://dx.doi.org/10.1111/j.1365-2184.2011.00767.x; PMID: 21951282
- Liu D, Davydenko O, Lampson MA. Polo-like kinase-1 regulates kinetochore-microtubule dynamics and spindle checkpoint silencing. J Cell Biol 2012; 198:491 - 9; http://dx.doi.org/10.1083/jcb.201205090; PMID: 22908307
- Davenport J, Harris LD, Goorha R. Spindle checkpoint function requires Mad2-dependent Cdc20 binding to the Mad3 homology domain of BubR1. Exp Cell Res 2006; 312:1831 - 42; http://dx.doi.org/10.1016/j.yexcr.2006.02.018; PMID: 16600213
- Swingle M, Ni L, Honkanen RE. Small-molecule inhibitors of ser/thr protein phosphatases: specificity, use and common forms of abuse. Methods Mol Biol 2007; 365:23 - 38; PMID: 17200551
- Potapova TA, Sivakumar S, Flynn JN, Li R, Gorbsky GJ. Mitotic progression becomes irreversible in prometaphase and collapses when Wee1 and Cdc25 are inhibited. Mol Biol Cell 2011; 22:1191 - 206; http://dx.doi.org/10.1091/mbc.E10-07-0599; PMID: 21325631
- Rusan NM, Wadsworth P. Centrosome fragments and microtubules are transported asymmetrically away from division plane in anaphase. J Cell Biol 2005; 168:21 - 8; http://dx.doi.org/10.1083/jcb.200409153; PMID: 15631988
- Kim K, Rhee K. The pericentriolar satellite protein CEP90 is crucial for integrity of the mitotic spindle pole. J Cell Sci 2011; 124:338 - 47; http://dx.doi.org/10.1242/jcs.078329; PMID: 21224392
- Janssen A, Medema RH. Mitosis as an anti-cancer target. Oncogene 2011; 30:2799 - 809; http://dx.doi.org/10.1038/onc.2011.30; PMID: 21339734
- Wang Q, Wu PC, Dong DZ, Ivanova I, Chu E, Zeliadt S, Vesselle H, Wu DY. Polyploidy road to therapy-induced cellular senescence and escape. Int J Cancer 2013; 132:1505 - 15; http://dx.doi.org/10.1002/ijc.27810; PMID: 22945332
- Zhang S, Mercado-Uribe I, Xing Z, Sun B, Kuang J, Liu J. Generation of cancer stem-like cells through the formation of polyploid giant cancer cells. Oncogene 2014; 33:116 - 28; http://dx.doi.org/10.1038/onc.2013.96; PMID: 23524583
- Stone A, Sutherland RL, Musgrove EA. Inhibitors of cell cycle kinases: recent advances and future prospects as cancer therapeutics. Crit Rev Oncog 2012; 17:175 - 98; http://dx.doi.org/10.1615/CritRevOncog.v17.i2.40; PMID: 22471707
- Yang Z, Kenny AE, Brito DA, Rieder CL. Cells satisfy the mitotic checkpoint in Taxol, and do so faster in concentrations that stabilize syntelic attachments. J Cell Biol 2009; 186:675 - 84; http://dx.doi.org/10.1083/jcb.200906150; PMID: 19720871
- Bekier ME, Fischbach R, Lee J, Taylor WR. Length of mitotic arrest induced by microtubule-stabilizing drugs determines cell death after mitotic exit. Mol Cancer Ther 2009; 8:1646 - 54; http://dx.doi.org/10.1158/1535-7163.MCT-08-1084; PMID: 19509263
- Gascoigne KE, Taylor SS. Cancer cells display profound intra- and interline variation following prolonged exposure to antimitotic drugs. Cancer Cell 2008; 14:111 - 22; http://dx.doi.org/10.1016/j.ccr.2008.07.002; PMID: 18656424
- Coudreuse D, Nurse P. Driving the cell cycle with a minimal CDK control network. Nature 2010; 468:1074 - 9; http://dx.doi.org/10.1038/nature09543; PMID: 21179163
- Zhu C, Lau E, Schwarzenbacher R, Bossy-Wetzel E, Jiang W. Spatiotemporal control of spindle midzone formation by PRC1 in human cells. Proc Natl Acad Sci U S A 2006; 103:6196 - 201; http://dx.doi.org/10.1073/pnas.0506926103; PMID: 16603632
- Su K-C, Takaki T, Petronczki M. Targeting of the RhoGEF Ect2 to the equatorial membrane controls cleavage furrow formation during cytokinesis. Dev Cell 2011; 21:1104 - 15; http://dx.doi.org/10.1016/j.devcel.2011.11.003; PMID: 22172673
- Cundell MJ, Bastos RN, Zhang T, Holder J, Grüneberg U, Novak B, Barr FA. The BEG (PP2A-B55/ENSA/Greatwall) pathway ensures cytokinesis follows chromosome separation. Mol Cell 2013; 52:393 - 405; http://dx.doi.org/10.1016/j.molcel.2013.09.005; PMID: 24120663
- Neef R, Gruneberg U, Kopajtich R, Li X, Nigg EA, Sillje H, Barr FA. Choice of Plk1 docking partners during mitosis and cytokinesis is controlled by the activation state of Cdk1. Nat Cell Biol 2007; 9:436 - 44; http://dx.doi.org/10.1038/ncb1557; PMID: 17351640
- Varetti G, Guida C, Santaguida S, Chiroli E, Musacchio A. Homeostatic control of mitotic arrest. Mol Cell 2011; 44:710 - 20; http://dx.doi.org/10.1016/j.molcel.2011.11.014; PMID: 22152475
- Gavet O, Pines J. Activation of cyclin B1-Cdk1 synchronizes events in the nucleus and the cytoplasm at mitosis. J Cell Biol 2010; 189:247 - 59; http://dx.doi.org/10.1083/jcb.200909144; PMID: 20404109
- Castilho PV, Williams BC, Mochida S, Zhao Y, Goldberg ML. The M phase kinase Greatwall (Gwl) promotes inactivation of PP2A/B55delta, a phosphatase directed against CDK phosphosites. Mol Biol Cell 2009; 20:4777 - 89; http://dx.doi.org/10.1091/mbc.E09-07-0643; PMID: 19793917
- Álvarez-Fernández M, Sánchez-Martínez R, Sanz-Castillo B, Gan PP, Sanz-Flores M, Trakala M, Ruiz-Torres M, Lorca T, Castro A, Malumbres M. Greatwall is essential to prevent mitotic collapse after nuclear envelope breakdown in mammals. Proc Natl Acad Sci U S A 2013; 110:17374 - 9; http://dx.doi.org/10.1073/pnas.1310745110; PMID: 24101512
- Voets E, Wolthuis RMF. MASTL is the human orthologue of Greatwall kinase that facilitates mitotic entry, anaphase and cytokinesis. Cell Cycle 2010; 9:3591 - 601; http://dx.doi.org/10.4161/cc.9.17.12832; PMID: 20818157
- Gabrielli BG, De Souza CP, Tonks ID, Clark JM, Hayward NK, Ellem KA. Cytoplasmic accumulation of cdc25B phosphatase in mitosis triggers centrosomal microtubule nucleation in HeLa cells. J Cell Sci 1996; 109:1081 - 93; PMID: 8743955
- Burgess A, Lorca T, Castro A. Quantitative live imaging of endogenous DNA replication in mammalian cells. PLoS One 2012; 7:e45726; http://dx.doi.org/10.1371/journal.pone.0045726; PMID: 23029203