Abstract
Keap1 negatively controls the activity of transcription factor Nrf2. This Keap1/Nrf2 pathway plays a critical role in combating oxidative stress. We aimed at determining whether and how Keap1 modulates the cell cycle of replicating hepatocytes during liver regeneration. Two-thirds partial hepatectomy (PH) was performed on wild-type mice and Keap1+/− (Keap1 knockdown) mice. We found that, following PH, Keap1 knockdown resulted in a delay in S-phase entry, disruption of S-phase progression, and loss of mitotic rhythm of replicating hepatocytes. These events are associated with dysregulation of c-Met, EGFR, Akt1, p70S6K, Cyclin A2, and Cyclin B1 in regenerating livers. Astonishingly, normal regenerating livers exhibited the redox fluctuation coupled with hepatocyte cell cycle progression, while keeping Nrf2 quiescent. Keap1 knockdown caused severe disruption in both the redox cycle and the cell cycle of replicating hepatocytes. Thus, we demonstrate that Keap1 is a potent regulator of hepatic redox cycle and hepatocyte cell cycle during liver regeneration.
Introduction
Actin-binding Kelch-like ECH-associated protein 1 (Keap1) and a leucine zipper motif-containing transcription factor nuclear factor erythroid 2-related factor 2 (Nrf2) form a pathway combating a variety of xenobiotic and endobiotic insults.Citation1 In the quiescent state, cytosolic Keap1, as an adaptor, tethers Nrf2 for ubiquitin conjugation by a Cul3-containing E3 ubiquitin ligase, targeting Nrf2 for proteasomal degradation. When oxidative stress occurs, Keap1, as a redox sensor, undergoes a conformational change because of the modification of its ultra-sensitive cysteine residues by oxidative stress-causing highly active molecules such as electrophiles. As a result, Nrf2 escapes from ubiquitin conjugation, translocates into the nucleus, and, in turn, transcriptionally activates a group of genes encoding cytoprotective molecules, including detoxifying enzymes, GSH synthesis enzymes, and antioxidant proteins.Citation2 These molecules coordinately combat oxidative stress, thus restoring cellular homeostasis. Subsequently, Keap1 translocates into the nucleus and escorts nuclear export of Nrf2 for continuous proteasomal degradation in the cytoplasm, thus terminating Nrf2 activation.Citation3,Citation4 Moreover, Keap1 can interact with other proteins and Nrf2 activity can be regulated by Keap1-independent mechanisms,Citation5-Citation7 indicating their independent regulation and roles in different biological or pathological processes.
It has been shown that Nrf2 deficiency causes impairment of liver regeneration due to oxidative stress-mediated insulin/insulin-like growth factor resistance and diminished Notch1 signaling.Citation8,Citation9 The aim of our study was to gain further insights into the roles of the Keap1/Nrf2 signaling pathway in regulating liver regeneration, with a particular focus on determining whether and how Keap1 modulates the cell cycle of regenerating hepatocytes. Two-thirds partial hepatectomy (PH) was used in our study because PH induces highly synchronized cell cycle progression in hepatocytes without inflicting major cellular injury and inflammation.Citation10-Citation12 In mice, after PH, mature hepatocytes display 4 consecutive waves of replication, eventually restoring the lost liver mass in 7 to 10 d. During the first and strongest wave of hepatic proliferative cycle, hepatocytes reach the G1/S boundary around 24 h, undergo DNA synthesis (S phase) with a peak at 36 h, and, in turn, exhibit a mitosis peak (M phase) at Zeitgeber time 0 on the second day, following PH.Citation10,Citation13,Citation14 This well-characterized in vivo process enabled us to precisely evaluate the regulatory role of the Keap1/Nrf2 pathway at each stage of the cell cycle. In addition, studies using cultured mammalian cells or yeast demonstrate that the cell cycle is coupled with the redox cycle.Citation15 However, this has not been confirmed in vivo in mammals. Thus, we also aimed at determining whether the redox cycle is integrated into hepatocyte cell cycle and is regulated by the Keap1/Nrf2 pathway during liver regeneration. Because the Keap1-null mutation causes postnatal lethality,Citation16 Keap1+/− mice were chosen for our study to evaluate the effects of Keap-1 knockdown on hepatocyte proliferation. We performed PH on wild-type and Keap1+/− mice and performed various analyses at multiple time points after surgery. We found that regenerating livers exhibited high magnitudes of redox fluctuation as replicating hepatocytes progressed through the cell cycle and Keap1 knockdown elicited potent effects on hepatic redox cycle and the cell cycle of replicating hepatocytes during liver regeneration.
Results
Keap1 knockdown does not significantly affect liver regrowth after PH
In the quiescent state, the average liver-to-body weight ratio in Keap1+/− mice is slightly lower than that in their wild-type littermates (4.62% ± 0.16 vs. 5.22% ± 0.18; P < 0.05, n = 5), indicating that Keap1+/− mice have a reduced liver size. Using the liver-to-body weight ratio as a liver regrowth parameter, we found that Keap1 knockdown did not significantly impact liver regrowth and final hepatic mass restoration following PH (Fig. S1).
Keap1 knockdown causes a delay in S phase entry, aberrant S phase progression, and loss of mitotic rhythm of replicating hepatocytes following PH
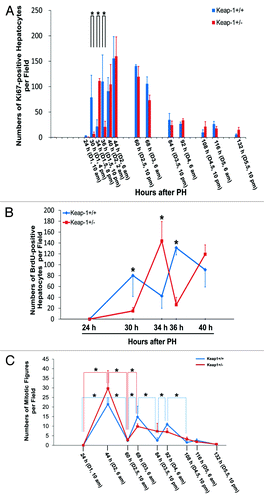
By counting Ki67-positive hepatocytes, we observed that Keap1+/− mice displayed marked alterations in the numbers of cycling hepatocytes during the first wave of hepatic proliferative cycle (24 h to 60 h after PH) in comparison with their wild-type controls (; Fig. S2). By quantifying BrdU-positive (S-phase) hepatocytes, we found that Keap1 knockdown caused a delay in S phase entry and subsequent disruption in S phase progression during the first round of hepatocyte cell cycle following PH (; Fig. S3). We also quantified hepatocyte mitotic figures representing M-phase hepatocytes (). After PH, Keap1+/+ mice displayed 4 waves of hepatocyte mitosis rhythmically as anticipated, whereas the hepatocyte mitotic rhythm was lost in Keap1+/− mice.
Figure 1. (A) Assessment of total proliferating hepatocytes. Wild-type (Keap1+/+) and Keap1 knockdown (Keap1+/−) mice were subjected to partial hepatectomy (PH) and sacrificed at the indicated time points. Ki-67 immunostaining was performed with liver sections. Ki67-positive hepatocytes were counted at 200x magnification in 5 randomly chosen fields per section. The results are shown as the means per field ± SD (n = 3–8 mice per genotype per time point). Asterisks represent P < 0.05 in comparison between Keap1+/+ and Keap1+/− mice. (B) Assessment of S-phase hepatocytes during the first round of hepatocyte cell cycle post-PH. One hour prior to sacrifice, BrdU was injected into the mice (100 mg/kg, i.p.). Liver sections were subjected to BrdU immunostaining. BrdU-positive hepatocytes were counted at 200x magnification in 5 randomly chosen fields per section. The data are shown as the means per field ± SD (n = 3–8 mice per genotype per time point). Asterisks represent P < 0.05 in comparison between Keap1+/+ and Keap1+/− mice. (C)Assessment of M-phase hepatocytes. After PH, mice were sacrificed at the indicated time points. Liver sections were stained with hematoxylin and eosin. Hepatocyte mitotic figures indicative of hepatocytes undergoing mitosis were counted at 100x magnification in 5 randomly chosen fields per liver section. The data are shown as the means per field ± SD (n = 3–8 mice per genotype per time point). Asterisks represent P < 0.05 in comparison between the time points indicated in each genotype group of mice.
Nrf2 is not activated during the first hepatic proliferative cycle after PH in wild-type mice
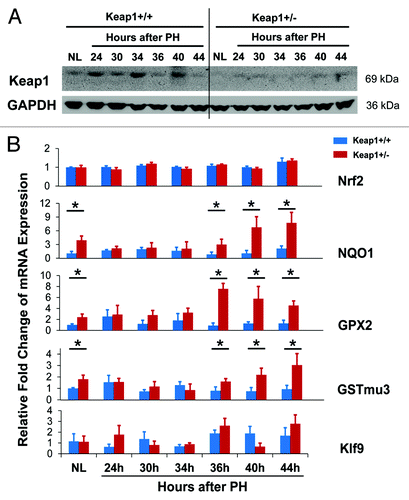
To evaluate the functional state of the Keap1/Nrf2 signaling pathway, we analyzed hepatic protein expression of Keap1 and mRNA expression of Nrf2 and its target genes during the first round of hepatocyte cell cycle after PH (). Nrf2 activity is regulated at multiple levels, including gene transcription, Keap1-dependent and -independent proteasome degradation, kinase-mediated phosphorylation, cytoplasm-nucleus trafficking, and DNA binding.Citation17,Citation18 However, the endpoint for assessing Nrf2 activity is the mRNA levels of Nrf2 target genes. NAD(P)H:quinone oxidoreductase 1 (NQO1), glutathione peroxidase 2 (GPX2), and glutathione S-transferase mu 3 (GSTmu3) are typical direct target genes of Nrf2.Citation19,Citation20 Even during liver injury, NQO1 is solely regulated by Nrf2.Citation21 Thus, the mRNA levels of these genes allowed us to reliably monitor Nrf2 activity. As expected, in comparison with pre-PH Keap1+/+ mice, pre-PH Keap1+/− mice displayed a decrease in hepatic Keap1 protein expression and increases in the levels of hepatic NQO1, GPX2, and GSTmu3 transcripts, indicating Keap1 knockdown effects. This observation is in line with a report.Citation22 In wild-type mice, compared with pre-PH livers, regenerating livers exhibited dynamic alterations in Keap1 protein expression, constant Nrf2 transcript levels, and not significantly changed expression of NQO1, GPX2, and GSTmu3 genes. The data demonstrate that, in wild-type mice subjected to PH, hepatic Nrf2 is not activated and it needs to be kept quiescent and stable when hepatocytes enter and progress through the cell cycle. Moreover, in comparison with wild-type regenerating livers, Keap1+/− regenerating livers expressed less Keap1 protein, equivalent Nrf2 transcripts, and initially (prior to 36 h after PH) unchanged but subsequently (at 36 h post-PH and thereafter) elevated levels of NQO1, GPX2, and GSTmu3 mRNAs. Thus, Keap1 knockdown resulted in dysregulation of Nrf2 activity during liver regeneration. Kruppel-like factor 9 (Klf9) was recently identified as a Nrf2 target gene by Nikiforov’s group. They demonstrated that when intracellular ROS level elevates above a critical threshold, Nrf2 stimulates Klf9 expression, leading to amplification of oxidative stress and thereby cell death.Citation23 We found that hepatic Klf9 expression did not exhibit significant PH-dependent changes in Keap1+/+ mice and there was no significant differences in Klf9 mRNA levels between Keap1+/+ and Keap1+/− mice after PH. The data suggest that although hepatic Nrf2 was activated after 36 h post-PH due to Keap1 knockdown, Nrf2 activity did not surpass a threshold leading to Klf9 upregulation.
Figure 2. (A) Hepatic expression of Keap1 protein during the first wave of hepatocyte proliferation after partial hepatectomy (PH) in Keap1+/+ and Keap1+/− mice. Total liver lysates were prepared from the livers collected at the indicated time points after PH. Western blotting was performed with an antibody against Keap1 protein. Glyceraldehyde 3-phosphate dehydrogenase (GADPH) was used as a loading control. A representative blot of 3 independent experiments is shown. NL, normal liver. (B) Hepatic mRNA expression of Nrf2, NQO1, GPX2, GSTmu3, and Klf9 during the first wave of hepatocyte proliferation after PH in Keap1+/+ and Keap1+/− mice. Total RNA was prepared from liver tissues collected prior to or after PH at the indicated time points. Hepatic mRNA levels for the genes indicated were measured by qRT-PCR and are expressed as the mean fold changes compared with wild-type normal controls ± SD (n = 3 mice per time point per genotype). Asterisks represent P < 0.05 in comparison between Keap1+/+ and Keap1+/− mice.
Keap1 knockdown leads to dysregulation of a subset of cell cycle components during liver regeneration
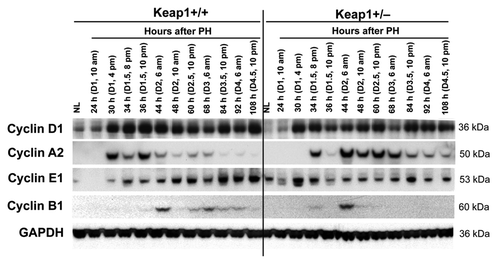
Keap1 knockdown resulted in altered protein expression of hepatic Cyclins D1, A2, E1, and B1 following PH (). Most notably, before 44 h post-PH, the dysregulation of Cyclin A2 protein expression was closely correlated with the disruption of the S phase progression in Keap1+/− regenerating livers (). At 44 h after PH and thereafter, Keap1+/− regenerating livers accumulated excessive Cyclin A2 protein relative to wild-type controls. In addition, after 48 h post-PH, Keap1 knockdown led to prevention of hepatic Cylin B1 protein expression, which was associated with the loss of mitotic rhythm of cycling hepatocytes (). Together, the results demonstrate that Keap1 knockdown causes dysregulation of a subset of cell cycle components, especially Cyclins A2 and B1, during liver regeneration.
Figure 3. Protein expression of a subset of cell cycle components in regenerating livers of Keap1+/+ and Keap1+/− mice. Livers were collected from normal mice and the mice subjected to partial hepatectomy (PH) at the indicated time points after surgery. Western blotting was performed using liver lysates pooled from 3 mice per time point per genotype with antibodies against the proteins indicated. Glyceraldehyde 3-phosphate dehydrogenase (GADPH) was used as a loading control. NL, normal liver.
Keap1 knockdown results in dysregulation of several mitogenic signaling molecules in regenerating livers
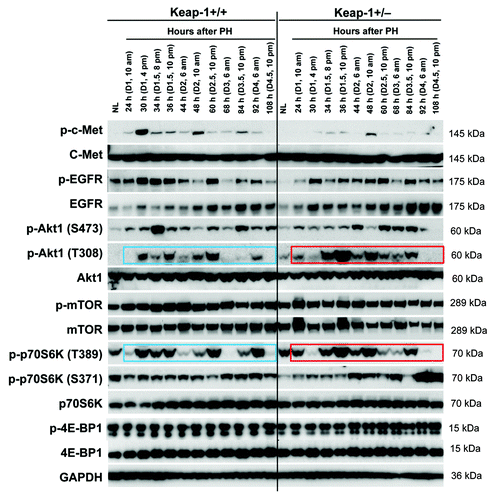
Hepatocyte growth factor (HGF) and epidermal growth factor (EGF) are 2 of the most potent direct mitogens for hepatocytes and act via their receptors c-Met and EGF receptor (EGFR), respectively.Citation24 We found that Keap1 knockdown led to the inhibition of hepatic c-Met phosphorylation throughout the liver regrowth process, most strikingly at 30 h after PH (). In addition, Keap1 knockdown also suppressed hepatic EGFR phosphorylation in the resting state and prior to 44 h post-PH (). Evidence supports the role of Akt/mTOR signaling in controlling the cell cycle progression of proliferative hepatocytes.Citation25 As shown in , Keap1 knockdown disrupted the phosphorylation patterns of hepatic Akt1 at both S473 and T308 and those of p70S6K at both T389 and S371 after PH. Of note, p70S6K phosphorylation at T389 was approximately synchronized with Akt1 phosphorylation at T308, rather than with its known upstream direct regulator mTOR, in both genotypes of mice during the entire course of liver regrowth. This observation strongly suggests that Akt1 and p70S6K directly form a signaling pathway during liver regeneration. Notably, in Keap1+/− mice, at 30 h after PH, the S phase entry delays of replicating hepatocytes () were accompanied by inactivation of hepatic Akt1 (T308) and p70S6K (T389). Collectively, we linked Keap1 to the 4 mitogenic signaling molecules (c-Met, EGFR, Akt1, and p70S6K) in regenerating livers.
Figure 4. Protein expression of a subset of mitogenic signaling molecules in regenerating livers of Keap1+/+ and Keap1+/− mice. Liver lysates were prepared as described in . Western blotting was performed with antibodies against the proteins indicated. GADPH was used as a loading control. Blue and red boxes indicate the similar phosphorylation patterns of p-Akt1 (T308) and p-p70S6K (T389) in Keap1+/+ and Keap1+/− regenerating livers, respectively.
Keap1 knockdown causes disruption in hepatic redox regulation in regenerating livers
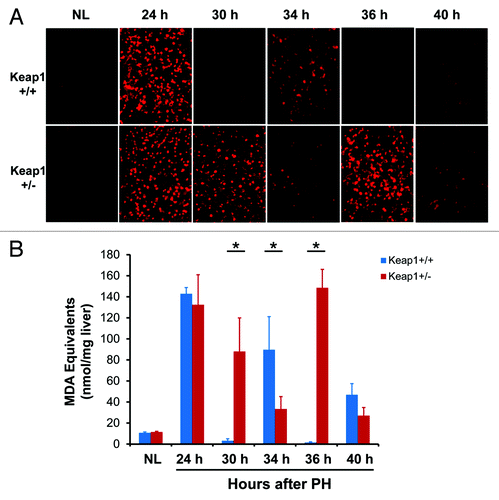
Cell proliferation is tightly coupled with cellular redox homeostasis systems.Citation15 The involvement of the Keap1/Nrf2 signaling system in regulating cellular redox balance prompted us to evaluate the redox states by dihydroethidium (DHE) staining and thiobarbituric acid reactive substances (TBARS) measurement during the first wave of hepatocyte proliferation (). Astonishingly, at 24 h post-PH (G1/S boundary), regenerating livers were in a highly oxidative state. Subsequently, wild-type regenerating livers converted to a reductive state at 30 h post-PH, underwent mildly increased oxidative stress at 34 h, returned to a reductive state at 36 h, and then exhibited more mildly increased oxidative stress at 40 h. The 3 waves of redox fluctuation were conversely relevant with the changes in DNA synthesis activity in wild-type regenerating livers (). Clearly, when the level of oxidative stress was high, DNA synthesis activity was low, and vice versa. These findings demonstrate that normal regenerating livers exhibit strong redox fluctuation, which is coupled with the cell cycle progression of proliferating hepatocytes. Strikingly, Keap1 knockdown elicited a severe destructive effect on hepatic redox regulation, closely correlating with the disruption of hepatocyte S phase progression (). Thus, our data demonstrate that regenerating livers exhibit the redox cycle and Keap1 is a powerful redox cycle modulator.
Figure 5. Hepatic redox states during the first wave of hepatocyte proliferation after partial hepatectomy (PH) in Keap1+/+ and Keap1+/− mice. (A) Liver cryosections prepared from 3 mice per time point per genotype were stained with dihydroethidium (DHE). The DHE was oxidized by hepatic free radicals, which generated 2-hydroxyethidium and ethidium. Ethidium-stained DNA exhibited red fluorescence. Representative photographs of liver sections (400×) were taken using the same contrast and lightness parameters and are shown. (B) Hepatic malondialdehyde (MDA) equivalents were quantified to monitor lipid peroxidation indicative of oxidative stress using a thiobarbituric acid reactive substances (TBARS) assay kit. The data are shown as the means of MDA equivalents (nmol/mg liver) ± SD (n = 3 mice/time point/genotype). Asterisks represent P < 0.05 in comparison between Keap1+/+ and Keap1+/− mice. NL, normal liver.
Keap1 knockdown results in an increase in hepatocyte genome integrity and stability in regenerating livers
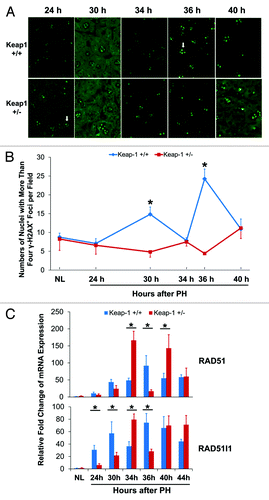
To address a concern as to whether the genome integrity and stability can be maintained in Keap1+/− regenerating hepatocytes exposed to an abnormal redox environment, we assessed DNA damage by quantifying the foci of phosphorylated histone H2AX (γ-H2AX) in hepatocytes (). H2AX is activated (phosphorylated) in response to DNA damage and participates in assembling repair proteins at damaged sites. It is used as a sensitive marker to detect DNA damage in cells, including hepatocytes.Citation26 We found that most hepatocytes in pre-PH livers exhibited 2–4 γ-H2AX+ foci per nucleus. In wild-type regenerating livers, the number of nuclei displaying more than 4 γ-H2AX+ foci in S-phase hepatocytes increased most markedly at 36 h post-PH (DNA synthesis peak), accompanied by peak expression of DNA repair genes RAD51and RAD51-like 1(RAD51l1) (). In contrast, in Keap1+/− regenerating livers, the spontaneous replication-induced DNA damage was completely prevented even at 34 h after PH when DNA synthesis peaked (), and this effect was accompanied by higher expression of hepatic RAD51 and RAD51l1 than wild-type controls at this time point (). These data demonstrate that Keap1 knockdown results in improved hepatocyte genome integrity and stability during hepatocyte DNA replication, which is associated with increased expression of the DNA repair genes RAD51 and RAD51l1.
Figure 6. DNA damage assessments and DNA damage repair gene expression during the first wave of hepatocyte proliferation after partial hepatectomy (PH) in Keap1+/+ and Keap1+/− mice. (A) Immunohistochemistry was performed using the γ-H2A.X antibody with liver sections prepared from regenerating livers at the indicated time points after PH. DyLight 488-conjugated AffiniPure Goat Anti-Mouse IgG was used as a secondary antibody. γ-H2A.X+ foci in hepatocyte nuclei exhibit green fluorescence. Representative nuclei with 4 or more γ-H2A.X+ foci are indicated by arrows. (B) The nuclei with more than 4 γ-H2A.X+ foci were counted in 5 randomly chosen microscope fields (200x) per section. The data are shown as the means per field ± SD (n = 3 mice/time point/genotype). Asterisks represent P < 0.05 in comparison between Keap1+/+ and Keap1+/− mice. (C) Total RNA was prepared from liver tissues collected prior to or after PH at the indicated time points. Hepatic mRNA levels of RAD51 and RAD51l1 were quantified by qRT-PCR and are expressed as the mean fold changes compared with wild-type normal controls ± SD (n = 3 mice per time point per genotype). Asterisks represent P < 0.05 in comparison between Keap1+/+ and Keap1+/− mice.
Discussion
The current study identified Keap1 as a potent regulator of the cell cycle of proliferating hepatocytes during liver regeneration. A reduction in Keap1 expression as a result of the loss of one Keap1 allele results in a delay in S phase entry, disruption of S phase progression, and loss of the mitotic rhythm of replicating hepatocytes during hepatic regrowth following PH. Thus, an appropriate level of Keap1 expression is essential for hepatocytes to progress through the cell cycle in an innate way. On the other hand, Keap1 knockdown leads to increased genome integrity and stability when hepatocytes undergo massive DNA replication in response to liver mass decrease. This may explain, at least in part, why Keap1+/− mice did not exhibit an overt defect in overall hepatic regrowth after PH, despite the disruption in the hepatocyte cell cycle.
Mechanistically, we linked Keap1 to several mitogenic signaling molecules (c-Met, EGFR, Akt1, and p70S6K) and Cyclins A2 and B1. It has been demonstrated that S phase entry is severely suppressed in hepatocytes deficient in c-Met, EGFR, or p70S6K, thereby delaying liver regeneration.Citation25,Citation27,Citation28 However, how Keap1 regulates these signaling molecules remains an open question. To the best of our knowledge, we for the first time linked Keap1 to c-Met activity. In non-small-cell lung cancer cells, Keap1 knockdown reduces the sensitivity to EGFR-tyrosine kinase inhibitors and EGFR phosphorylation activates Nrf2, indicating a cross talk between EGFR and Keap1/Nrf2 signaling pathway.Citation29 It is unclear whether this cross talk also operates in hepatocytes.
In the cell cycle of mammalian cells, Cyclin A2 drives the S phase progression together with Cdk2 and the initiation of chromosome condensation by associating with Cdc2.Citation30-Citation33 Thus, it is highly likely that Cyclin A2 is the major effector underlying the mitogenic signaling and eventually affecting the S phase entry and DNA synthesis in proliferating hepatocytes. It is known that the activity of the Cdc2/Cyclin B complex is essential for M phase entry in mammalian cellsCitation34 and this pathway regulates the timing of hepatocyte mitosis during liver regeneration.Citation13 Moreover, timely degradation of Cyclin A is required for M phase progression.Citation35,Citation36 Therefore, the absence of Cyclin B1 expression and the excessive amount of Cyclin A2 contribute to the loss of the mitotic rhythm after 44 h post-PH in Keap1+/− regenerating livers.
A variety of studies using cultured mammalian cells or yeast demonstrate that proliferating cells progress through the cell cycle in a manner synchronized with the redox cycle. The G1 phase advances in the oxidative state, whereas the S phase and M phase are completed only in the reductive state to ensure the fidelity of replicated DNA.Citation15 To the best of our knowledge, this finding has not been confirmed in vivo in mammals. We discovered for the first time the 3 waves of hepatic redox fluctuation and their coupling with hepatocyte cell cycle progression in regenerating livers. It is astonishing to observe a striking surge of hepatic free radicals at the G1/S boundary (24 h post-PH), followed by 2 additional progressively reduced surges in the S phase, of proliferating hepatocytes during liver regeneration in wild-type mice (). We believe that such unusual redox fluctuation is well tolerated, tightly controlled, and indispensably required by regenerating livers. It is intriguing how regenerating livers produce such a large amount of free radicals. It is our great future interest to investigate the biological significance of this phenomenon. Excessive ROS are deleterious because they damage macromolecules, but increasing evidence supports the role of ROS as signaling molecules.Citation15,Citation37,Citation38 A high ROS level is necessary for the activation of the mitogenic signaling pathways that drive the transcription of cyclin genes.Citation37 ROS transduce molecular signaling by oxidizing the cysteine residues of a number of cell cycle regulators and components in mitogenic signaling cascades. Cysteine oxidation may be as important as phosphorylation in signal transduction.Citation15 However, excessive ROS are deleterious because they damage macromolecules. For example, reactive aldehydes such as malondialdehyde and 4-hydroxynonenal, the end products of ROS-induced lipid peroxidation, damage the cell membrane and even cause DNA mutagenesis and carcinogenesis.Citation39 Thus, there must be a potent mechanism quickly terminating ROS production and thereby lipid peroxidation to avoid detrimental effects of a high level of oxidative stress. It is intriguing how regenerating livers produce such a large amount of free radicals and quickly neutralize them. It is our great future interest to investigate the biological significance of this phenomenon. Our findings demonstrate that PH is an ideal in vivo model to study the redox biology.
The current study also identified Keap1 as a powerful redox modulator. Completely unexpected and contrary to the well-established function of the Keap1/Nrf2 signaling pathway in combating oxidative stress, Nrf2 is not activated while the 3 waves of the redox fluctuation occur in wild-type regenerating livers (). This observation indicates that Nrf2 needs to be kept quiescent when replicating hepatocytes progress through the cell cycle. Apparently, in wild-type mice, elevation of hepatic Keap1 protein expression at 24, 34, and 44 h after PH in response to ROS surge at those time points should prevent Nrf2 from activation ( and ). Keap1 knockdown causes multiple detrimental effects including dysregulation in Nrf2 activity, cyclin expression, mitogenic signaling, and the redox cycling, causing disruption of the cell cycle progression of proliferating hepatocytes. A recent report shows that a constitutively active Nrf2 mutant in hepatocytes does not exhibit any overt beneficial effects on chronic liver injury and impairs PH-induced liver regeneration by delaying hepatocyte proliferation and enhancing hepatocyte apoptosis.Citation40 This report and our finding support a notion that proliferating hepatocytes require prohibition of Nrf2 activation to normally progress through the cell cycle during liver regeneration. Intriguingly, prior to 36 h after PH, hepatic Nrf2 activity did not differ between Keap1+/+ and Keap1+/− mice (), while hepatic Cyclin A2, several mitogenic signaling molecules, and the redox fluctuation exhibited dysregulation due to Keap1 knockdown (, , and ). These observations strongly suggest an additional Nrf2-independent mechanism behind these Keap1-depedent events. Although Nrf2 is the best characterized and primary Keap1 substrate, other Keap1 substrates or interacting proteins have been found, at least including IKKβ, Bcl-2/Bcl-xL, p62/sequestosome-1, and p21.Citation41 Thus, it warrants future studies to elucidate how Keap1 exerts regulatory effects in addition to Nrf2-mediated pathway during liver regeneration. Moreover, we observed that, in Keap1+/− regenerating livers, Nrf2 target genes were upregulated at later stage during the first round of hepatocyte cell cycle, although Keap1 protein levels were reduced throughout this period (). Nrf2 activity is modulated by multiple mechanisms, including transcriptional regulation of Nrf2 gene, miRNA species-mediated control of Nrf2 mRNA, Keap1-mediated Nrf2 proteasome degradation, competition for binding to Keap1, ubiquitin ligase Hrd1-mediated Nrf2 ubiquitylation, kinase-induced posttranslational modification of Nrf2, and competition for binding to ARE.Citation17,Citation42 These mechanisms may operate dynamically to regulate Nrf2 activity during liver regeneration. When Keap1 was knocked down, Nrf2 exhibited quiescence initially but activation later during the first wave of hepatocyte replication after PH. The observation suggests that Keap1 may play a dominant role in the regulatory machinery at later stage of hepatocyte cell cycle.
Of note, Keap1+/− mice used in this study represent a mouse model with Keap1 knockdown globally in all cell types including parenchymal and non-parenchymal cells in the liver. Liver regeneration is a highly orchestrated process which is regulated by numerous factors generated intra- and/or extra-hepatically. Thus, global Keap1 knockdown-induced systemic effects and local effects in non-parenchymal cells in the liver may contribute to Keap1-depedent phenotypes during liver regeneration. Further studies using hepatocyte-specific Keap1 knockdown or knockout mice will not only confirm the findings described in this report but also allow us to precisely evaluate the function of Keap1 in hepatocytes after liver resection. It has been shown that hepatocyte-specific deletion of Keap1 gene leads to chronic activation of Nrf2 and thereby resistance to xenobiotics without overt influence on morphological and physiological integrity of hepatocytes.Citation43 Therefore, it should be an ideal mouse model to further investigate the role of Keap1 in regulating the redox cycle and hepatocyte cell cycle in response to liver mass loss.
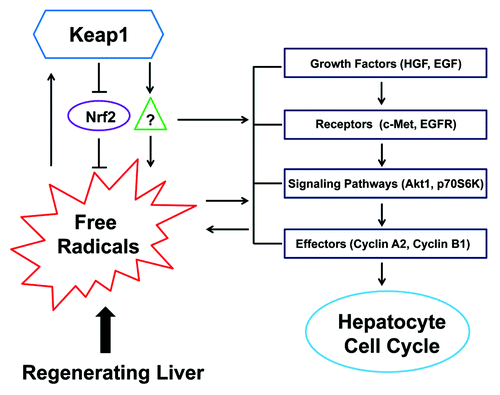
In summary, we demonstrate that proliferating hepatocytes require precisely regulated Keap1 expression to enter and progress through the S phase and exhibit mitotic rhythm during liver regeneration. An appropriate level of Keap1 expression is essential for proper regulation of the redox cycle, the activities of c-Met, EGFR, Akt1, and p70S6K, and the expression of Cyclins A2 and B1 in regenerating livers. Keap1 plays these regulatory roles possibly through both Nrf2-depedent and -independent mechanisms. Further studies are needed to integrate the Keap1 signaling, redox signaling, mitogenic signaling, and cyclin expression into the machinery governing the hepatocyte cell cycle during liver regeneration ().
Figure 7. A hypothesis for Keap1-mediated hepatic redox cycle and hepatocyte cell cycle in regenerating livers. Redox sensor Keap1 modulates the cycle of free radicals produced by regenerating livers by both Nrf2-depedent and -independent mechanisms. Keap1 also regulates the activities of hepatocyte mitogenic signaling molecules, including c-Met, EGFR, Akt1, and p70S6K, and their downstream effectors, including Cyclins A2 and B1. Nrf2 needs to be kept quiescent when hepatocytes are replicating. The threshold of Keap1 expression is tightly controlled to ensure the proper coupling of hepatic redox cycle and hepatocyte cell cycle, thereby enabling hepatocytes to enter and progress through the cell cycle smoothly and rhythmically during liver regeneration.
Materials and Methods
Mice and PH
The mice were housed in plastic cages at 22 ± 1 °C on a 12-h light/12-h dark cycle with lights on from 6:00 AM to 6:00 PM Standard rodent chow and water were provided ad libitum throughout the entire feeding period. Keap1+/− mice with a mixed genetic background of C57BL6/129Sv were purchased from RIKEN BioResource Center of Japan (RBRC01388).Citation16 Wild-type and Keap1+/− male mice (5 to 6-mo-old) were used for the study. Standard PH was performed following a previously described procedure.Citation44 The gall bladders were kept intact. The surgery was performed between 10:00 AM and 12:00 PM All of the animal experiments were conducted in accordance with the National Institutes of Health Guide for the Care and Use of Laboratory Animals. The protocols for the care and use of animals were approved by the Indiana University-Purdue University Indianapolis Animal Care and Use Committee.
Hepatocyte proliferation assessments
One hour before animal sacrifice, 5-bromo-2-deoxyuridine (BrdU) was injected into the mice (100 mg/kg, i.p.). Formalin-fixed and paraffin-embedded liver sections were subjected to Ki-67 or BrdU immunostaining to visualize and count the proliferating hepatocytes or were stained with hematoxylin and eosin to quantify the mitotic figures in hepatocytes. Ki67-postive (200×) or BrdU-positive (200×) hepatocytes and hepatocyte mitotic Figures (100×) were counted in 5 randomly chosen microscope fields per section. Primary antibodies against Ki-67 (Thermo Scientific) or BrdU (#5292, Cell Signaling Technology) were used for immunostaining according to the manufacturer’s instructions.
Western blot analysis
Liver homogenates (10 or 30 µg) were separated by PAGE under reducing conditions. Proteins were electrophoretically transferred from the gels to polyvinylidene difluoride membranes. Antibodies against Cyclin D1 (#2922), Cyclin B1 (#4138), p-p70S6K (T389) (#9234), p-p70S6K (S371) (#9208), p70S6K (#2708), p-4E-BP1 (T37/46) (#2855), 4E-BP1 (#9644), mTOR (#2983), and p-MTOR (S2448) (#5536) (Cell Signaling Technology); against Cyclin A2 (1540–1), Akt1 (#1081–1), p-Akt1 (T308) (#2214–1), p-Akt1 (S473) (#2118–1), epidermal growth factor (EGFR) (#1114–1), and p-EGFR (Y1086) (Epitomics); against c-Met (#47431) and p-c-Met (#5662) (Abcam, Cambridge, MA); and against Cyclin E1 (SC-481), glyceraldehyde 3-phosphate dehydrogenase (GADPH) (SC-25778), and Keap1 (SC-33569) (Santa Cruz Biotechnology) were used as probes. Immune complexes were detected using an enhanced chemiluminescence system (Pierce).
Quantitative real-time polymerase chain reaction (qRT-PCR)
Total RNA was isolated from frozen liver tissue using TRIzol reagent according to the manufacturer’s protocol (Invitrogen). cDNAs were synthesized from the total RNA (1 µg) of each sample using a Verso cDNA Kit (Thermo Scientific), diluted 4 times with water, and subjected to qRT-PCR to quantify mRNA levels. TaqMan Universal PCR Master Mix and the primers and TaqMan MGB probes of mouse Nrf2 (Mm00477786_m1), NQO1 (Mm01253561_m1), GPX2 (Mm00850074_g1), GSTmu3 (Mm00833923_m1), Klf9 (Mm00495172_m1), RAD51 (Mm00487905_m1), RAD51l1 (Mm01302591_m1), and albumin (Mm00802090_m1) were purchased from Applied Biosystems. The amplification reactions were performed with the ABI Prism 7900 sequence detection system (Applied Biosystems) with initial hold steps (50 °C for 2 min followed by 95 °C for 10 min) and 40 cycles of a 2-step PCR (92 °C for 15 s and 60 °C for 1 min). The comparative CT method was used for the relative quantification of the amount of mRNA in each sample normalized to the albumin transcript levels.
Hepatic redox assays
Hepatic superoxide was detected and visualized as described by Zhang et al.Citation45 Liver cryosections (8 μM) were stained with 30 μM dihydroethidium (DHE) for 30 min at 37 °C, followed by rinsing with PBS 3 times. The DHE was oxidized by hepatic free radicals, thus generating 2-hydroxyethidium and ethidium. The red fluorescence elicited by ethidium-stained DNA was visualized using a fluorescence microscope. Photographs of liver sections (400×) were taken using the same contrast and lightness parameters for all the samples. In addition, hepatic thiobarbituric acid reactive substances (TBARS) were quantified using a TBARS assay kit (ZeptoMetrix Corporation) according to the manufacturer’s instructions. The TBARS measurement was used to monitor lipid peroxidation, a major indicator of oxidative stress. In brief, 50 mg of liver tissue per mouse was homogenized in 300 μl of ice-cold PBS. Sixty microliters of each liver homogenate was added to each reaction. The absorbance of the liver homogenate was measured at 532 nm after incubation at 95 °C for 60 min. TBARS were quantified as malondialdehyde (MDA) equivalents using a MDA standard curve.
DNA damage measurements
Immunohistochemistry was performed using an antibody against phosphorylated histone H2A.X (γ-H2AX) (S139) (#05–636, Millipore) with formalin-fixed and paraffin-embedded liver sections. DyLight 488-conjugated AffiniPure Goat Anti-Mouse IgG (#115–485–174, Jackson ImmunoResearch Laboratories) was used as a secondary antibody. The nuclei with more than 4 γ-H2AX-positive foci were counted in 5 randomly chosen microscope fields (200×) per section.
Statistical analysis
The data are shown as the means ± standard deviation (SD). Statistical analysis was performed using a one-way analysis of variance or Student t test. Significant differences were defined when P < 0.05.
| Abbreviation: | ||
| BrdU | = | 5-bromo-2-deoxyuridine |
| DHE | = | dihydroethidium |
| EGF | = | epidermal growth factor |
| EGFR | = | epidermal growth factor receptor |
| GADPH | = | glyceraldehyde 3-phosphate dehydrogenase |
| GPX2 | = | glutathione peroxidase 2 |
| GSTmu3 | = | glutathione S-transferase mu 3 |
| Keap1 | = | Actin-binding Kelch-like ECH-associated protein 1 |
| Klf9 | = | Kruppel-like factor 9 |
| MDA | = | malondialdehyde |
| Nrf2 | = | nuclear factor erythroid 2-related factor 2 |
| NQO1 | = | NAD(P)H:quinone oxidoreductase 1 |
| PH | = | partial hepatectomy |
| TBARS | = | thiobarbituric acid reactive substances |
Additional material
Download Zip (4.9 MB)Disclosure of Potential Conflicts of Interest
No potential conflicts of interest were disclosed.
Acknowledgment
This work was supported by a grant from the National Institute of Diabetes and Digestive and Kidney Diseases (7RO1DK07596).
References
- Mitsuishi Y, Motohashi H, Yamamoto M. The Keap1-Nrf2 system in cancers: stress response and anabolic metabolism. Front Oncol 2012; 2:200; http://dx.doi.org/10.3389/fonc.2012.00200; PMID: 23272301
- Taguchi K, Motohashi H, Yamamoto M. Molecular mechanisms of the Keap1–Nrf2 pathway in stress response and cancer evolution. Genes Cells 2011; 16:123 - 40; http://dx.doi.org/10.1111/j.1365-2443.2010.01473.x; PMID: 21251164
- Sun Z, Zhang S, Chan JY, Zhang DD. Keap1 controls postinduction repression of the Nrf2-mediated antioxidant response by escorting nuclear export of Nrf2. Mol Cell Biol 2007; 27:6334 - 49; http://dx.doi.org/10.1128/MCB.00630-07; PMID: 17636022
- Velichkova M, Hasson T. Keap1 regulates the oxidation-sensitive shuttling of Nrf2 into and out of the nucleus via a Crm1-dependent nuclear export mechanism. Mol Cell Biol 2005; 25:4501 - 13; http://dx.doi.org/10.1128/MCB.25.11.4501-4513.2005; PMID: 15899855
- Wakabayashi N, Skoko JJ, Chartoumpekis DV, Kimura S, Slocum SL, Noda K, Palliyaguru DL, Fujimuro M, Boley PA, Tanaka Y, et al. Notch-Nrf2 axis: regulation of Nrf2 gene expression and cytoprotection by notch signaling. Mol Cell Biol 2014; 34:653 - 63; PMID: 24298019
- Lau A, Wang XJ, Zhao F, Villeneuve NF, Wu T, Jiang T, Sun Z, White E, Zhang DD. A noncanonical mechanism of Nrf2 activation by autophagy deficiency: direct interaction between Keap1 and p62. Mol Cell Biol 2010; 30:3275 - 85; http://dx.doi.org/10.1128/MCB.00248-10; PMID: 20421418
- Huang HC, Nguyen T, Pickett CB. Phosphorylation of Nrf2 at Ser-40 by protein kinase C regulates antioxidant response element-mediated transcription. J Biol Chem 2002; 277:42769 - 74; http://dx.doi.org/10.1074/jbc.M206911200; PMID: 12198130
- Beyer TA, Xu W, Teupser D, auf dem Keller U, Bugnon P, Hildt E, Thiery J, Kan YW, Werner S. Impaired liver regeneration in Nrf2 knockout mice: role of ROS-mediated insulin/IGF-1 resistance. EMBO J 2008; 27:212 - 23; http://dx.doi.org/10.1038/sj.emboj.7601950; PMID: 18059474
- Wakabayashi N, Shin S, Slocum SL, Agoston ES, Wakabayashi J, Kwak MK, Misra V, Biswal S, Yamamoto M, Kensler TW. Regulation of notch1 signaling by nrf2: implications for tissue regeneration. Sci Signal 2010; 3:ra52; http://dx.doi.org/10.1126/scisignal.2000762; PMID: 20628156
- Michalopoulos GK. Liver regeneration after partial hepatectomy: critical analysis of mechanistic dilemmas. Am J Pathol 2010; 176:2 - 13; http://dx.doi.org/10.2353/ajpath.2010.090675; PMID: 20019184
- Mitchell C, Willenbring H. A reproducible and well-tolerated method for 2/3 partial hepatectomy in mice. Nat Protoc 2008; 3:1167 - 70; http://dx.doi.org/10.1038/nprot.2008.80; PMID: 18600221
- Fausto N, Campbell JS, Riehle KJ. Liver regeneration. Hepatology 2006; 43:Suppl 1 S45 - 53; http://dx.doi.org/10.1002/hep.20969; PMID: 16447274
- Matsuo T, Yamaguchi S, Mitsui S, Emi A, Shimoda F, Okamura H. Control mechanism of the circadian clock for timing of cell division in vivo. Science 2003; 302:255 - 9; http://dx.doi.org/10.1126/science.1086271; PMID: 12934012
- Zou Y, Bao Q, Kumar S, Hu M, Wang GY, Dai G. Four waves of hepatocyte proliferation linked with three waves of hepatic fat accumulation during partial hepatectomy-induced liver regeneration. PLoS One 2012; 7:e30675; http://dx.doi.org/10.1371/journal.pone.0030675; PMID: 22319576
- Chiu J, Dawes IW. Redox control of cell proliferation. Trends Cell Biol 2012; 22:592 - 601; http://dx.doi.org/10.1016/j.tcb.2012.08.002; PMID: 22951073
- Wakabayashi N, Itoh K, Wakabayashi J, Motohashi H, Noda S, Takahashi S, Imakado S, Kotsuji T, Otsuka F, Roop DR, et al. Keap1-null mutation leads to postnatal lethality due to constitutive Nrf2 activation. Nat Genet 2003; 35:238 - 45; http://dx.doi.org/10.1038/ng1248; PMID: 14517554
- Hayes JD, Dinkova-Kostova AT. The Nrf2 regulatory network provides an interface between redox and intermediary metabolism. Trends Biochem Sci 2014; 39:199 - 218; http://dx.doi.org/10.1016/j.tibs.2014.02.002; PMID: 24647116
- Marinho HS, Real C, Cyrne L, Soares H, Antunes F. Hydrogen peroxide sensing, signaling and regulation of transcription factors. Redox Biol 2014; 2:535 - 62; http://dx.doi.org/10.1016/j.redox.2014.02.006; PMID: 24634836
- Chan K, Han XD, Kan YW. An important function of Nrf2 in combating oxidative stress: detoxification of acetaminophen. Proc Natl Acad Sci U S A 2001; 98:4611 - 6; http://dx.doi.org/10.1073/pnas.081082098; PMID: 11287661
- Singh A, Rangasamy T, Thimmulappa RK, Lee H, Osburn WO, Brigelius-Flohé R, Kensler TW, Yamamoto M, Biswal S. Glutathione peroxidase 2, the major cigarette smoke-inducible isoform of GPX in lungs, is regulated by Nrf2. Am J Respir Cell Mol Biol 2006; 35:639 - 50; http://dx.doi.org/10.1165/rcmb.2005-0325OC; PMID: 16794261
- Aleksunes LM, Slitt AL, Maher JM, Dieter MZ, Knight TR, Goedken M, Cherrington NJ, Chan JY, Klaassen CD, Manautou JE. Nuclear factor-E2-related factor 2 expression in liver is critical for induction of NAD(P)H:quinone oxidoreductase 1 during cholestasis. Cell Stress Chaperones 2006; 11:356 - 63; http://dx.doi.org/10.1379/CSC-217.1; PMID: 17278884
- Taguchi K, Maher JM, Suzuki T, Kawatani Y, Motohashi H, Yamamoto M. Genetic analysis of cytoprotective functions supported by graded expression of Keap1. Mol Cell Biol 2010; 30:3016 - 26; http://dx.doi.org/10.1128/MCB.01591-09; PMID: 20404090
- Zucker SN, Fink EE, Bagati A, Mannava S, Bianchi-Smiraglia A, Bogner PN, Wawrzyniak JA, Foley C, Leonova KI, Grimm MJ, et al. Nrf2 amplifies oxidative stress via induction of Klf9. Mol Cell 2014; 53:916 - 28; http://dx.doi.org/10.1016/j.molcel.2014.01.033; PMID: 24613345
- Michalopoulos GK. Liver regeneration. J Cell Physiol 2007; 213:286 - 300; http://dx.doi.org/10.1002/jcp.21172; PMID: 17559071
- Espeillac C, Mitchell C, Celton-Morizur S, Chauvin C, Koka V, Gillet C, Albrecht JH, Desdouets C, Pende M. S6 kinase 1 is required for rapamycin-sensitive liver proliferation after mouse hepatectomy. J Clin Invest 2011; 121:2821 - 32; http://dx.doi.org/10.1172/JCI44203; PMID: 21633171
- Lin T, Ibrahim W, Peng CY, Finegold MJ, Tsai RY. A novel role of nucleostemin in maintaining the genome integrity of dividing hepatocytes during mouse liver development and regeneration. Hepatology 2013; 58:2176 - 87; http://dx.doi.org/10.1002/hep.26600; PMID: 23813570
- Natarajan A, Wagner B, Sibilia M. The EGF receptor is required for efficient liver regeneration. Proc Natl Acad Sci U S A 2007; 104:17081 - 6; http://dx.doi.org/10.1073/pnas.0704126104; PMID: 17940036
- Borowiak M, Garratt AN, Wüstefeld T, Strehle M, Trautwein C, Birchmeier C. Met provides essential signals for liver regeneration. Proc Natl Acad Sci U S A 2004; 101:10608 - 13; http://dx.doi.org/10.1073/pnas.0403412101; PMID: 15249655
- Yamadori T, Ishii Y, Homma S, Morishima Y, Kurishima K, Itoh K, Yamamoto M, Minami Y, Noguchi M, Hizawa N. Molecular mechanisms for the regulation of Nrf2-mediated cell proliferation in non-small-cell lung cancers. Oncogene 2012; 31:4768 - 77; http://dx.doi.org/10.1038/onc.2011.628; PMID: 22249257
- den Elzen N, Pines J. Cyclin A is destroyed in prometaphase and can delay chromosome alignment and anaphase. J Cell Biol 2001; 153:121 - 36; http://dx.doi.org/10.1083/jcb.153.1.121; PMID: 11285279
- Furuno N, den Elzen N, Pines J. Human cyclin A is required for mitosis until mid prophase. J Cell Biol 1999; 147:295 - 306; http://dx.doi.org/10.1083/jcb.147.2.295; PMID: 10525536
- Gong D, Pomerening JR, Myers JW, Gustavsson C, Jones JT, Hahn AT, Meyer T, Ferrell JE Jr.. Cyclin A2 regulates nuclear-envelope breakdown and the nuclear accumulation of cyclin B1. Curr Biol 2007; 17:85 - 91; http://dx.doi.org/10.1016/j.cub.2006.11.066; PMID: 17208191
- Malumbres M, Barbacid M. Mammalian cyclin-dependent kinases. Trends Biochem Sci 2005; 30:630 - 41; http://dx.doi.org/10.1016/j.tibs.2005.09.005; PMID: 16236519
- Fisher D, Krasinska L, Coudreuse D, Novák B. Phosphorylation network dynamics in the control of cell cycle transitions. J Cell Sci 2012; 125:4703 - 11; http://dx.doi.org/10.1242/jcs.106351; PMID: 23223895
- Sullivan M, Morgan DO. Finishing mitosis, one step at a time. Nat Rev Mol Cell Biol 2007; 8:894 - 903; http://dx.doi.org/10.1038/nrm2276; PMID: 17912263
- Parry DH, O’Farrell PH. The schedule of destruction of three mitotic cyclins can dictate the timing of events during exit from mitosis. Curr Biol 2001; 11:671 - 83; http://dx.doi.org/10.1016/S0960-9822(01)00204-4; PMID: 11369230
- Burhans WC, Heintz NH. The cell cycle is a redox cycle: linking phase-specific targets to cell fate. Free Radic Biol Med 2009; 47:1282 - 93; http://dx.doi.org/10.1016/j.freeradbiomed.2009.05.026; PMID: 19486941
- Menon SG, Goswami PC. A redox cycle within the cell cycle: ring in the old with the new. Oncogene 2007; 26:1101 - 9; http://dx.doi.org/10.1038/sj.onc.1209895; PMID: 16924237
- Marnett LJ. Lipid peroxidation-DNA damage by malondialdehyde. Mutat Res 1999; 424:83 - 95; http://dx.doi.org/10.1016/S0027-5107(99)00010-X; PMID: 10064852
- Köhler UA, Kurinna S, Schwitter D, Marti A, Schäfer M, Hellerbrand C, Speicher T, Werner S. Activated Nrf2 impairs liver regeneration in mice by activation of genes involved in cell cycle control and apoptosis. Hepatology 2013; http://dx.doi.org/10.1002/hep.26964; PMID: 24310875
- Tian H, Zhang B, Di J, Jiang G, Chen F, Li H, Li L, Pei D, Zheng J. Keap1: one stone kills three birds Nrf2, IKKβ and Bcl-2/Bcl-xL. Cancer Lett 2012; 325:26 - 34; http://dx.doi.org/10.1016/j.canlet.2012.06.007; PMID: 22743616
- Wu T, Zhao F, Gao B, Tan C, Yagishita N, Nakajima T, Wong PK, Chapman E, Fang D, Zhang DD. Hrd1 suppresses Nrf2-mediated cellular protection during liver cirrhosis. Genes Dev 2014; 28:708 - 22; http://dx.doi.org/10.1101/gad.238246.114; PMID: 24636985
- Okawa H, Motohashi H, Kobayashi A, Aburatani H, Kensler TW, Yamamoto M. Hepatocyte-specific deletion of the keap1 gene activates Nrf2 and confers potent resistance against acute drug toxicity. Biochem Biophys Res Commun 2006; 339:79 - 88; http://dx.doi.org/10.1016/j.bbrc.2005.10.185; PMID: 16293230
- Greene AK, Puder M. Partial hepatectomy in the mouse: technique and perioperative management. J Invest Surg 2003; 16:99 - 102; http://dx.doi.org/10.1080/08941930390194424; PMID: 12746193
- Zhang YK, Wu KC, Klaassen CD. Genetic activation of Nrf2 protects against fasting-induced oxidative stress in livers of mice. PLoS One 2013; 8:e59122; http://dx.doi.org/10.1371/journal.pone.0059122; PMID: 23527105
