Abstract
Cell cycle alterations are fundamental to many physiological processes but their detection has proven difficult when cells are in the context of a tissue structure. Here we describe an easy, rapid and optimization-free procedure for obtaining high resolution cell cycle profiles from nearly all tissue types derived from mouse, human and sheep. Using a standardized and non-enzymatic procedure that is universally suitable for soft, solid and epithelial tissues alike, we reproducibly obtain cell cycle profiles of highest quality with half peak coefficients of variation below 2.0. We are able to reduce preparation-derived debris to almost zero and efficiently exclude doublets, but retain multinucleated cells and apoptotic subG1-fragments. Applying this technique, we determine DNA-indices as small as 1.09 in tumor samples containing large necrotic areas and follow ploidy changes within different sections of individual tumors. Moreover, we examine tissue-specific cell cycle arrest and apoptosis as an in vivo stress response caused by radiation of mice. This method significantly improves the quality of DNA content analysis in tissues and extends the spectrum of applications. It allows assessing changes in ploidy, cell cycle distribution and apoptosis/necrosis in vivo and should be instrumental in all research that involves experimental animal models and/or patient biopsies.
Introduction
Alterations in cell cycle distribution and changes in cellular DNA content are associated with a variety of normal and pathological physiological processes including growth, development and ageing, responses to infection, DNA damage and drugs, as well as cancer.Citation1–Citation4 Thus, cell cycle analysis not only constitutes a specific field of research on its own but also contributes important information to many areas within biological and medical sciences. Generally, monitoring DNA contents of a large number of cells is best performed using flow cytometry.Citation5 Here, DNA-intercalating dyes such as propidium iodide (PI), 4′,6-diamidino-2-phenylindole (DAPI) or 7-aminoactinomycin D (7-AAD) produce a fluorescence signal proportional to the amount of DNA, which is detected by the cytometer. Accordingly, measurement of fluorescence intensity per cell allows discrimination of cells from the various phases of the cell cycle (G0/G1, S, G2/M) and quantification of the percentages of polyploid cells as well as apoptotic/necrotic cell fragments with DNA contents smaller than 2N (subG1-fragments). Additionally, aberrant DNA contents (aneuploidy), a characteristic of many cancer cells,Citation4 can be identified.
Indicative of high-quality cell cycle analysis is the lack of preparation-derived DNA-containing cell debris and a good separation of distinct populations (high resolution). This is reflected by low (half peak) coefficients of variation (HPCVs and CVs) of the most prominent 2N (G0/G1) peak. While values below 6% are acceptable, values of 3% or lower provide optimal resolution.Citation5 Absolutely crucial to high-quality cell cycle analysis is sample preparation, which must efficiently separate cells but leave nuclei intact. Achieving both aims concomitantly has proven particularly challenging for solid and epithelial tissues due to tissue structure. As a matter of fact, only a few procedures to process tissues for cell cycle analysis have been reported.Citation6–Citation11 The majority of these procedures were developed for specific tissues and achieved cell separation by combinations of mechanical, enzymatic and chemical processes. Consequently, their application requires careful sample specific optimization and—due to the complexity of sample treatments—frequently involves difficulties with respect to reproducibility. Other protocols are based on isolation of nuclei.Citation9–Citation11 This generally improves CVs but is intrinsically coupled to loss of mitotic, multinucleated or apoptotic and necrotic cells, because these cells lack an intact nuclear envelope/membrane that could protect their DNA from being washed out during sample preparation.Citation5 Therefore, protocols relying on the isolation of nuclei are not applicable to address certain biological questions, in particular those dealing with cellular stress responses, because such responses frequently involve cell cycle arrest in G2/M and apoptosis.Citation12 In addition, for lack of a suitable methodology, several small tissues, including mammary gland tissue of mice, have, to the best of our knowledge, not been accessible to cell cycle analysis at all. Due to technical limitations, cell cycle analysis has thus been primarily restricted to ex vivo tissue culture settings or easy-to-disperse tissues such as bone marrow. The fact that in vivo settings, in particular transgenic animal models, have become increasingly important in research renders this limitation particularly unsatisfactory.
To overcome these limitations, we have established a procedure that meets the following requirements which have not been combined before: (1) it is generally suited to process fresh or nitrogen-frozen samples of diverse tissue types (solid, soft, epithelial) without tissue- or species-specific adjustments or the need for further optimization; (2) it results in reproducible, high resolution cell cycle profiles with HPCVs below 2.0; (3) preparation-derived nuclei fragmentation is largely avoided, enabling the specific detection of necrotic and apoptotic cell fragments; (4) it is easy and rapid to perform with the option of storing samples for extended periods prior to measurement; and (5) cell aggregates are efficiently separated but multinucleated cells, as well as apoptotic and necrotic subG1-fragments, are retained.
In this paper, we describe this method, exemplify its versatility in different settings and highlight possible applications.
Results
Sample preparation, gating and acquisition of cell cycle profiles.
We aimed at establishing a general and optimization-free procedure to prepare various tissues for high-quality cell cycle analysis. In order to overcome the needs of further tissue specific optimization and to avoid the loss of mitotic and apoptotic cells we focused on developing a cell dispersal procedure that does not involve chemical lysis, nuclear isolation or enzymatic digestion. Instead, tissue dispersal is achieved by an easy two-step mechanical process that is applicable to all tissue types except bone. Basically, tissues are pressed through cell strainers of two different pore sizes directly into buffer, resulting in single cell suspensions that can be fixed in 80% ethanol or methanol (; for details, please refer to Materials and Methods). After fixation, samples can be conveniently stored for several months, if not years, at −20°C, before being stained with propidium iodide and analyzed. Notably, the critical preparation steps prior to fixation can be performed within approximately 20 min per four samples (including 6 min centrifugation) allowing quick processing of even a large number of samples ().
To assess the quality of our preparation, we recorded and included subG1-fragments in all of our analyses. Doublets and higher cell aggregates were excluded by the established method of setting a gate in the FL3-area versus FL3-peak histogram ().Citation13 Thus, doublets are easily excluded from analysis, but multinucleated/polyploid cells such as those in liver, are retained (). When applied to a variety of other murine tissues, our procedure reproducibly results in cell cycle profiles with excellent low HPCVs/CVs for the G0/G1 peak, regardless of whether snap-frozen or fresh specimens were used ( and data not shown). Significantly, profiles display very little, if any, preparation-derived subG1-fragments thus demonstrating the gentleness of our procedure. Indeed, too much mechanical agitation of cells, in particular when combined with freezing and thawing of samples, may result in destruction of the plasma membrane, disruption of nuclei and release of chromosomes from mitotic cells, leading to generation of large amounts of cell debris and preparation-derived subG1-fragments that are not related to apoptosis or other physiological processes. However, the absence of subG1-fragments () clearly proves that our method leaves nuclei intact; therefore, it should be suited to specifically assess apoptosis by means of detecting subG1 fragments. Indeed, microscopic examination confirmed that all nuclei remained intact and undamaged irrespective of the tissue type and regardless of whether they were obtained from fresh or frozen samples (data not shown). Moreover, when prepared from fresh tissue samples and examined prior to fixation, the majority of cells in the single cell suspension are still able to exclude trypan blue, indicating the integrity of the plasma membrane. However, it should be noted that the percentage of whole intact cells may vary significantly (∼55–90%) depending on the tissue type.
The high resolution and absence of preparation-derived subG1-fragments achieved with our preparation method supports also the clear presentation of the three distinct haploid male germ cell populations (from left to right: elongated, elongating and round spermatids) that are present in testis.Citation14 Importantly, although developed and optimized with murine tissue, our protocol can be applied without any alterations to specimens from other species as demonstrated for normal human breast tissue and organs from a sheep (). Thus, it may be used in clinical settings and in research studies investigating non-rodent model organisms as well. In summary, our protocol allows the quick and easy processing of any tissue, except bone, for high resolution cell cycle analysis in a non-enzymatic and optimization-free manner.
Analysis of aneuploidy and tissue homo-heterogeneity.
While cells derived from tissue of healthy animals/patients are mostly expected to have a uniformly diploid DNA content, aberrant (aneuploid) DNA content is a hallmark of many cancers and indicative of genomic instability.Citation4 For detection and quantification of even subtle changes in ploidy great accuracy and high resolution are essential. Ploidy measurements can provide useful information for the characterization of experimental tumor models and, in clinical settings, have been considered of prognostic value.Citation15–Citation18 However, necrotic areas, frequently present in tumors, severely affect peak discrimination and impair the accurate determination of subtle ploidy alterations due to substantial amounts of DNA containing cell debris (signal noise). Given the excellent resolution obtained with our method in normal tissue we reasoned that we may be able to detect subtle ploidy alterations in heterogeneous tumors even in the presence of large necrotic parts. This would provide a substantial advantage over other previously described protocols, because it would allow processing crude specimens without nuclei isolation or clearing them from necrotic parts by other means.
To test our protocol for suitability we applied it on tissue samples from several mammary carcinoma specimen derived from transgenic mice that overexpress the large T-Antigen of Simian Virus 40 (SV40 T-Ag) in their mammary epithelial cells.Citation19 In these mice, SV40 T-Ag induces the development of mammary carcinoma associated with genomic instability and aneuploidy.Citation20 Histopathology of such specimens sometimes reveals a highly heterogenous organization with the carcinoma consisting of necrotic and several differentiated and undifferentiated areas (). Such heterogeneity is also reflected in cell cycle profiles which show a high degree of aneuploidy with huge differences among individual tumors (). Multiple individual peaks within a cell cycle profile represent individual tumor cell clones with different ploidy, whereas subG1-populations mainly ref lect necrotic parts. Very close but distinct peaks illustrate the excellent resolution obtained by our method which is therefore suited to detecting subtle changes in ploidy and to calculating DNA indices as low as 1.09 (, sample 1) even in the context of massive necrosis. If desired, clarity of the results can be further enhanced by using appropriate software such as, for example, MultiCycle, that removes DNA-containing cell debris from cell cycle profiles by a compensation algorithm. Alternatively, single cell suspensions may also be purified and cell debris be removed by treatment with trypsin and DNAse A when the analysis is to be performed on fresh tissue samples.Citation21
Extending such ploidy analysis, we determined the extent of homo-/heterogeneity within individual tumor specimens. This is possible because only a considerably small piece of tissue is required (see Materials and Methods for details). By analyzing six different adjacent sections through a tumor we follow the spatial distribution of individual distinct cell clones, defined by their ploidy. For the SV40 T-Ag overexpressing mammary carcinoma sample (we chose a particularly heterogenous specimen), the sections differ significantly and reveal different hyperdiploid cell clones as being dominant in different sections (). In contrast, the enlarged spleen and the brain of a p53-null mouse (deficient for the tumor suppressor gene Trp53) that spontaneously developed multiple tumors appear homogenous without significant variation among different sections (). Such data not only furnish information on homo-/heterogeneity of a tissue per se, but, in combination with other analyses, such as histopathology, microarray expression analysis or comparative genomic hybridization (CGH) assays, can contribute significantly to their proper interpretation and validation. Importantly, our method can be applied as a quick pre-scan testing whether a tumor specimen of interest is of sufficient homogeneity before being analyzed in more expensive array analyses.
Analysis of cell cycle arrest and apoptosis in vivo.
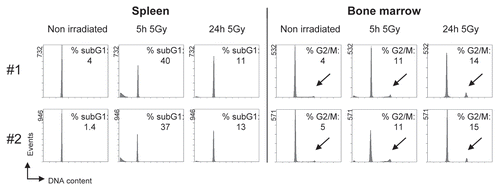
Next, we determined whether we could observe changes in cell cycle distribution resulting from in vivo treatment of animals with genotoxic stress. Despite numerous studies addressing tissue- specific stress responses,Citation21 in vivo cell cycle analysis has not previously been performed in this context, presumably due to methodological limitations. Previous ex vivo gamma irradiation studies of murine splenocytes have shown that these cells undergo apoptosis, a process associated with chromatin degradation.Citation22,Citation23 To assess in vivo responses, we applied 5 Gy whole-body gamma irradiation to living mice, culled the animals at different time points after irradiation and subjected their spleens to cell cycle analysis following our protocol. For each time point, we independently processed and analyzed at least two animals. Significantly, 5 hours post-irradiation, the G0/G1 cell population declined while subG1 cell fragments accumulated (). Such subG1-fragments, whose percentage reached 38.5% (±1.5%), represent apoptotic cells as was confirmed by Annexin-V-staining and the presence of cleaved caspase-3 (data not shown). Twenty four hours post-irradiation, subG1-fragments had largely disappeared and were presumably removed by the immune system of the animal. Notably, the kinetics and percentage of radiation-induced subG1-fragments show very high reproducibility despite the fact that each cell cycle profile was derived from a different individual animal. In bone marrow cells derived from the same mice, accumulation of apoptotic subG1-fragments occurs only to a minor extent, whereas the most prominent effect is accumulation of cells with a 4N DNA-content. This is consistent with a G2-arrest as biological stress response. Again, the effect was very reproducible, being observed in two different sets of animals. Collectively, our method allows for the first time to reproducibly assess various cell cycle effects including induction of apoptosis and cell cycle arrest as a measure of an in vivo stress response in different organs.
Discussion
Here, we present an easy and general procedure that allows the reproducible assessment of subtle cell cycle and ploidy alterations in various tissues in vivo. Key advantages of our method compared to previously reported procedures are that it is easy and quick to perform, results in highly reproducible cell cycle profiles with excellent low CVs/HPCVs and, most significantly, it is universally suited to all different tissue types without tissue- or species-specific adaptation or further optimization. Indeed, our method is the first that allows processing of all tissues and organs in exactly the same manner and thus should be of great value for the comprehensive and fail-safe examination of experimental animal models and patient biopsies. In contrast, previously described protocols were designed for specific tissues and/or achieved cell separation by combinations of mechanical, enzymatic (pepsin, trypsin) and chemical processes (acetic acid). Therefore, they required several sample-specific optimization steps and were considerably onerous and time-consuming. Instead, our protocol uses an easy two-step mechanical approach to disperse tissue. Although stunningly simple and quick, this approach turned out to work well for all tested tissues, resulting in excellent low CV/HPCV values that outperform most previously reported data. Notably, our method delivers superior resolution also for tissues such as heart, femoral muscle, preputial gland or mammary gland tissue of mice that, previously, were barely accessible to cell cycle analysis at all. Thus, the protocol described here extends possible applications of DNA content analysis in tissues and improves their overall quality.
Our technique can be applied to the analysis of many biologically and medically relevant topics. Possible applications comprise testing of pharmaceutically active compounds or environmental hazards as well as the characterization of patient biopsies or experimental disease models with defects in pathways that control proliferation, DNA repair or apoptosis. Notably, although cell cycle arrest in G1 or G2/M is considered as a pivotal mechanism in stress responses and tumor suppression,Citation24 very little is known about its in vivo occurrence and coordination with DNA repair and apoptosis in various tissues and organs. Using our method, we have demonstrated that cell cycle arrest and apoptotic DNA fragmentation can be measured simultaneously in vivo (). To the best of our knowledge, this is the first demonstration of apoptotic cell fragments with subG1 DNA content being present under physiological conditions in an organism in vivo. Such measurements are only possible, because our procedure is not based on the isolation of nuclei and is gentle enough to avoid preparation-induced generation of DNA fragments that would give a false-positive apoptotic signal. Together, our method allows the acquisition of several pieces of information (ploidy, cell cycle distribution, apoptosis/necrosis) at the same time that previously had to be obtained by separate assays. Given the numerous possible applications and the fact that no sophisticated equipment other than a cytometer with a standard 488 nm laser is required, we believe that this method can be easily established in any laboratory with access to a cytometer and has the potential to become a standard method in the analysis of experimental animal models and patient biopsies.
Materials and Methods
Tissue sources.
A variety of fresh and frozen mouse tissues were used in this study. These were derived from C57/BL6J (wild-type and p53-/-) mice (Jackson Laboratory). Mammary carcinoma originated from transgenic Balb/c WAP-T mice.Citation19 H&E staining, pathology and tumor grading was carried out as described elsewhere.Citation20 All mice were housed and handled in accordance with official regulations for care and use of laboratory animals. For the irradiation experiments, mice were subjected to a whole-body radiation dose of 5 Gy using an open Cs137 source. Animals were sacrificed at indicated times after irradiation by cervical dislocation and dissected. Isolated tissues were either processed immediately or snap-frozen in liquid nitrogen. Intestine was cut into 2–5 cm long pieces, rinsed and cleaned with PBS prior to freezing/processing. Normal non-pathological human breast tissue was obtained from reduction mammoplasty of female patients with institutional ethics committee approval and informed donor consent. Breast tissue specimens, snap-frozen in liquid nitrogen, were generously provided by Dr. Lily Huschtscha. Fresh sheep tissue was collected from an abattoir, snap-frozen and generously provided by Lia Moshkanbaryans. Approval for manipulation of mice and human tissue was granted by the appropriate institutional ethics committees.
Cell dispersal and fixation.
Apart from bone marrow, all tissues were treated in exactly the same way. Tissue samples, previously snap-frozen in liquid nitrogen, were thawed in cold PBS/EDTA [PBS (pH 7.4), containing 0.1% (w/v) EDTA] (approx 1–3 min). Small pieces (about 3 × 3 × 3 mm) of such thawed or fresh specimens were mechanically dispersed, sequentially using 100 µm and 35 µm nylon cell strainers (BD Falcon #352360 and #352235). Tissue was first pressed through the 100 µm mesh using the plunger of a 5 ml syringe. Importantly, the mesh was placed in a tissue culture dish containing some PBS/EDTA, such that the bottom of the mesh was in contact with the surface of the liquid. This configuration allows the cells to be immediately released into buffer. The mesh was then rinsed several times with 4°C cold PBS/EDTA. The resulting cell suspension (2–5 ml) was filtered through 35 µm cell strainers and the total volume was adjusted with PBS/EDTA to 15 ml per sample. Resulting cell suspensions can be kept on ice for up to 20 minutes while other tissue samples are being processed. After centrifugation (310 g; 4°C; 6 min) and removal of the supernatant, the cell pellet was suspended in 0.5 ml 4°C cold PBS/EDTA. Five ml −20°C cold 80% ethanol or methanol was added drop-wise under constant, gentle vortexing. Samples were incubated for 30 min on ice and subsequently overnight at −20°C before being subjected to staining. Alternatively, samples can be stored at −20°C for up to 1 year.
Bone marrow.
To isolate bone marrow cells, the femur and tibia bones were cleaned from muscle and ligaments, punctured at both ends and rinsed with 4°C cold PBS/EDTA using a syringe and 22 G needle. Five ml of this suspension (out of 40 ml per animal) was filtered through 35 µm cell strainers and fixed with ethanol/methanol, following the procedures described above.
Staining.
Cell suspensions were removed from −20°C storage and allowed to adapt to room temperature (RT) for ∼10 min. After centrifugation (310 g; RT; 6 min) pellets were resuspended in 5 ml PBS/EDTA (RT), incubated for 5–30 min at RT and pelleted again (310 g; RT; 6 min). Cell sediments were suspended in an appropriate volume (0.5–2 ml) of staining solution (PBS without EDTA, containing 30 mg/ml propidium iodide (PI) and 0.3 mg/ml DNAse free RNase A) that warrants saturation of all DNA with PI. Samples were incubated for 30 min in a 37°C water bath in the dark, cooled down to room temperature and subjected to flow cytometry.
Flow cytometry.
We used an FC-500 Cytomics cytometer with CXP software (BeckmanCoulter) and an EPICS-XL cytometer with System II software (BeckmanCoulter). PI fluorescence, excited with a 488 nm argon ion laser was detected in the FL3 channel (620 nm band-pass filter). The threshold for acquisition was defined as 15 in the PI channel (FL-3). Doublets and higher aggregates were excluded by gating, as described in the results section. Measurements were performed at rates of 50–450 events per second at the lowest or medium flow rate, with 10,000 events (excluding doublets) being recorded per sample. Coefficients of variation (HPCVs and CVs) for the G0/G1 peak and the percentage of subG1-fragments and G2/M cells were determined using the acquisition software and Multicycle (Phoenix), respectively. DNA indices were determined as the ratio (X-mean of the aberrant distinct peak closest to the normal diploid population)/(X-mean of the normal diploid population).
Figures and Tables
Figure 1 A standardized method for high resolution in vivo cell cycle analysis of various tissues. (A) Schematic overview of steps and reagents together with the approximate time required to process four samples. Incubation and centrifugation steps account for most of the fixation and staining time, which will therefore not change much if more samples are processed in parallel. (B) Gating strategy to exclude doublets and higher cell aggregates from analysis, as applied to liver tissue derived from a C57/B6J mouse. The three peaks in the gated histogram represent cells with 2N, 4N and 8N DNA content (from left to right).
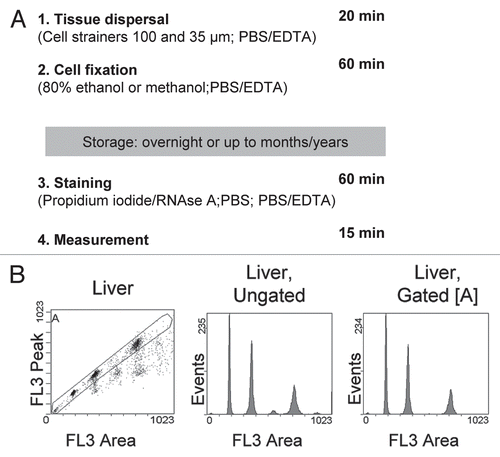
Figure 2 High resolution cell cycle profiles of tissues. (A) Cell cycle profiles obtained from tissue samples of C57/B6J mice. Apart from bone marrow, all depicted profiles were obtained from snap-frozen samples. Tissues were processed following our protocol, stained with propidium iodide and subjected to flow cytometry. Gating was carried out as shown in and 10,000 events (excluding doublets) were recorded. The x-axis shows the linear FL3-area signal which represents DNA content per cell. Numbers within the histograms indicate the HPCV (in brackets: CV) of the main peak, representing G0/G1 cells with a 2N DNA content. (B) Cell cycle profiles from human and sheep tissues, processed and analyzed as described in (A).
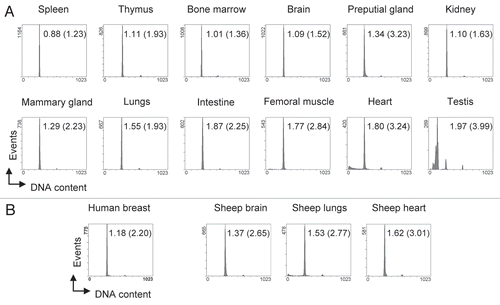
Figure 3 Detection of subtle ploidy alterations in tumor tissue. (A) Histopathology of a heterogenous murine mammary carcinoma specimen derived from transgenic Balb/c WAP-T mice overexpressing SV40 T-Ag. The H&E stained section shows a specimen with mainly undifferentiated areas surrounded by differentiated mammary epithelial cells. Arrows indicate necrotic areas including two centrally located comedo necroses. Scale bar is 200 µm. (B) Cell cycle profiles of various individual mammary carcinoma derived from transgenic Balb/c WAP-T mice. Bars in the histograms indicate the positions of normal 2N and 4N populations, respectively, as previously determined with normal murine splenocytes and mammary gland tissue. Numbers within the histograms indicate the DNA index, determined as the ratio (X-mean of the aberrant distinct peak closest to the normal diploid population)/(X-mean of the normal diploid population). (C) Homo-/heterogeneity of mouse tissues. Individual murine tissues were cut into six sections (1–6) that were processed independently for cell cycle analysis. Bars in the histograms of the mammary carcinoma (Mamma Ca) indicate the positions of normal 2N and 4N populations, respectively, as previously determined with normal murine splenocytes and mammary gland tissue. The Mamma Ca specimen was derived from a transgenic Balb/c WAP-T mouse overexpressing SV40 T-Ag. Spleen and brain specimens were derived from a C57/BL6J p53-/- mouse that had spontaneously developed tumors and displayed a massively enlarged spleen. Tissues were processed and analyzed as in .
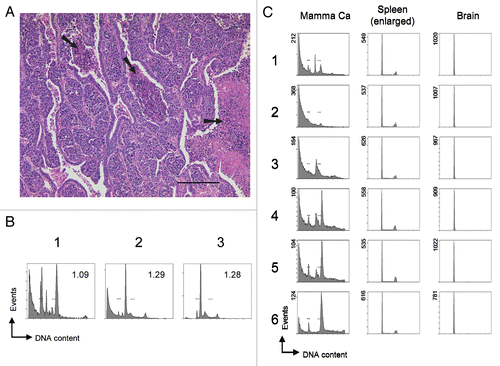
Figure 4 Detection of DNA damage-induced apoptosis and cell cycle arrest in vivo. Mice were irradiated with 5 Gy ionizing radiation and culled at the indicated times after irradiation. Spleen and bone marrow were isolated and processed for cell cycle analysis. Results from two independent experiments (#1, #2) are shown. The indicated percentages for apoptotic subG1-fragments and cells with a 4N DNA content (G2/M phase of the cell cycle, highlighted by arrows) were determined using appropriate software. The main peak represents cells with a DNA content of 2N (G0/G1 phase of the cell cycle). Tissues were processed and analyzed as in .
Acknowledgements
We thank Jürgen Löhler for pathology advice, Lily Huschtscha and Lia Moshkanbaryans for providing tissue samples, Genrich Tolstonof for insightful discussions and Mark Goldberg for critically reading the manuscript. This work was supported by the Cancer Institute New South Wales [07/ECF/1-25 to DS; 05/RLP/1-01 to AWB] and the Deutsche Forschungsgemeinschaft [De 212/23-1-3 to WD]. The Heinrich-Pette-Institute is supported by Freie und Hansestadt Hamburg and the Bundesministerium für Gesundheit.
References
- Budirahardja Y, Gonczy P. Coupling the cell cycle to development. Development 2009; 136:2861 - 2872
- Kastan MB, Bartek J. Cell cycle checkpoints and cancer. Nature 2004; 432:316 - 323
- Lee HO, Davidson JM, Duronio RJ. Endoreplication: Polyploidy with purpose. Genes Dev 2009; 23:2461 - 2477
- Torres EM, Williams BR, Amon A. Aneuploidy: Cells losing their balance. Genetics 2008; 179:737 - 746
- Darzynkiewicz Z. Critical aspects in analysis of cellular DNA content. Curr Protoc Cytom 2010; 7:2 - 7
- Burns ER, Bagwell CB, Hinson WG, Pipkin JL Jr, Hudson JL. Preparation and stability of sixteen murine tissues and organs for flow cytometric cell cycle analysis. Cytometry 1983; 4:150 - 160
- Darzynkiewicz Z, Juan G. DNA content measurement for DNA ploidy and cell cycle analysis. Curr Protoc Cytom 2001; 7:5 - 7
- Foiry L, Megret J, Junien C, Gourdon G. A simple and fast method for cell recovery and DNA content analysis from various mouse tissues by flow cytometry. Cytotechnology 2006; 52:107 - 112
- Thornthwaite JT, Sugarbaker EV, Temple WJ. Preparation of tissues for DNA flow cytometric analysis. Cytometry 1980; 1:229 - 237
- Krishan A, Cabana R. Flow cytometric analysis of electronic nuclear volume and DNA content in normal mouse tissues. Cell Cycle 2004; 3:380 - 383
- Vindelov LL, Christensen IJ, Nissen NI. A detergent-trypsin method for the preparation of nuclei for flow cytometric DNA analysis. Cytometry 1983; 3:323 - 327
- Speidel D, Helmbold H, Deppert W. Dissection of transcriptional and non-transcriptional p53 activities in the response to genotoxic stress. Oncogene 2006; 25:940 - 953
- Wersto RP, Chrest FJ, Leary JF, Morris C, Stetler-Stevenson MA, Gabrielson E. Doublet discrimination in DNA cell cycle analysis. Cytometry 2001; 46:296 - 306
- Suresh R, Aravindan GR, Moudgal NR. Quantitation of spermatogenesis by DNA flow cytometry: comparative study among six species of mammals. J Biosci 1992; 17:413 - 419
- Bocking A, Nguyen VQ. Diagnostic and prognostic use of DNA image cytometry in cervical squamous intraepithelial lesions and invasive carcinoma. Cancer 2004; 102:41 - 54
- Briggs CD, Neal CP, Mann CD, Steward WP, Manson MM, Berry DP. Prognostic molecular markers in cholangiocarcinoma: A systematic review. Eur J Cancer 2009; 45:33 - 47
- Doak SH. Aneuploidy in upper gastro-intestinal tract cancers—a potential prognostic marker?. Mutat Res 2008; 651:93 - 104
- Dressler LG, Seamer LC, Owens MA, Clark GM, McGuire WL. DNA flow cytometry and prognostic factors in 1,331 frozen breast cancer specimens. Cancer 1988; 61:420 - 427
- Schulze-Garg C, Lohler J, Gocht A, Deppert W. A transgenic mouse model for the ductal carcinoma in situ (DCIS) of the mammary gland. Oncogene 2000; 19:1028 - 1037
- Heinlein C, Krepulat F, Lohler J, Speidel D, Deppert W, Tolstonog GV. Mutant p53(R270H) gain of function phenotype in a mouse model for oncogene-induced mammary carcinogenesis. Int J Cancer 2008; 122:1701 - 1709
- Darzynkiewicz Z, Li X, Gong J. Assays of cell viability: Discrimination of cells dying by apoptosis. Methods Cell Biol 1994; 41:15 - 38
- Coates PJ, Lorimore SA, Wright EG. Cell and tissue responses to genotoxic stress. J Pathol 2005; 205:221 - 235
- Heinrichs S, Deppert W. Apoptosis or growth arrest: Modulation of the cellular response to p53 by proliferative signals. Oncogene 2003; 22:555 - 571
- Slatter TL, Ganesan P, Holzhauer C, Mehta R, Rubio C, Williams G, et al. p53-mediated apoptosis prevents the accumulation of progenitor B cells and B-cell tumors. Cell Death Differ 2010; 17:540 - 550
- Ishikawa K, Ishii H, Saito T. DNA damage-dependent cell cycle checkpoints and genomic stability. DNA Cell Biol 2006; 25:406 - 411