Abstract
Inactivation of the breast cancer susceptibility gene 1 (BRCA1) plays a significant role in the development of a subset of familial breast and ovarian cancers, but increasing evidence points to a role also in sporadic tumors. BRCA1 is a multifunctional nuclear protein involved in the regulation of many nuclear cellular processes, including DNA repair, cell cycle, transcription and chromatin remodeling. To identify novel proteins participating in the BRCA1 network, two-dimensional gel electrophoresis and MALDI-TOF mass spectrometry were used to compare the nuclear-enriched proteome map of BRCA1-deficient and BRCA1-proficient cell lines. Five differentially expressed polypeptides were identified and two of them, hnRNPA2B1 and KHSRP, turned out to be involved in mRNA and miRNA metabolism. qRT-PCR analyses indicated that the hnRNPA2B1 and KHSRP levels increased in response to BRCA1 loss and restoration of BRCA1 expression in BRCA1 null cells reverted hnRNPA2B1 and KHSRP up-regulation. Interrogation of publicly available transcriptional profiling datasets revealed that both genes were actually over-expressed in BRCA1 mutated tumors. Overall, our results indicate that BRCA1 modulates the expression of two proteins involved in the processing of RNA, highlighting the complex nature of BRCA1-associated tumor suppressor function and disclosing a novel mechanism by which BRCA1 may affect transcription.
Introduction
Germline mutations in BRCA1 (BReast CAncer susceptibility gene1) are known to predispose carriers to an increased risk of breast and ovarian cancers. Although BRCA1 mutations are rarely found in sporadic tumors, the significant percentage of cases showing reduced mRNA/protein expression levels suggests that loss of BRCA1-mediated functions may also play a role in sporadic breast and ovarian cancers.Citation1,Citation2
BRCA1 protein is characterized by three recognizable regions, namely a NH2-terminal RING finger domain, a pair of nuclear localization signals and a couple of BRCA1 C-terminal domains (BRCT). Through the RING finger domain, BRCA1 binds to BARD1, another RING domain-containing protein, thus forming heterodimers that act as ubiquitin ligases.Citation3 BRCT domains, firstly identified in BRCA1, are now considered common motifs of proteins involved in DNA damage repair and cell cycle.Citation3
BRCA1 has binding affinities for a large number of nuclear proteins including ATR, SWI/SNF chromatin remodeling complexes, the RNA helicase A, the Fanconi's anemia protein FANCD2, BRIP1.Citation3 A large complex named BRCA1-associated genome surveillance complex (BASC), composed of a number of factors involved in the recognition and repair of aberrant DNA structures, has been isolated.Citation4 Indeed, BRCA1 is thought to participate in a large spectrum of nuclear cellular functions including DNA repair, cell cycle and transcription, although the actual mechanism of action of BRCA1 in these contexts is far to be fully understood.Citation3
To shed light on this issue, we compared the nuclear-enriched proteomic profile of matched breast cancer cell lines proficient and deficient for BRCA1 expression. Two proteins involved in mRNA and miRNA processing, hnNRPA2B1 and KHSRP, turned out to be significantly modulated in response to BRCA1 expression. In silico analysis revealed that both hnNRPA2B1 and KHSRP mRNAs were actually overexpressed in BRCA1 mutated tumors. Overall, our data support the involvement of BRCA1 in the processing of RNAs, adding another piece in the puzzle of BRCA1 functional network.
Results
Proteomic prolife of BRCA1-proficient and deficient cells.
To better understand the role of BRCA1 in breast cancer development, we took advantage of a breast cancer model recently developed in our laboratory and compared the proteomic profile of nuclear-enriched lysates from breast cancer cells silenced through RNA interference for BRCA1 expression (HBL-BR2) vs. the nonsilenced counterpart (HBLpS).Citation5 Over 280 protein species were detected in each gel and about 100 protein spots matched between the two samples (). Of these, five were significantly modulated in response to BRCA1 downregulation () and were then identified by MALDI-TOF peptide mass finger-printing (PMF) (Table and Sup. Table 1).
Intriguingly, spots 1 and 3 turned out to correspond to KHSRP and hnRNPA2B1, two factors involved in mRNA metabolism. In the light of the increasing evidence linking BRCA1 to regulation of transcription we decided to focus on these two proteins. hnRNPA2B1, which was overexpressed in BRCA1-silenced cells compared to BRCA1 proficient cells, is an RNA-binding protein that forms complexes with RNA polymerase II transcripts and has been reported to be involved in mRNA splicing and localization.Citation6 Alternative splicing of hnRNPA2B1 gives rise to two products, hnRNPA2 and hnRNPB1, the former being 12 amino acid shorter and more abundantly expressed.
An apparent reduced expression for the spot corresponding to KHSRP was instead observed in BRCA1-silenced cells. KHSRP, also known as FUSE binding protein 2, is an AU-rich element (ARE) binding protein that promotes the decay of ARE-containing mRNAs.Citation7
Validation of the differential expression for hnRNPA2B1 and KHSRP.
In agreement with proteomics data, immunoblot experiments confirmed the overexpression of hnRNPA2B1 in nuclear-enriched extracts of BRCA1-deficient cells. In fact, BRCA1-silenced clones (HBL-BR1 and HBL-BR2) displayed higher protein levels of hnRNPA2B1 compared to HBLpS control in all the three experiments performed, particularly for the A2 isoform ( and C). Conversely, overexpression of BRCA1 in HCC1937 BRCA1-negative cells (HCC+BR) resulted in hnRNP A2 and B1 downregulation ( and D).Citation8 No hnRNPA2B1 expression was detected in cytoplasmic fractions (data not shown).
qRT-PCR analyses indicated that BRCA1 affected hnRNPA2B1 transcript levels. In fact, in 3 different cell systems (HBL100, HCC1937 and MCF7) loss of BRCA1 associated to increased levels of hnRNPA2B1 mRNA ( and F).
BRCA1 impinged also on KHSRP synthesis. Intriguingly, opposite to proteomics data, in which a spot corresponding to a KHSRP-derived peptide was fainter in BRCA1-silenced cells compared to BRCA1 expressing ones, qRT-PCR analyses indicated that, similar to what observed for hnRNPA2B1, BRCA1 downregulation correlated with upregulation of KHSRP in all cell lines tested ( and B).
Clinical relevance of hnRNPA2B1 and KHSRP expression.
To determine the clinical relevance of hnRNPA2B1 and KHSRP expression in BRCA1-mediated transformation, we compared the expression of these genes in BRCA1-mutated (mut) and wild type (wt) cancers using 3 breast (115, 159 and 10 cases, respectively) and one ovarian (35 cases) gene expression data sets available in the Oncomine database.Citation9–Citation13
According to our immunoblot and qRT-PCR data, a trend toward upregulation of both hnRNPA2B1 and KHSRP was appreciable in BRCA1-mutated patients, reaching the statistical significance in some studies ( and ).
Discussion
The BRCA1 tumor suppressor has been related to a wide spectrum of nuclear cellular functions, including DNA repair, cell cycle, transcription and chromatin remodeling.Citation3,Citation14 However, how all these functions converge on BRCA1 and how these effects are reconciled with BRCA1 organ-specificity is far to be clari- fied. To further complicate this scenario, growing evidence suggest an involvement of BRCA1 also in the regulation of RNA expression.Citation15 In fact, BRCA1 has been shown to take part in the RNAPII holoenzyme, by interacting with coregulators or the ATP-dependent RNA helicase A, and it has been suggested that this complex might participate in DNA repair during transcription-induced DNA damage.Citation16–Citation18
By comparing the proteomic profile of nuclear-enriched cell lysates from BRCA1-proficient and deficient breast cancer cell lines we identified two proteins associated with RNA processing, namely hnRNPA2B1 and KHSRP, as differentially expressed. In detail, hnRNPA2B1 and KHSRP transcripts were upregulated in BRCA1-deficient cells. Viceversa, restoration of BRCA1 expression in BRCA1 null cells resulted in the reversal of hnRNPA2B1 and KHSRP upregulation. In agreement with these observations, in silico analyses revealed that both genes were overexpressed in BRCA1 mutated breast and ovarian cancers.
hnRNPA2B1 belongs to the A/B subfamily of the ubiquitously expressed heterogeneous nuclear ribonucleoproteins (hnRNPs), which are involved in a variety of key cellular functions. hnRNPA/Bs profoundly influence post-transcriptional regulation of gene expression by capping, splicing, polyadenylating and cytoplasmic transporting mRNAs and are also required for miRNAs processing.Citation6,Citation19 Overexpression of hnRNPA/Bs has been detected in several tumor types, where it seems to promote metastatic spreading, at least in part by regulating the splicing of metastasis-associated genes.Citation20–Citation22 Intriguingly, very recent evidence has suggested that hnRNPA2B1 induces epithelial-to-mesenchymal transition in lung cancer.Citation23 Thus, our findings of hnRNPA2B1 overexpression in BRCA1 deficient cells and tumors suggest that hnRNPA2B1 may contribute to the expression of the mesenchymal traits observed in BRCA1-associated tumors, such as expression of vimentin, TWIST1, loss of polarity and spindle phenotypes.Citation24,Citation25
Furthermore, a link between the RNA processing machinery and DNA repair has been observed.Citation26,Citation27 Indeed, hnRNPA2B1 binds the DNA-PK complex and inhibits DNA-PK dependent phosphorylation, thus hindering the double strand DNA break repair process.Citation28 Hence, an increased expression of hnRNPA2B1 could contribute to the reduced efficiency of the DNA repair machinery of BRCA1-deficient cells.
KHSRP was also identified as modulated in the proteomic pro- file of BRCA1-silenced cells. Curiously, while the spot identified in the proteomic analysis as corresponding to KHSRP appeared to be more represented in BRCA1-proficient vs. BRCA1-deficient cells, KHSRP mRNA turned out to be negatively regulated by BRCA1, as assessed by qRT-PCR analyses. A plausible explanation for the discrepancy between mRNA and proteomic data may be found in post-translational modifications of the protein. Indeed, KHSRP has been reported to undergo both caspase-mediated cleavage and AKT and p38 MAPK-mediated phosphorylation and other authors have reported that KHSRP generates multiple protein spots in a 2-DE protein profiling as a result of post-translational regulation.Citation7,Citation29–Citation31 Thus, despite an increase in the overall amount of the KHSRP, the relative intensity of a particular protein spot could decrease as a consequence of protein modifications.
KHSRP is a multifunctional RNA-binding protein involved in mRNA decay and alternative pre-mRNA splicing. In particular, KHSRP promotes the rapid decay of AU-rich element (ARE)-containing mRNAs, which include genes involved in cell proliferation, stress response and cancer.Citation7,Citation29,Citation32 Furthermore, KHSRP has been recently demonstrated to take part in the maturation of miRNAs, including miR-21, let-7f, miR-98, miR-196a and miR-27, which have proven to be overexpressed and play an oncogenic role in breast cancer.Citation33–Citation37 These evidence suggest that KHSRP might participate to the transformation of BRCA-1 deficient cells. Moreover, an in silico analysis using the Oncomine database revealed that overexpression of KHSRP correlated with ER-negativity (data not shown), suggesting that this factor may contribute to the BRCA1-associated tumor phenotype.
Collectively, our data demonstrate a role for BRCA1 in modulating two important mRNA and miRNA processing proteins, highlighting the complex nature of BRCA1-associated tumor suppressor function and disclosing a novel mechanism through which BRCA1 may affect gene expression.
Materials and Methods
Cell culture.
HBL100 cell line was purchased from Interlab Cell Line Collection (Genova, Italy). MCF7 cell line was purchased from the American Type Culture Collection. HCC1937 and HCC+BR (HCC1937 transfected with full length BRCA1) cell lines were a kind gift from D.P. Harkin.Citation8 HBL100 cell line was grown in Eagle's medium (MEM, GIBCO, Invitrogen) supplemented with 10% of fetal bovine serum (FBS, GIBCO, Invitrogen); MCF7 and HCC1937 cell lines were maintained in RPMI 1640 supplemented with 10% and 20% FBS, respectively, (GIBCO, Invitrogen). HCC+BR cell line was grown in HCC1937 medium supplemented with 0.2 mg/ml G418 (GIBCO, Invitrogen).
BRCA1-silenced cell clones (HBL-BR1, HBL-BR2, MCF-BR1) and scramble vector transfected clones (HBLpS and MCFpS) were obtained form HBL100 and MCF7 cell lines by stable transfection with BRCA1-specific or scramble pSUPER constructs, as previously described in reference Citation5.
Cell fractionation and proteomic analyses.
Purification of nuclear-enriched and cytoplasmic fractions was performed as in Thiede et al.Citation38 Briefly, cellular pellets were washed, incubated and homogenized on ice in MB buffer (400 mM sucrose, 50 mM Tris, 1 mM EGTA, 5 mM 2-mercaptoethanol, 10 mM potassium hydrogen phosphate, pH 7.6 and 0.2% BSA) and then centrifuged at 1,500 g for 1 min, at 4°C. The supernatants were collected as cytoplasmic extracts. Pellets enclosing the nuclei were washed, suspended in NB buffer (10 mM Hepes, pH 7.4, 10 mM KCl, 2 mM MgCl2, 1 mM dithiothreitol and 1 mM Pefabloc), incubated for 1 h on ice, homogenized and applied to 10 ml of 30% sucrose in NB buffer. Pellets enriched in nuclei were then washed and processed for protein extraction (nuclear-enriched lysates).
Nuclear-enriched protein extracts were loaded onto 13 cm, pH 4–7 L and pH 6–11 L IPG strips (GE Healthcare). IEF was conducted using an IPGPhor II system (GE Healthcare) according to the manufacturer's instructions. Focused strips were equilibrated with 6 M urea, 26 mM DTT, 4% (w/v) SDS, 30% (v/v) glycerol in 0.1 M Tris-HCl (pH 6.8) for 15 min, followed by 6 M urea, 0.38 M iodoacetamide, 4% (w/v) SDS, 30% (v/v) glycerol and a dash of bromophenol blue in 0.1 M Tris-HCl, pH 6.8, for 10 min. The equilibrated strips were applied directly to 10% SDS-polyacrylamide gels and separated at 130 V. Gels were fixed and stained by ammoniacal silver. Gels were scanned with an Image Scanner II apparatus and analyzed by the ImageMaster 2D Platinum software (GE Healthcare). For each sample, three 2-DE gels were performed and a comparative analysis was conducted as described in Bivi et al.Citation39
Spots were excised from the gel, minced, reduced, S-alkylated and digested as previously reported in reference Citation40. Digests were desalted using microZipTipC18 pipette tips (Millipore) before MALDI-TOF-Mass Spectrometry analysis. Protein samples were analyzed using a Voyager-DE PRO spectrometer (Applied Biosystems) operating in positive ion reflectron mode, with an acceleration voltage of 20 kV, a N2 laser (337 nm) operating with a repetition rate of 4 Hz. Final mass spectra, measured over a mass range of m/z 700–4,000 by averaging 400–800 laser shots, were elaborated using the DataExplorer 5.1 software (Applied Biosystems). Internal mass calibration was performed with peptides deriving from protease autoproteolysis. Spectrum peak lists were automatically generated by the software and manually inspected to exclude protease peptides. Mascot software package (www.matrixscience.com/search_form_select.html) was used to identify spots from SwissProt nonredundant sequence database (2010/09). Candidates with Mascot scores >70 from peptide matching analysis (corresponding to p values <0.05) were further evaluated by comparison with their calculated molecular mass and pI using the experimental values obtained from 2-DE.
Western blot analysis and antibodies.
Western blotting was performed on nuclear-enriched protein extracts and on cytoplasmic fractions using antibodies reactive to hnRNPA2/B1 (ABCAM) and α-actin (1A4 Santacruz), as a loading control. Anti-mouse secondary antibody conjugated with Alexa Fluor 680 (Molecular Probes) was used. The Odyssey infrared imaging system (LI-COR, Biosciences, NE) was used for blot visualization and quantization. Protein relative expression was calculated as the ratio between the sample protein signal normalized to the respective α-actin signal and the control signal normalized to the respective α-actin signal. Statistical differences between means obtained from three experiments were evaluated using Student's t test.
mRNA extraction and quantitative RT-PCR.
For quantitative RT-PCR (qRT-PCR), RNA was extracted using the EZ1 RNA Cell Mini Kit (Qiagen) and the BioRobot EZ1 workstation (Qiagen). DNase treatment was added to avoid genomic contamination. RNA was reverse-transcribed with AMV reverse transcriptase (Promega). qRT-PCR was performed in triplicate with the SYBR green PCR Master Mix (Applied Biosystems) in the CFX96 Real-time PCR detection system (Bio-Rad). Relative expression levels were normalized to controls by using the comparative Ct (ΔΔCt) method and the geometric average of a set of three housekeeping genes (β-actin, β2-microglobulin and GAPDH) by the Bio-Rad CFX manager software. Primers were as follows: hnRNPA2B1 F-5′ ACT TTG GCT TTG GGG ATT CA, R-5′ TCC ACG TCC ACT GCC ATA TC; KHSRP F-5′ AAC CGG AGA GCA AGA AGC TG, R-5′ CCG TCT GGG ACC CTG TAC TC; β-actin F-5′ CAC CTT CTA CAA TGA GCT GCG T; R-5′ AGC CTG GAT AGC AAC GTA CAT G; β2-microglobulin F-5′ GAG TAT GCC TGC CGT GTG; R-5′ AAT CCA AAT GCG GCA TCT; GAPDH F-5′ GAA GGT GAA GGT CGG AGT C; R-5′ GAA GAT GGT GAT GGG ATT TC. Statistical differences between means obtained from three experiments were evaluated using Student's t-test.
cDNA microarray analysis.
The Oncomine database (Compendia Bioscience, www.oncomine.org), a repository for published cDNA microarray data, was interrogated (2010/04) for the expression of hnRNPA2B1 and KHSRP mRNAs in BRCA1-associated breast and ovarian cancers. Statistical analysis of the gene expression differences between BRCA1- mutated and BRCA1 wild-type breast and ovarian cancers was accomplished by using the Oncomine algorithm, which allows for multiple comparisons among different studies.Citation9
Abbreviations
| BRCA1 | = | breast cancer susceptibility gene1 |
| KHSRP | = | KH-type splicing regulatory protein |
| hnRNPA2B1 | = | heterogeneous nuclear ribonucleoprotein A2/B1 |
| 2-DE | = | two-dimensional electrophoresis |
| PMF | = | peptide mass fingerprinting |
Figures and Tables
Figure 1 Representative images of nuclear-enriched proteome profile of BRCA1-expressing and silenced cells. (A) Nuclear-enriched protein fractions of HBLpS (left) and HBL-BR2 (right). were separated according to pI using 13 cm IPG strips (pI range 6–11), followed by 10% SDS-PAGE and silver staining. Approximate molecular mass (kDa, vertical axis) and pI values (orizontal axis) are indicated. (B) Cropped images of the differentially expressed species between HBLpS (left) and HBL-BR2 (right) identified by MALDI-TOF PMF analysis, as reported in Table . Approximate molecular mass (kDa) and isoelectric point (pI) are shown.
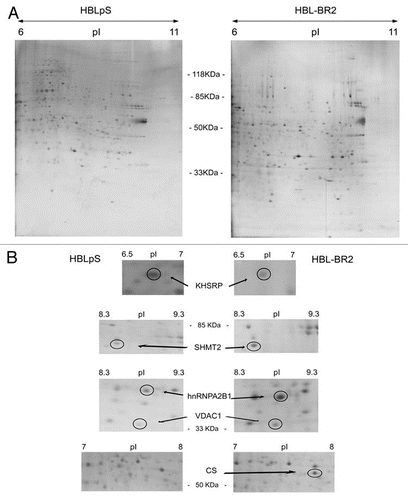
Figure 2 BRCA1-deficient cells express higher levels of hnRNPA2B1 than BRCA1-proficient cell lines. Representative hnRNPA2B1 western blot analysis on nuclear-enriched extracts obtained from HBLpS scramble vector transfected cells and BRCA1-silenced HBL100 cells (HBL-BR1, HBL-BR2) (A) and HCC1937 and the corresponding wtBRCA1 expressing cell line (HCC+BR) (B). Blots were probed with α-actin for normalization. (C) hnRNP A2 and B1 relative protein levels measured in the western blot analysis of nuclear-enriched extracts from HBLpS (grey histograms) and HBL-BR1 and HBL-BR2 (black histograms). Data illustrate the ratio of normalized hnRNP B1 and A2 sample signals to normalized control signal and represent the means of three independent experiments. Standard deviation (bars) and statistically significant differences are reported. (D) hnRNP A2 and B1 relative protein expression in HCC1937 (black histograms) and HCC+BR (grey histograms) calculated as in (C). Standard deviation (bars) and statistically significant differences are reported. (E) hnRNPA2B1 mRNA expression levels were analyzed by qRT-PCR in the BRCA1-expressing scramble vector transfected cell lines (HBLpS and MCFpS) (grey histograms) and in the BRCA1-silenced HBL100 and MCF7 cell lines (HBL-BR1, HBL-BR2 and MCF-BR1) (black histograms). Histograms represent the means of the relative mRNA expression levels (normalized to controls as described in material and methods) of three experiments. Standard deviation (bars) and statistically significant differences are reported. (F) Relative hnRNPA2B1 mRNA expression in HCC1937 and HCC+BR BRCA1-expressing cell lines (black and grey histograms, respectively), as assayed by qRT-PCR. Standard deviation (bars) and statistically significant differences are reported.
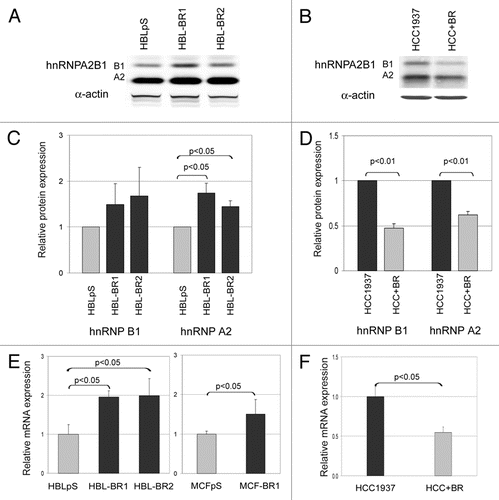
Figure 3 BRCA1-deficient cells express higher levels of KHSRP than BRCA1-proficient cell lines. KHSRP mRNA expression levels were analyzed by qRT-PCR in scramble vector transfected (HBLpS and MCFpS) (grey histograms) and BRCA1-silenced HBL100 and MCF7 cell lines (HBL-BR1, HBL-BR2 and MCF-BR1) (black histograms) (A) and in HCC1937 and HCC+BR BRCA1-expressing cell lines (black and grey histograms, respectively) (B). Histograms represent the means of relative mRNA expression levels (normalized to controls as described in material and methods) of three experiments. Standard deviation (bars) and statistically significant differences are reported.
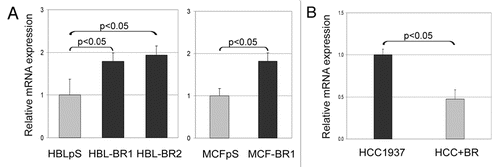
Figure 4A hnRNPA2B1 and KHSRP expression levels in BRCA1-mutated and BRCA1-wild type breast and ovarian cancers. (A) Normalized hnRNPA2B1 mRNA expression in BRCA1-wild type (wt) and BRCA1-mutated (mut) breast and ovarian cancers generated by using Oncomine.Citation9 The Reference number for each study is reported below the corresponding panel: ref. 10, 97 wt, 18 mut; ref. 11, 128 wt, 31 mut; ref. 12, 5 wt, 5 mut; ref. 13, 26 wt, 9 mut. Asterisk indicates p values <0.05.
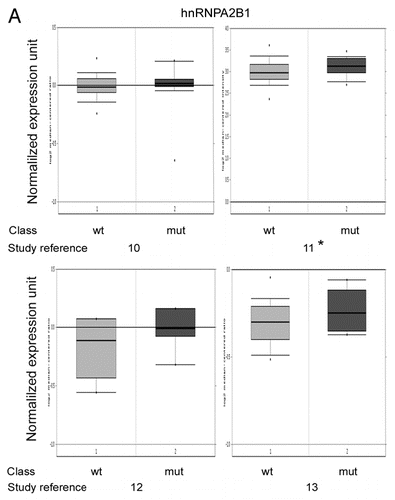
Figure 4B hnRNPA2B1 and KHSRP expression levels in BRCA1-mutated and BRCA1-wild type breast and ovarian cancers. (B) Normalized KHSRP mRNA expression in BRCA1-wild type (wt) and BRCA1-mutated (mut) breast and ovarian cancers generated by using Oncomine.Citation9 The Reference number for each study, as in (A), is reported below the corresponding panel. Asterisk indicates p values <0.05.
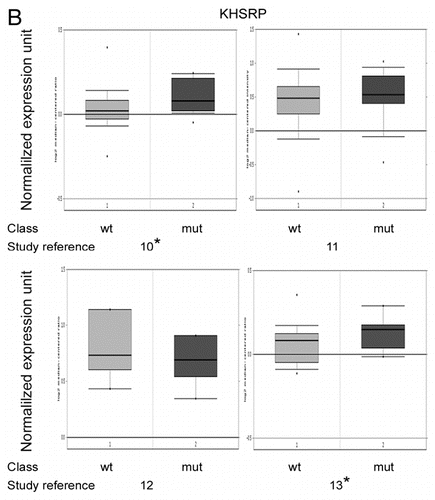
Table 1 Proteins with changed expression levels in nuclear-enriched extracts from HBL-BR2 with respect to HBLpS cells. Spot number, protein name, gene name, SwissProt accession, number of matched and observed peptides, sequence coverage, theoretical pI and Mr values, identification score,and fold change for HBL-BR2 cells vs. control (HBLpS cells) are listed.
Additional material
Download Zip (14.4 KB)Acknowledgements
We are grateful to Dr. D. Paul Harkin for HCC1937 and HCC1937 cell line transfected with full length BRCA1 (HCC+BR). This work was supported by FIRC, AIRC, Regione Friuli Venezia Giulia, Italian Ministry of Health and Associazione Via di Natale. A.S. was supported by MIUR (PRIN2008_CCPKRP002) and (FIRB_MERIT).
References
- Esteller M, Silva JM, Dominguez G, Bonilla F, Matias-Guiu X, Lerma E, et al. Promoter hypermethylation and BRCA1 inactivation in sporadic breast and ovarian tumors. J Natl Cancer Inst 2000; 92:564 - 569; PMID: 10749912; http://dx.doi.org/10.1093/jnci/92.7.564
- Wei M, Xu J, Dignam J, Nanda R, Sveen L, Fackenthal J, et al. Estrogen receptor alpha, BRCA1 and FANCF promoter methylation occur in distinct subsets of sporadic breast cancers. Breast Cancer Res Treat 2008; 111:113 - 120; PMID: 17932744; http://dx.doi.org/10.1007/s10549-007-9766-6
- Huen MS, Sy SM, Chen J. BRCA1 and its toolbox for the maintenance of genome integrity. Nat Rev Mol Cell Biol 2010; 11:138 - 148; PMID: 20029420; PMID: 10.1038/nrm2831
- Wang Y, Cortez D, Yazdi P, Neff N, Elledge SJ, Qin J. BASC, a super complex of BRCA1-associated proteins involved in the recognition and repair of aberrant DNA structures. Genes Dev 2000; 14:927 - 939; PMID: 10783165
- Santarosa M, Del Col L, Tonin E, Caragnano A, Viel A, Maestro R. Premature senescence is a major response to DNA cross-linking agents in BRCA1-defective cells: implication for tailored treatments of BRCA1 mutation carriers. Mol Cancer Ther 2009; 8:844 - 854; PMID: 19372557; http://dx.doi.org/10.1158/1535-7163.MCT-08-0951
- Dreyfuss G, Kim VN, Kataoka N. Messenger-RNA-binding proteins and the messages they carry. Nat Rev Mol Cell Biol 2002; 3:195 - 205; PMID: 11994740; http://dx.doi.org/10.1038/nrm760
- Gherzi R, Trabucchi M, Ponassi M, Ruggiero T, Corte G, Moroni C, et al. The RNA-binding protein KSRP promotes decay of beta-catenin mRNA and is inactivated by PI3K-AKT signaling. PLoS Biol 2006; 5:5; PMID: 17177604; http://dx.doi.org/10.1371/journal.pbio.0050005
- Quinn JE, Kennedy RD, Mullan PB, Gilmore PM, Carty M, Johnston PG, et al. BRCA1 functions as a differential modulator of chemotherapy-induced apoptosis. Cancer Res 2003; 63:6221 - 6228; PMID: 14559807; http://dx.doi.org/10.1016/S1359-6349(04)80219-2
- Rhodes DR, Yu J, Shanker K, Deshpande N, Varambally R, Ghosh D, et al. ONCOMINE: a cancer microarray database and integrated data-mining platform. Neoplasia 2004; 6:1 - 6; PMID: 15068665
- van 't Veer LJ, Dai H, van de Vijver MJ, He YD, Hart AA, Mao M, et al. Gene expression profiling predicts clinical outcome of breast cancer. Nature 2002; 415:530 - 536; PMID: 11823860; http://dx.doi.org/10.1038/415530a
- Pawitan Y, Bjöhle J, Amler L, Borg AL, Egyhazi S, Hall P, et al. Gene expression profiling spares early breast cancer patients from adjuvant therapy: derived and validated in two population-based cohorts. Breast Cancer Res 2005; 7:953 - 964; PMID: 16280042; http://dx.doi.org/10.1186/bcr1325
- Hedenfalk I, Duggan D, Chen Y, Radmacher M, Bittner M, Simon R, et al. Gene-expression profiles in hereditary breast cancer. N Engl J Med 2001; 344:539 - 548; PMID: 11207349; http://dx.doi.org/10.1056/NEJM200102223440801
- Jazaeri AA, Yee CJ, Sotiriou C, Brantley KR, Boyd J, Liu ET. Gene expression profiles of BRCA1-linked, BRCA2-linked and sporadic ovarian cancers. J Natl Cancer Inst 2002; 94:990 - 1000; PMID: 12096084
- Boulton SJ. BRCA1-mediated ubiquitylation. Cell Cycle 2006; 5:1481 - 1486; PMID: 16861894
- Aiyar S, Sun JL, Li R. BRCA1: a locus-specific “liaison” in gene expression and genetic integrity. J Cell Biochem 2005; 94:1103 - 1111; PMID: 15723343; http://dx.doi.org/10.1002/jcb.20386
- Scully R, Anderson SF, Chao DM, Wei W, Ye L, Young RA, et al. BRCA1 is a component of the RNA polymerase II holoenzyme. Proc Natl Acad Sci USA 1997; 94:5605 - 5610; PMID: 9159119
- Anderson SF, Schlegel BP, Nakajima T, Wolpin ES, Parvin JD. BRCA1 protein is linked to the RNA polymerase II holoenzyme complex via RNA helicase A. Nat Genet 1998; 19:254 - 256; PMID: 9662397; http://dx.doi.org/10.1038/930
- Krum SA, Miranda GA, Lin C, Lane TF. BRCA1 associates with processive RNA polymerase II. J Biol Chem 2003; 278:52012 - 52020; PMID: 14506230; http://dx.doi.org/10.1074/jbc.M308418200
- Guil S, Cáceres JF. The multifunctional RNA-binding protein hnRNP A1 is required for processing of miR-18a. Nat Struct Mol Biol 2007; 14:591 - 596; PMID: 17558416; http://dx.doi.org/10.1038/nsmb1250
- Zhou J, Allred DC, Avis I, Martínez A, Vos MD, Smith L, et al. Differential expression of the early lung cancer detection marker, heterogeneous nuclear ribonucleoprotein-A2/B1 (hnRNP-A2/B1) in normal breast and neoplastic breast cancer. Breast Cancer Res Treat 2001; 66:217 - 224; PMID: 11510693
- Moran-Jones K, Grindlay J, Jones M, Smith R, Norman JC. hnRNP A2 regulates alternative mRNA splicing of TP53INP2 to control invasive cell migration. Cancer Res 2009; 69:9219 - 9227; PMID: 19934309; http://dx.doi.org/10.1158/0008-5472.CAN-09-1852
- Carpenter B, MacKay C, Alnabulsi A, MacKay M, Telfer C, Melvin WT, et al. The roles of heterogeneous nuclear ribonucleoproteins in tumour development and progression. Biochim Biophys Acta 2006; 1765:85 - 100; PMID: 16378690; http://dx.doi.org/10.1016/j.bbcan.2005.10.002
- Tauler J, Zudaire E, Liu H, Shih J, Mulshine JL. hnRNP A2/B1 modulates epithelial-mesenchymal transition in lung cancer cell lines. Cancer Res 2010; 70:7137 - 7147; PMID: 20807810; http://dx.doi.org/10.1158/0008-5472.CAN-10-0860
- Molyneux G, Geyer FC, Magnay FA, McCarthy A, Kendrick H, Natrajan R, et al. BRCA1 basal-like breast cancers originate from luminal epithelial progenitors and not from basal stem cells. Cell Stem Cell 2010; 7:403 - 417; PMID: 20804975; http://dx.doi.org/10.1016/j.stem.2010.07.010
- Liu X, Holstege H, van der Gulden H, Treur-Mulder M, Zevenhoven J, Velds A, et al. Somatic loss of BRCA1 and p53 in mice induces mammary tumors with features of human BRCA1-mutated basal-like breast cancer. Proc Natl Acad Sci USA 2007; 104:12111 - 121116; PMID: 17626182; http://dx.doi.org/10.1073/pnas.0702969104
- Morozumi Y, Takizawa Y, Takaku M, Kurumizaka H. Human PSF binds to RAD51 and modulates its homologous-pairing and strand-exchange activities. Nucleic Acids Res 2009; 37:4296 - 4307; PMID: 19447914; http://dx.doi.org/10.1093/nar/gkp298
- Tell G, Wilson DM 3rd, Lee CH. Intrusion of a DNA repair protein in the RNome world: is this the beginning of a new era?. Mol Cell Biol 2010; 30:366 - 371; PMID: 19901076; http://dx.doi.org/10.1128/MCB.01174-09
- Iwanaga K, Sueoka N, Sato A, Hayashi S, Sueoka E. Heterogeneous nuclear ribonucleoprotein B1 protein impairs DNA repair mediated through the inhibition of DNA-dependent protein kinase activity. Biochem Biophys Res Commun 2005; 333:888 - 895; PMID: 15964549; http://dx.doi.org/10.1016/j.bbrc.2005.05.180
- Briata P, Forcales SV, Ponassi M, Corte G, Chen CY, Karin M, et al. p38-dependent phosphorylation of the mRNA decay-promoting factor KSRP controls the stability of select myogenic transcripts. Mol Cell 2005; 20:891 - 903; PMID: 16364914; http://dx.doi.org/10.1016/j.molcel.2005.10.021
- Seok H, Cho J, Cheon M, Park IS. Biochemical characterization of apoptotic cleavage of KH-type splicing regulatory protein (KSRP)/far upstream element-binding protein 2 (FBP2). Protein Pept Lett 2002; 9:511 - 519; PMID: 12553859
- Zubaidah RM, Tan GS, Tan SB, Lim SG, Lin Q, Chung MC. 2-D DIGE profiling of hepatocellular carcinoma tissues identified isoforms of far upstream binding protein (FUBP) as novel candidates in liver carcinogenesis. Proteomics 2008; 8:5086 - 5096; PMID: 19003864; http://dx.doi.org/10.1002/pmic.200800322
- Bakheet T, Frevel M, Williams BR, Greer W, Khabar KS. ARED: human AU-rich element-containing mRNA database reveals an unexpectedly diverse functional repertoire of encoded proteins. Nucleic Acids Res 2001; 29:246 - 254; PMID: 11125104
- Trabucchi M, Briata P, Garcia-Mayoral M, Haase AD, Filipowicz W, Ramos A, et al. The RNA-binding protein KSRP promotes the biogenesis of a subset of microRNAs. Nature 2009; 459:1010 - 1014; PMID: 19458619; http://dx.doi.org/10.1038/nature08025
- Yan LX, Huang XF, Shao Q, Huang MY, Deng L, Wu QL, et al. MicroRNA miR-21 overexpression in human breast cancer is associated with advanced clinical stage, lymph node metastasis and patient poor prognosis. RNA 2008; 14:2348 - 2360; PMID: 18812439; http://dx.doi.org/10.1261/rna.1034808
- Qian B, Katsaros D, Lu L, Preti M, Durando A, Arisio R, et al. High miR-21 expression in breast cancer associated with poor disease-free survival in early stage disease and high TGF-beta1. Breast Cancer Res Treat 2009; 117:131 - 140; PMID: 18932017; http://dx.doi.org/10.1007/s10549-008-0219-7
- Iorio MV, Ferracin M, Liu CG, Veronese A, Spizzo R, Sabbioni S, et al. MicroRNA gene expression deregulation in human breast cancer. Cancer Res 2005; 65:7065 - 7070; PMID: 16103053; http://dx.doi.org/10.1158/0008-5472.CAN-05-1783
- Guttilla IK, White BA. Coordinate regulation of FOXO1 by miR-27a, miR-96 and miR-182 in breast cancer cells. J Biol Chem 2009; 284:23204 - 23216; PMID: 19574223; http://dx.doi.org/10.1074/jbc.M109.031427
- Thiede B, Dimmler C, Siejak F, Rudel T. Predominant identification of RNA-binding proteins in Fas-induced apoptosis by proteome analysis. J Biol Chem 2001; 276:26044 - 26050; PMID: 11352910; http://dx.doi.org/10.1074/jbc.M101062200
- Bivi N, Bereszczak JZ, Romanello M, Zeef LA, Delneri D, Quadrifoglio F, et al. Transcriptome and proteome analysis of osteocytes treated with nitrogen-containing bisphosphonates. J Proteome Res 2009; 8:1131 - 1142; PMID: 19226166; http://dx.doi.org/10.1021/pr8005606
- Talamo F, D'Ambrosio C, Arena S, Del Vecchio P, Ledda L, Zehender G, et al. Proteins from bovine tissues and biological fluids: defining a reference electrophoresis map for liver, kidney, muscle, plasma and red blood cells. Proteomics 2003; 3:440 - 460; PMID: 12687612; http://dx.doi.org/10.1002/pmic.200390059