
Abstract
Recent studies have shown that transmembrane protein 16 A (TMEM16A) is a subunit of calcium-activated chloride channels (CACCs). Pharmacological agents have been used to probe the functional role of CACCs, however their effect on TMEM16A currents has not been systematically investigated. In the present study, we characterized the voltage and concentration-dependent effects of 2 traditional CACC inhibitors (niflumic acid and anthracene-9-carboxcylic acid) and 2 novel CACC / TMEM16A inhibitors (CACCinhA01 and T16AinhA01) on TMEM16A currents. The whole cell patch clamp technique was used to record TMEM16A currents from HEK 293 cells that stably expressed human TMEM16A. Niflumic acid, A-9-C, CACCinhA01 and T16AinhA01 inhibited TMEM16A currents with IC50 values of 12, 58, 1.7 and 1.5 µM, respectively, however, A-9-C and niflumic acid were less efficacious at negative membrane potentials. A-9-C and niflumic acid reduced the rate of TMEM16A tail current deactivation at negative membrane potentials and A-9-C (1 mM) enhanced peak TMEM16A tail current amplitude. In contrast, the inhibitory effects of CACCinhA01 and T16AinhA01 were independent of voltage and they did not prolong the rate of TMEM16A tail current deactivation. The effects of niflumic acid and A-9-C on TMEM16A currents were similar to previous observations on CACCs in vascular smooth muscle, strengthening the hypothesis that they are encoded by TMEM16A. However, CACCinhA01 and T16AinhA01 were more potent inhibitors of TMEM16A channels and their effects were not diminished at negative membrane potentials making them attractive candidates to interrogate the functional role of TMEM16A channels in future studies.
Introduction
Calcium-activated chloride channels (CACCs) are involved in a plethora of physiological roles, including smooth muscle contraction, sensory neuron excitability and fluid secretion.Citation1,Citation2 In 2008, 3 independent laboratories identified transmembrane protein 16 A (TMEM16A) as a molecular subunit that encoded CACC.Citation3-Citation5 TMEM16A belongs to a gene family comprising 10 members (TMEM16A–H, J and K.Citation6 The proteins encoded by the TMEM16 genes are known as anoctamins (ANOs) and are expressed in a range of tissues including liver, skeletal muscle, heart, lung, placenta, and smooth muscle.Citation5,Citation7 Several studies have investigated the physiological role of TMEM16A using gene silencing approaches, for example using small interfering RNA (siRNA) or TMEM16A knockout mice (TMEM16A−/−).Citation8 However, these approaches had limitations, as studies using siRNA were performed on cell lines or primary cell cultures and few TMEM16A−/− mice survived for more than 4 days after birth, precluding investigations of TMEM16A in adult tissues.Citation3,Citation8-Citation10
The physiological role of CACC in smooth muscle has mainly been examined using a pharmacological approach. For example, the traditional CACC blocker, niflumic acid, reduced the amplitude and frequency of spontaneous contractions in portal vein and A-9-C reduced the pumping capability of intact lymphatic preparations.Citation11-Citation13 Several studies have indicated that TMEM16A currents are blocked by niflumic acid in the mid-micromolar range consistent with a role for TMEM16A in these responses.Citation3-Citation5,Citation14,Citation15 However, there are still uncertainties regarding the exact contribution of TMEM16A to native CACC activity. For example, studies have shown that the single channel conductance of native CACCs in vascular smooth muscle is 2–3 pS whereas TMEM16A channels have a conductance of 8.3 pS.Citation5,Citation16 There are also reports of inconsistent effects of the novel TMEM16A channel inhibitor, T16AinhA01 which inhibited CACC activity completely in salivary gland epithelium, but not in airway epithelia, even though TMEM16A is expressed in these cells.Citation7,Citation17
To correctly interpret the physiological role of TMEM16A in intact biological systems using a pharmacological approach, it is essential that a full pharmacological characterization of the effect of CACC/TMEM16A inhibitors on TMEM16A currents is performed. Some studies have noted that TMEM16A currents are inhibited by niflumic acid and A-9-C, however the effect of these agents on native CACCs is quite complex. For example, the inhibitory effects of niflumic acid are known to be voltage-dependent with less block being observed at negative membrane potentials.Citation18 These drugs also dramatically slow the deactivation kinetics of CACCs resulting in currents that are often smaller but longer lasting.Citation18-Citation20 Finally, niflumic acid and A-9-C are also known to produce a paradoxical potentiation of native Ca2+-activated Cl- currents (IClCa) in vascular smooth muscle cells (SMC) under particular experimental conditions, an effect that has not yet been observed in overexpressed TMEM16A currents.Citation21-Citation24 The aim of the present study was to examine the voltage and concentration-dependent effects of 2 traditional CACC inhibitors (niflumic acid and anthracene-9-carboxcylic acid) and 2 novel CACC / TMEM16A inhibitors (CACCinhA01 and T16AinhA01) on TMEM16A currents.
Results
TMEM16A currents (ITMEM16A) were recorded from HEK 293 cells transfected with human TMEM16A, variant 1. These currents possessed the hallmark IClCa / TMEM16A current characteristics, such as outward rectification, time-dependent activation upon depolarisation and prominent slowly de-activating tail currents upon repolarisation.Citation2-Citation4 Currents with properties of TMEM16A were not evident in untransfected HEK cells and the mean peak amplitude of currents evoked upon a step to +80 mV was 192 ± 33 pA (n = 7) in comparison with 2124 ± 214 pA in cells transfected with TMEM16A. TMEM16A is known to exist is several isoforms, characterized by the inclusion, or absence, of four different coding regions referred to as segments a,b,c and d.Citation3,Citation25 The isoform used in this study lacked segment b, a 22 amino acid residue localized to the N terminus of the protein. Studies have shown that TMEM16A variants that lack this segment have a 4-fold higher affinity for Ca2+, compared with variants that contain it.Citation25
A-9-C is a traditional CACC inhibitor that has been used to investigate CACC activity in a range of smooth muscles including portal vein, urethra, esophagus and pulmonary artery.Citation18,Citation19,Citation22,Citation26-Citation28 The effects of A-9-C on ITMEM16A are shown in . The current voltage (I-V) relationship of ITMEM16A was established using the voltage protocol shown in the inset of . Cells were held at -60 mV and then stepped to a series of test potentials ranging from -100 to +120 mV, in 20 mV increments for 2 s, before being stepped back to -80 mV. shows a representative family of currents evoked by this protocol. Addition of A-9-C (1 mM) reduced currents evoked at the test potential range and prolonged the decay of the de-activating tail currents (). Summary data from 9 similar experiments, showing the of effect of A-9-C on mean ITMEM16A amplitude (measured during the test potential) and on the mean time constant (τ) of TMEM16A tail current deactivation, are summarized in , respectively. Taking data produced by the step to +100 mV as an example, A-9-C significantly reduced the mean peak current amplitude from 3.1 ± 0.53 to 1.34 ± 0.4 nA (P < 0.05). The mean time-constant of deactivation of TMEM16A tail currents, following a test pulse to +100 mV, was significantly reduced from 110 ± 22 ms under control conditions to 565 ± 163 ms in the presence of the drug (P < 0.05). The concentration-dependence of the A-9-C effect was examined in experiments represented in . Currents were evoked by stepping to a test potential of +80 mV from a holding potential of -60 mV and then repolarised back to -80 mV. A-9-C was applied over the concentration range 3 µM – 1 mM and a representative example of its effects is shown in . It is clear that A-9-C produced a concentration dependent decrease in ITMEM16A evoked at the test potential. A summary concentration-effect curve, derived from 12 similar experiments is shown in . The data were fit with the Hill-Langmuir equation, yielding an IC50 value of 57.7 µM (lower and upper 95% confidence limits range, 35.3–94.5 µM).
Figure 1. (A and B) Representative current traces, obtained using the protocol illustrated in the inset of (A), before and during the presence of A-9-C (1 mM). (C) Summary current-voltage (I-V) relationship of TMEM16A currents before (open circles) and during (filled squares) exposure to A-9-C (1 mM). (D) Plot of mean time constant (τ) of TMEM16A tail current deactivation against prior test pulse potential (control, open circles and A-9-C, filled squares). (E) TMEM16A currents evoked by a step from -80 to +80 mV in the presence of 10 (purple), 30 (blue), 100 (orange), 300 (green) and 1000 (red) µM A-9-C. (F) Summary concentration effect curve for effect of A-9-C on TMEM16A currents. Data were fit with the Hill-Langmuir equation.
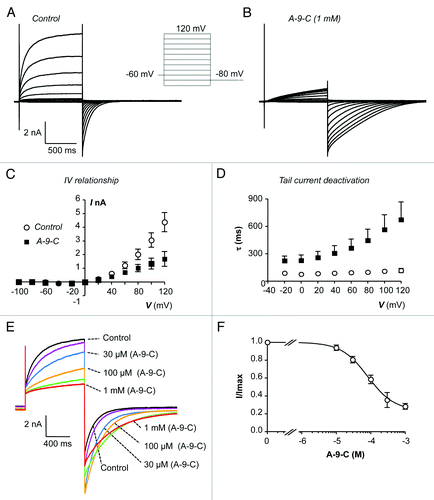
It was apparent from the data in that A-9-C had a bimodal effect on TMEM16A currents, inhibiting TMEM16A currents at positive test potentials, but enhancing TMEM16A tail current at negative potentials. This effect was explored in more detail using the protocol shown in the inset of . Briefly cells were stepped from -80 to +80 mV for 1 s, before being stepped through a range of potentials from -120 to +120 mV. This allowed us to determine the I-V relationship of the TMEM16A tail current and thus examine the voltage sensitivity of the A-9-C effects. are representative families of currents evoked using this protocol in the absence and presence of A-9-C (1 mM). It is clear that A-9-C reduced the amplitude of outward tail currents, evoked at positive potentials, but enhanced the amplitude and slowed the decay of the inward tail currents observed, at negative potentials. is a summary plot of peak tail current amplitude against voltage, measured from 6 similar experiments. At +60 mV, A-9-C reduced the mean tail current amplitude from 1.92 nA ± 0.22 nA to 0.79 ± 0.21 nA, whereas at -80 mV it enhanced the current from -2.88 ± 0.21 nA to -4.34 ± 0.49 nA (P < 0.05). There was also a difference in the time course of these effects. For example, maximal inhibition of outward currents at +80 mV occurred with a latency of 79.3 ± 11.2 s, whereas maximal enhancement of tail current amplitude had a latency of 17.1 ± 2.1 s (P < 0.05).
Figure 2. (A and B) Representative current traces, obtained using the protocol illustrated in the inset of A, before and during the presence of A-9-C (1 mM). (C) Summary current-voltage (I-V) relationship of TMEM16A tail currents, evoked following an initial step to +80 mV, before (open circles) and during (filled squares) exposure to A-9-C (1 mM). (D) Plot of mean time constant (τ) of TMEM16A tail current deactivation against voltage (control, open circles and A-9-C, filled squares).
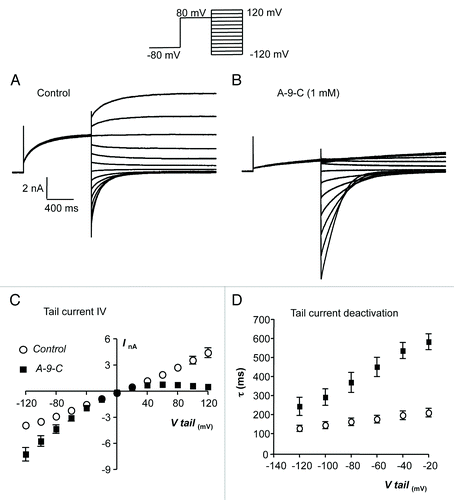
The effect of A-9-C on the deactivation kinetics of the TMEM16A tail currents is plotted in . Tail currents decayed mono-exponentially in the voltage range -120 to +20 mV and A-9-C prolonged their decay at each potential. However, it is noteworthy that the effects of A-9-C on TMEM16A tail current deactivation kinetics were more pronounced at less negative membrane potentials. For example, at -80 mV, A-9-C increased the mean time constant of tail current deactivation from 163 ± 19.6 to 369 ± 53 ms (n = 5, P < 0.05), whereas at -20 mV it increased it from 209 ± 22 to 583 ± 41 ms (n = 5, P < 0.05).
Niflumic acid is a commonly used CACC blocker and has been noted to inhibit TMEM16A previously.Citation3-Citation5,Citation14,Citation15 However, the effects of niflumic acid on ITMEM16A have not been systematically investigated and it is not yet known if it’s inhibitory effects are voltage dependent, or if can potentiate ITMEM16A, as is the case for native CACCs.Citation21,Citation23 The same I-V protocol, as shown in , was used to evoke ITMEM16A and representative examples of currents evoked before and during the presence of niflumic acid (30 µM) are shown in respectively. It is clear that niflumic acid reduced the amplitude of outward ITMEM16A evoked during steps to positive test potentials and prolonged the deactivation of tail currents evoked upon repolarization back to -80 mV. Summary data for 8 similar experiments are plotted in . Niflumic acid (30 µM) reduced mean ITMEM16A amplitude across the voltage range. For example, at +60 mV currents were reduced from 0.97 ± 0.11 to 0.45 ± 0.05 nA and at +100 mV they were decreased from 2.3 ± 0.35 nA to 1.14 ± 0.29 nA (P < 0.05). The mean latency for maximal inhibitory effect of niflumic acid was 99 ± 11 s (n = 5). is a plot of the mean tail current deactivation time constant, evoked upon repolarization to -80 mV, measured as a function of the initial test potential. τ was increased at all potentials by niflumic acid. For example, following the step to +100 mV, τ increased from 131 ± 16 to 873 ± 81 ms (P < 0.05 n = 6). The mean latency for maximal prolongation of tail currents by niflumic acid was 45 ± 11 s (n = 5).
Figure 3. (A and B) Representative I-V relationship of TMEM16A currents before and during the presence of niflumic acid (NFA, 30 µM). (C) Summary current-voltage (I-V) relationship of TMEM16A currents before (open circles) and during (filled squares) exposure to niflumic acid. (D) Plot of mean time constant (τ) of TMEM16A tail current deactivation against prior test pulse potential (control, open circles and niflumic acid, filled squares). (E) TMEM16A currents evoked by a step from -80 to +80 mV in the presence of 1 (red), 3 (blue), 10 (orange), 30 (green) and 100 (purple) µM niflumic acid. (F) Summary concentration effect curve for effect of niflumic acid on TMEM16A currents. Data were fit with the Hill-Langmuir equation.
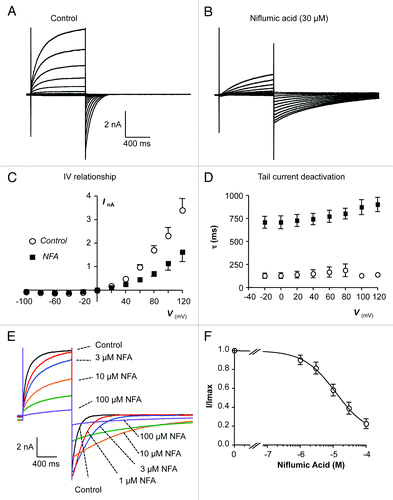
The data presented in confirm that the effects of niflumic acid on ITMEM16A were dependent on concentration. is a family of currents evoked using the voltage step protocol described in . This trace shows that currents evoked during the test potential to +80 mV where inhibited by niflumic acid in concentration dependent manner. However, this recording also highlights that niflumic acid had complex effects on TMEM16A tails currents. For example, peak TMEM16A tail current amplitude was enhanced by low concentrations (1 and 3 µM) of niflumic acid but inhibited by higher concentrations, whereas the rate of TMEM16A tail current deactivation was reduced by all concentrations of niflumic acid. is a summary concentration effect curve for the effect of niflumic acid on the peak TMEM16A current, measured during the test pulse. A fit of these data with the Hill-Langmuir equation gave an IC50 value of 12.1 µM (lower and upper 95% confidence limits range, 4.3 – 34.7 µM).
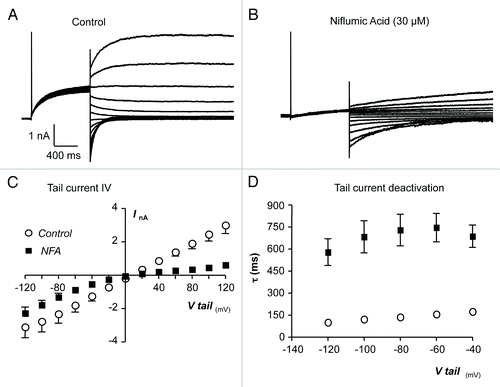
The voltage-dependence of the effects of niflumic acid on TMEM16A tail currents was assessed using the protocol highlighted previously in . The representative currents shown in and summary I-V plot in demonstrate that the inhibitory effects of niflumic acid on TMEM16A tail currents were voltage-dependent. For example, at +100 mV the mean TMEM16A current amplitude was reduced by ~80% from 2.46 ± 0.4 nA to 0.46 ± 0.15 nA, whereas at -100 mV it was only reduced by ~27% from -2.8 ± 0.6 to -1.8 ± 0.28 nA (n = 5).
Figure 4. (A and B) Representative current traces obtained before and during the presence of niflumic acid (30 µM). (C) Summary current-voltage (I-V) relationship of TMEM16A tail currents, evoked following an initial step to +80 mV, before (open circles) and during (filled squares) exposure to niflumic acid. (D) Plot of mean time constant (τ) of TMEM16A tail current deactivation against voltage (control, open circles and niflumic acid, filled squares).
CACCinhA01 is an arylaminothiophene compound, identified in high throughput screening studies as an inhibitor of human intestinal epithelial CACC channels, however its effects on TMEM16A currents have not been fully characterized.Citation29 are typical TMEM16A currents evoked before and during exposure to CACCinhA01 (10 µM) using the same I-V protocol as in . Unlike the effect of A-9-C and niflumic acid, it is clear that CACCinhA01 greatly reduced both outward and inward components of the TMEM16A current. A summary I-V plot showing the effect of CACCinhA01 on mean TMEM16A current amplitude, evoked during the test potential, is shown in . CACCinhA01 reduced the TMEM16A currents across the voltage range by ~90%. For example, at +40 mV currents were reduced by ~92%, from 880 pA ± 181 pA to 67 ± 21 pA and at +100 mV they were reduced by ~89%, from 4.66 ± 0.82 nA to 0.55 ± 0.1 nA (P < 0.05, n = 9). Furthermore, in contrast to A-9-C and niflumic acid, CACCinhA01 enhanced the rate of tail current deactivation across the voltage range (). For example, at +80 mV the mean time constant for deactivation under control conditions was 136 ± 11 ms compared with 35 ± 3 ms in the presence of CACCinhA01 (n = 9, P < 0.05).
Figure 5.(A and B) Representative I-V relationship of TMEM16A currents before and during the presence of CACCinhA01 (10 µM). (C) Summary current-voltage (I-V) relationship of TMEM16A currents before (open circles) and during (filled squares) exposure to CACCinhA01. (D) Plot of mean time constant (τ) of TMEM16A tail current deactivation against prior test pulse potential (control, open circles and CACCinhA01, filled squares). (E) TMEM16A currents evoked by a step from -80 to +80 mV in the presence of 0.1, 0.3, 1, 3, 10, and 30 µM CACCinhA01. (F) Summary concentration effect curve for effect of CACCinhA01 on TMEM16A currents. Data were fit with the Hill-Langmuir equation.
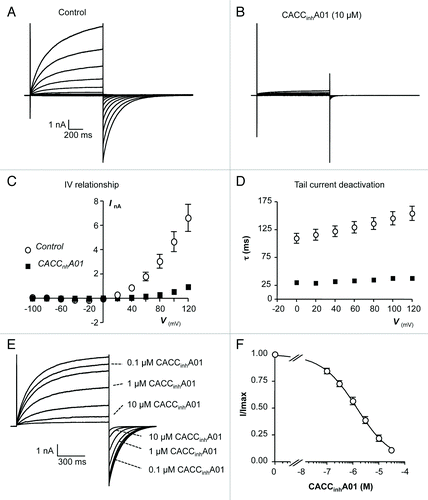
The representative trace and summary concentration effect curve, shown in respectively, demonstrate that the inhibitory effects of CACCinhA01 were concentration dependent. The summary data in were fit with the Hill-Langmuir equation, yielding an IC50 value of 1.7 µM (lower and upper 95% confidence limits range (0.85 – 3.4 µM).
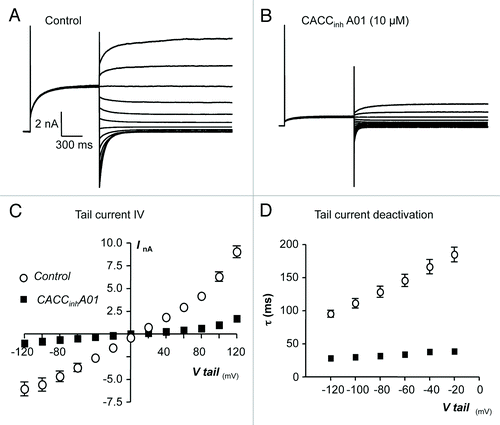
To test if inhibitory effects of CACCinhA01 on TMEM16A tail currents were voltage-dependent, as was the case for A-9-C and niflumic acid, we examined its effects on currents evoked using the same protocol as shown in . Representative current responses in the absence and presence of CACCinhA01 are shown in respectively. Summary data, measured from 9 similar experiments are plotted in , where it can be observed that CACCinhA01 was equally efficacious in reducing inward and outward TMEM16A tail currents. For example CACCinhA01 reduced TMEM16A tail current at -100 mV by 86% from -5.6 ± 0.7 to 0.8 ± 0.18 nA and at +100 mV it was reduced by 84%, from 6.3 ± 0.5 to 1.0 ± 0.14 nA (P < 0.05, n = 9). These data indicate that the inhibitory effects of CACCinhA01 on TMEM16A tail current were not voltage-dependent. The residual tail currents that remained in the presence of CACCinhA01 (10 µM) also de-activated more rapidly than controls. For example at -60 mV the time constant of de-activation under control conditions was 145 ± 9 ms compared with 42 ± 2 ms in the presence of the drug (P < 0.05).
Figure 6. (A and B) Representative current traces obtained before and during the presence of CACCinhA01 (10 µM). (C) Summary current-voltage (I-V) relationship of TMEM16A tail currents, evoked following an initial step to +80 mV, before (open circles) and during (filled squares) exposure to CACCinhA01. (D) Plot of mean time constant (τ) of TMEM16A tail current deactivation against voltage (control, open circles and CACCinhA01, filled squares).
Next we examined the effects of T16AinhA01, a compound identified in small molecule screening studies to selectively inhibit TMEM16A currents without affecting the underlying Ca2+ concentration.Citation17 The representative current responses shown in demonstrate that T16AinhA01 reduced TMEM16A currents across the test potential range. Summary data from 7 similar experiments are shown in the I-V plot in , highlighting that the inhibitory effects of T16AinhA01 were consistent across the voltage range. For example, mean TMEM16A current amplitude measured at +40 and +100 mV were both reduced by 81%, from 334 ± 104 to 63 ± 7 pA at +40 mV and from 1.95 ± 0.46 to 0.37 ± 81 nA at +100 mV (n = 7, P < 0.05). The inhibitory effects of T16AinhA01 on current amplitude were associated with a small increase in the rate of tail current deactivation. For example, the mean time constant for deactivation of the tail current measured at -80 mV, following the test pulse to +40 mV, was 103 ± 11 ms before, compared with 74 ± 19 during application of T16AinhA01. A representative trace and summary concentration-effect curve, derived from 8 similar experiments, is shown in respectively, demonstrating that the inhibitory effects of T16AinhA01 were concentration-dependent. The data were fit with the Hill-Langmuir equation, yielding an IC50 value of 1.51 µM (lower and upper 95% confidence limits range, 0.92 –2.46 µM).
Figure 7. (A and B): Representative I-V relationship of TMEM16A currents before and during the presence of T16AinhA01 (10 µM). (C) Summary current-voltage (I-V) relationship of TMEM16A currents before (open circles) and during (filled squares) exposure to T16AinhA01. (D) Plot of mean time constant (τ) of TMEM16A tail current deactivation against prior test pulse potential (control, open circles and T16AinhA01, filled squares). (E) TMEM16A currents evoked by a step from -80 to +80 mV in the presence of 0.1, 0.3, 1, 3, 10, and 30 µM T16AinhA01. (F) Summary concentration effect curve for effect of T16AinhA01 on TMEM16A currents. Data were fit with the Hill-Langmuir equation.
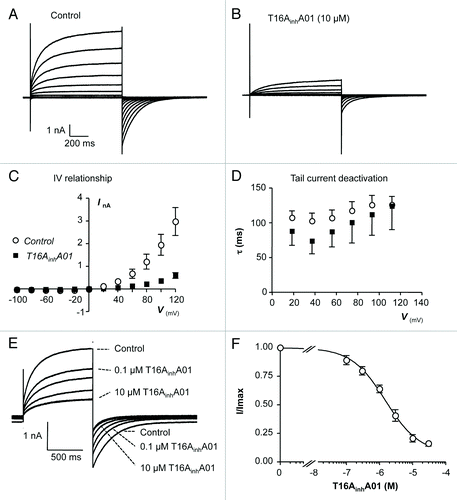
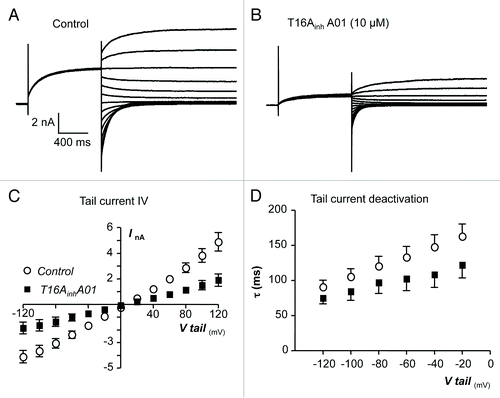
The voltage dependence of the inhibitory effects of T16AinhA01 on TMEM16A tail currents was assessed using the protocol shown in and representative current responses recorded before and during exposure to T16AinhA01 are shown in , respectively. The summary I-V plot in indicates that similar reductions in mean TMEM16A current amplitude were observed at negative and positive membrane potentials. For example, at -60 mV, T16AinhA01 decreased the mean peak tail current amplitude by 57% from -2.37 ± 0.29 to -1.03 ± 0.27 nA and at +60 mV by 60% from 1.99 ± 0.24 to 0.79 ± 0.17 nA (n = 7, P < 0.05). The inhibitory effects on tail current amplitude were also associated with a small increase in their rate of deactivation, which was 133 ± 3 ms at -60 mV under control conditions, compared with 102 ± 17 ms in the presence of T16AinhA01.
Figure 8. (A and B) Representative current traces obtained before and during the presence of T16AinhA01 (10 µM). (C) Summary current-voltage (I-V) relationship of TMEM16A tail currents, evoked following an initial step to +80 mV, before (open circles) and during (filled squares) exposure to T16AinhA01. (D) Plot of mean time constant (τ) of TMEM16A tail current deactivation against voltage (control, open circles and T16AinhA01, filled squares).
Discussion
Several studies have shown that TMEM16A currents are inhibited by the traditional CACC inhibitors, A-9-C and niflumic acid.Citation2 However, prior to the present study, the effects of these agents had not been fully characterized and the paradoxical stimulatory effects of these agents, observed on native CACC, had not been reported for expressed TMEM16A channels.Citation21-Citation23 In this study we used the whole cell voltage clamp technique to examine the effect of A-9-C, niflumic acid, CACCinhA01 and T16AinhA01 on HEK cells that overexpressed human TMEM16A variant 1, which contains the alternatively spiced regions referred to as a, c, and d, but not region b that is thought to be involved in the Ca2+ sensitivity of the channel.Citation25
Niflumic acid has been described as the most potent inhibitor of IClCa and is commonly used to investigate TMEM16A activity.Citation3-Citation5,Citation14,Citation15 There are large variations in the reported IC50 values of niflumic acid with regard to inhibition of native CACCs and expressed TMEM16A currents. For example, Hogg et al., 1994 and Romanenko et al., 2009 showed that niflumic inhibited CACCs in isolated rabbit portal vein myocytes and submandibular gland acinar cells, with IC50 values of 2.3 µM and 2.5 µM, respectively.Citation14,Citation18 However, in rabbit coronary myocytes the IC50 for niflumic acid on CACC was 159 µM.Citation23 There are several complicating factors that may explain the disparity in potency of niflumic acid on CACCs in different preparations. For example, it’s effects have been noted to depend on membrane potential, Ca2+ concentration, phosphorylation state and on the method used to activate CACC, for example, using Ca2+ mobilizing agonists or by dialyzing cells with fixed Ca2+ concentrations.Citation18,Citation21-Citation24 Determination of IC50 values for inhibition of CACCs by niflumic acid is also complicated by a paradoxical stimulation of CACCs, that masks it’s inhibitory effects at negative membrane potentials.Citation21,Citation22,Citation24 Prior to the present study, this effect had not been observed for TMEM16A encoded currents in heterologous expression systems, raising a question mark against the contribution of TMEM16A to native CACCs in vascular smooth muscle.Citation30 The data presented in the present study confirm that enhancement of CACCs, produced by niflumic acid in vascular smooth muscle, is indeed a feature of TMEM16A encoded channels and therefore strengthens the idea that CACCs in vascular myocytes involve TMEM16A expression.Citation9,Citation30,Citation31
A-9-C is structurally unrelated to niflumic acid, however it is also an effective CACC inhibitor.Citation14,Citation18,Citation22,Citation26-Citation28 Furthermore, it also exerts stimulatory effects on CACCs, in a similar fashion to niflumic acid.Citation21,Citation22 In the present study we found that A-9-C produced a pronounced, voltage-dependent, bimodal effect on TMEM16A currents. Thus, at positive potentials it potently reduced the currents, whereas at negative membrane potentials it enhanced TMEM16A tail current amplitude and prolonged the rate of tail current deactivation. The IC50 value for the inhibitory effect of A-9-C on TMEM16A currents in the present study was 58 µM. This is similar to values obtained on native CACCs in rabbit portal vein (90 µM) and in submandibular gland acinar cells (35 µM).Citation14,Citation18 The effect of A-9-C on TMEM16A tail current deactivation kinetics were also voltage-dependent, however, in contrast to its action on tail current amplitude, more pronounced effects were observed at less negative potentials. Again, this observation is notably similar to data previously obtained from native CACCs in vascular SMC, as Piper and Greenwood (2003) reported that A-9-C increased the time constant for tail current deactivation at -80 mV from 68 to 79 ms, whereas at -20 mV it slowed the decay from 81 to 172 ms.Citation22
It is interesting to contrast the effects of niflumic acid and A-9-C in the present study. Both agents had bimodal effects on TMEM16A currents, however niflumic acid had more dramatic effects on tail current deactivation kinetics, whereas A-9-C had a larger stimulatory effect on tail current amplitude. Part of this effect may be due to the concentration of niflumic acid used (30 µM), as lower concentrations (1–3 µM) were noted to have larger potentiating effects. However, it is also likely that these agents interact with the channel in slightly different ways. Previous studies have postulated that niflumic acid and A-9-C could interact with multiple binding sites on CACCs (inhibitory and stimulatory) with different affinities.Citation22,Citation23 It is thought that differences between A-9-C and niflumic acid reflect a stronger voltage-dependent association of A-9-C with CACCs, such that depolarization causes pronounced inhibition of the channel, followed by rapid unbinding upon repolarisation, resulting in tail currents that are initially larger, but then deactivate in a normal fashion.Citation22 The results of the present study are consistent with this model.
The question arises as to why stimulatory effects of A-9-C or niflumic acid were not previously observed on expressed TMEM16A currents. In many cases it may simply be that stimulatory effects were not reported, however in others it may be because of differences in experimental conditions. For example, the initial studies on TMEM16A examined the effects of niflumic acid on TMEM16A currents evoked at fixed potentials using endothelin, ionomycin or inositol trisphosphate (Ins(1,4,5)P3) respectively, as opposed to voltage stepping protocols.Citation3-Citation5 In others it is likely that the concentration of niflumic acid used was too high (100 µM).Citation14 However, there is also the intriguing possibility that the stimulatory effects may be linked to specific TMEM16A splice variants. Indeed, molecular analyses of TMEM16A expression in vascular smooth muscle confirmed that TMEM16A transcripts, lacking region b were present in murine portal vein, carotid artery and thoracic aorta, consistent with the TMEM16A variant used in the present study.Citation30 Future studies should examine if TMEM16A channel pharmacology is affected by the alternative inclusion, or skipping, of regions a, b, c, and d.
TMEM16A currents in the present study were inhibited by CACCinhA01 and T16AinhA01 with IC50 values of 1.7 and 1.5 µM, respectively. These data are consistent with a previous study by Namkung et al., 2011, which, using short-circuit chloride current recordings in FRT cells that express TMEM16A, were inhibited by CACCinhA01 and T16AinhA01 with IC50 values of 2.1 and 1.1 µM, respectively.Citation17 Interestingly however, in contrast with niflumic acid and A-9-C, the inhibitory effect of these drugs was not voltage-dependent and stimulatory effects on tail current amplitude and duration at negative potentials were not observed. The exact reason for lack of stimulatory effects by these agents was not investigated in the present study, however it is possible that CACCinhA01 and T16AinhA01 act by blocking the TMEM16A channel pore, or alternatively, it may be that these agents bind to an inhibitory site on the channel, but not a stimulatory site, as has been suggested for niflumic acid and A-9-C.Citation21,Citation23
So far investigators have used T16AinhA01 to reveal a role for TMEM16A in various physiological roles including the acrosome reaction in mammalian spermataoa (Orta et al., 2012)33 proliferation of interstitial cells of Cajal (Mazzone et al., 2012)Citation34 and contraction of vascular smooth muscle (Davis et al., 2013).Citation32The results of the present study suggest that these agents could be useful tools to further investigate the functional role of TMEM16A channels, however, as with all pharmacological agents, their utility will be dependent on their selectivity. Studies that have examined this issue have suggested that T16AinhA01 may be more selective for TMEM16A channels than CACCinhA01. Namkung et al., 2011 showed that CaCCinh-A01, fully inhibited CaCC current in human bronchial and intestinal cells, whereas T16AinhA01 poorly inhibited total CaCC current in these cells, but mimicked the effect of TMEM16A RNAi knockdown, by selectively inhibiting an initial, agonist-stimulated transient chloride current. Therefore it appears that CACCinhA01 may affect CACCs other than those encoded by TMEM16A. Davis et al., 2010 showed that T16AinhA01 does not inhibit L-type Ca2+ channels, or open a range of K+ channels, including K+ATP, KCNQ and KCa3.1 channels.Citation30 However, this is not a definitive list and care should be taken in future studies when using these drugs to identify the contribution of TMEM16A to native CACCs.
In summary, the data in the present study demonstrates that the classical CACC inhibitors, niflumic acid and A-9-C, produced a bimodal inhibition and stimulation of TMEM16A channels that resembled effects previously observed on CACCs in vascular smooth muscle. CACCinhA01 and T16AinhA01 were more potent inhibitors of TMEM16A channels and their effects were not diminished at negative membrane potentials. The ability of these agents to block TMEM16A channels over the physiological range of membrane potentials, without a stimulatory effect on the channel, make these agents attractive candidates to interrogate the functional role of TMEM16A channels in future studies.
Materials and Methods
Human embryonic kidney cells
A cDNA fragment encoding the gene for human TMEM16A transcript 1 (GI:194306539) was transferred from a commercially obtained cloning vector (Genecopoeia; Z8207) into the expression plasmid pIRESpuro3. Linearized expression vector was transfected into human embryonic kidney (HEK 293) cells and clones expressing high levels of human TMEM16A were selected using the antibiotic puromycin. The resulting polyclonal stable cell line was cultured using the manufacturer’s protocols. Briefly, cells were cultured at 37 °C using DMEM (Invitrogen) containing 10% fetal bovine serum and penicillin-streptomycin, in a humidified incubator under 5% CO2.
Whole cell patch clamp recordings
Currents were recorded from HEK 293 cells that expressed TMEM16A at room temperature using the whole cell patch clamp technique. Pipettes were pulled from borosilicate glass capillary tubing (1.5mm outer diameter, 1.17 mm inner diameter; Clark Medical Instruments) to a tip of diameter approximately 1–1.5 µm and resistance of 2–4 MΩ. Voltage clamp commands were delivered via an Axopatch 1D patch clamp amplifier (Axon Instruments) connected to a Digidata 1322A AD/DA converter (Axon Instruments) interfaced to a computer running pClamp software (Axon Instruments).
Solutions and drugs
The solutions used were of the following composition (mM): Hanks: 130 Na+, 5.8 K+, 135 Cl-, 4.16 HCO3-, 0.34 HPO32-, 0.44 H2PO4-, 1.8 Ca2+, 0.9 Mg2+, 0.4 SO42-, 10 dextrose, 2.9 sucrose, 10 HEPES, pH adjusted to 7.4 with NaOH; Whole cell pipette solution: CsCl (130), MgCl2 (1.0), CaCl2 (4.9, resulting in a free Ca2+ concentration of 171 nM) EGTA (10), ATP (1.0) HEPES (10), pH adjusted to 7.2 with CsOH. Drugs used were niflumic acid and A-9-C (Sigma) and T16AinhA01 and CACCinhA01 (Tocris).
Statistics
Summary data are presented as the mean ± SEM and statistical differences in experiments were compared using Students paired t test, taking the P < 0.05 level as significant. Concentration-effect data were fitted with a Hill-Langmuir equation: I/Icontrol = 1/{1 + 10^(log[Drug]) -log(IC50)}, where I is the current recorded in the drug, Icontrol is the current in the absence of drug, IC50 is the half-maximal effective concentration, and [Drug] is the concentration variable. In each case, IC50 is stated, followed by the lower and upper 95% confidence limits (presented in parentheses).
| Abbreviations: | ||
| TMEM16A | = | transmembrane protein 16 A |
| CACCs | = | calcium-activated chloride channels |
| I ClCa | = | Ca2+-activated Cl- current |
| A-9-C | = | anthracene-9-carboxcylic acid |
| HEK | = | human embryonic kidney |
| SMC | = | smooth muscle cells |
| CFTR | = | cystic fibrosis transmembrane conductance regulator |
| NFA | = | niflumic acid |
Disclosure of Potential Conflicts of Interest
No potential conflicts of interest were disclosed.
Acknowledgments
The authors are grateful for technical support provided by Billie McIlveen and for helpful discussions with Professor Iain Greenwood. Stephen Fedigan is sponsored by the Research Office at Dundalk Institute of Technology and Dr Tim Webb was funded under the Applied Research Enhancement scheme by Enterprise Ireland.
References
- Hartzell C, Putzier I, Arreola J. Calcium-activated chloride channels. [Review] Annu Rev Physiol 2005; 67:719 - 58; http://dx.doi.org/10.1146/annurev.physiol.67.032003.154341; PMID: 15709976
- Huang F, Wong X, Jan LY. International Union of Basic and Clinical Pharmacology. LXXXV: calcium-activated chloride channels. Pharmacol Rev 2012; 64:1 - 15; http://dx.doi.org/10.1124/pr.111.005009; PMID: 22090471
- Caputo A, Caci E, Ferrera L, Pedemonte N, Barsanti C, Sondo E, Pfeffer U, Ravazzolo R, Zegarra-Moran O, Galietta LJ. TMEM16A, a membrane protein associated with calcium-dependent chloride channel activity. Science 2008; 322:590 - 4; http://dx.doi.org/10.1126/science.1163518; PMID: 18772398
- Schroeder BC, Cheng T, Jan YN, Jan LY. Expression cloning of TMEM16A as a calcium-activated chloride channel subunit. Cell 2008; 134:1019 - 29; http://dx.doi.org/10.1016/j.cell.2008.09.003; PMID: 18805094
- Yang YD, Cho H, Koo JY, Tak MH, Cho Y, Shim WS, Park SP, Lee J, Lee B, Kim BM, et al. TMEM16A confers receptor-activated calcium-dependent chloride conductance. Nature 2008; 455:1210 - 5; http://dx.doi.org/10.1038/nature07313; PMID: 18724360
- Rock JR, Futtner CR, Harfe BD. The transmembrane protein TMEM16A is required for normal development of the murine trachea. Dev Biol 2008; 321:141 - 9; http://dx.doi.org/10.1016/j.ydbio.2008.06.009; PMID: 18585372
- Huang F, Rock JR, Harfe BD, Cheng T, Huang X, Jan YN, Jan LY. Studies on expression and function of the TMEM16A calcium-activated chloride channel. Proc Natl Acad Sci U S A 2009; 106:21413 - 8; http://dx.doi.org/10.1073/pnas.0911935106; PMID: 19965375
- Rock JR, Harfe BD. Expression of TMEM16 paralogs during murine embryogenesis. Dev Dyn 2008; 237:2566 - 74; http://dx.doi.org/10.1002/dvdy.21676; PMID: 18729231
- Manoury B, Tamuleviciute A, Tammaro P. TMEM16A/anoctamin 1 protein mediates calcium-activated chloride currents in pulmonary arterial smooth muscle cells. J Physiol 2010; 588:2305 - 14; http://dx.doi.org/10.1113/jphysiol.2010.189506; PMID: 20421283
- Dutta AK, Khimji AK, Kresge C, Bugde A, Dougherty M, Esser V, Ueno Y, Glaser SS, Alpini G, Rockey DC, et al. Identification and functional characterization of TMEM16A, a Ca2+-activated Cl- channel activated by extracellular nucleotides, in biliary epithelium. J Biol Chem 2011; 286:766 - 76; http://dx.doi.org/10.1074/jbc.M110.164970; PMID: 21041307
- Large WA, Wang Q. Characteristics and physiological role of the Ca(2+)-activated Cl- conductance in smooth muscle. [Review] Am J Physiol 1996; 271:C435 - 54; PMID: 8769982
- Saleh SN, Greenwood IA. Activation of chloride currents in murine portal vein smooth muscle cells by membrane depolarization involves intracellular calcium release. Am J Physiol Cell Physiol 2005; 288:C122 - 31; PMID: 15355851
- Toland HM, McCloskey KD, Thornbury KD, McHale NG, Hollywood MA. Ca(2+)-activated Cl(-) current in sheep lymphatic smooth muscle. Am J Physiol Cell Physiol 2000; 279:C1327 - 35; PMID: 11029279
- Romanenko VG, Catalán MA, Brown DA, Putzier I, Hartzell HC, Marmorstein AD, Gonzalez-Begne M, Rock JR, Harfe BD, Melvin JE. Tmem16A encodes the Ca2+-activated Cl- channel in mouse submandibular salivary gland acinar cells. J Biol Chem 2010; 285:12990 - 3001; http://dx.doi.org/10.1074/jbc.M109.068544; PMID: 20177062
- Kunzelmann K, Schreiber R, Kmit A, Jantarajit W, Martins JR, Faria D, Kongsuphol P, Ousingsawat J, Tian Y. Expression and function of epithelial anoctamins. Exp Physiol 2012; 97:184 - 92; PMID: 21908539
- Piper AS, Large WA. Multiple conductance states of single Ca2+-activated Cl- channels in rabbit pulmonary artery smooth muscle cells. J Physiol 2003; 547:181 - 96; http://dx.doi.org/10.1113/jphysiol.2002.033688; PMID: 12562904
- Namkung W, Phuan PW, Verkman AS. TMEM16A inhibitors reveal TMEM16A as a minor component of calcium-activated chloride channel conductance in airway and intestinal epithelial cells. J Biol Chem 2011; 286:2365 - 74; http://dx.doi.org/10.1074/jbc.M110.175109; PMID: 21084298
- Hogg RC, Wang Q, Large WA. Action of niflumic acid on evoked and spontaneous calcium-activated chloride and potassium currents in smooth muscle cells from rabbit portal vein. Br J Pharmacol 1994; 112:977 - 84; http://dx.doi.org/10.1111/j.1476-5381.1994.tb13177.x; PMID: 7921628
- Hogg RC, Wang Q, Large WA. Time course of spontaneous calcium-activated chloride currents in smooth muscle cells from the rabbit portal vein. J Physiol 1993; 464:15 - 31; PMID: 8229796
- Greenwood IA, Large WA. Analysis of the time course of calcium-activated chloride “tail” currents in rabbit portal vein smooth muscle cells. Pflugers Arch 1996; 432:970 - 9; http://dx.doi.org/10.1007/s004240050224; PMID: 8781190
- Piper AS, Greenwood IA, Large WA. Dual effect of blocking agents on Ca2+-activated Cl(-) currents in rabbit pulmonary artery smooth muscle cells. J Physiol 2002; 539:119 - 31; http://dx.doi.org/10.1113/jphysiol.2001.013270; PMID: 11850506
- Piper AS, Greenwood IA. Anomalous effect of anthracene-9-carboxylic acid on calcium-activated chloride currents in rabbit pulmonary artery smooth muscle cells. Br J Pharmacol 2003; 138:31 - 8; http://dx.doi.org/10.1038/sj.bjp.0705000; PMID: 12522070
- Ledoux J, Greenwood IA, Leblanc N. Dynamics of Ca2+-dependent Cl- channel modulation by niflumic acid in rabbit coronary arterial myocytes. Mol Pharmacol 2005; 67:163 - 73; http://dx.doi.org/10.1124/mol.104.004168; PMID: 15465927
- Wiwchar M, Ayon R, Greenwood IA, Leblanc N. Phosphorylation alters the pharmacology of Ca(2+)-activated Cl channels in rabbit pulmonary arterial smooth muscle cells. Br J Pharmacol 2009; 158:1356 - 65; http://dx.doi.org/10.1111/j.1476-5381.2009.00405.x; PMID: 19785656
- Ferrera L, Caputo A, Ubby I, Bussani E, Zegarra-Moran O, Ravazzolo R, Pagani F, Galietta LJ. Regulation of TMEM16A chloride channel properties by alternative splicing. J Biol Chem 2009; 284:33360 - 8; http://dx.doi.org/10.1074/jbc.M109.046607; PMID: 19819874
- Cotton KD, Hollywood MA, McHale NG, Thornbury KD. Ca2+ current and Ca(2+)-activated chloride current in isolated smooth muscle cells of the sheep urethra. J Physiol 1997; 505:121 - 31; http://dx.doi.org/10.1111/j.1469-7793.1997.121bc.x; PMID: 9409476
- Sergeant GP, Hollywood MA, McCloskey KD, Thornbury KD, McHale NG. Specialised pacemaking cells in the rabbit urethra. J Physiol 2000; 526:359 - 66; http://dx.doi.org/10.1111/j.1469-7793.2000.t01-2-00359.x; PMID: 10896724
- Akbarali HI, Giles WR. Ca2+ and Ca(2+)-activated Cl- currents in rabbit oesophageal smooth muscle. J Physiol 1993; 460:117 - 33; PMID: 7683715
- De La Fuente R, Namkung W, Mills A, Verkman AS. Small-molecule screen identifies inhibitors of a human intestinal calcium-activated chloride channel. Mol Pharmacol 2008; 73:758 - 68; http://dx.doi.org/10.1124/mol.107.043208; PMID: 18083779
- Davis AJ, Forrest AS, Jepps TA, Valencik ML, Wiwchar M, Singer CA, Sones WR, Greenwood IA, Leblanc N. Expression profile and protein translation of TMEM16A in murine smooth muscle. Am J Physiol Cell Physiol 2010; 299:C948 - 59; http://dx.doi.org/10.1152/ajpcell.00018.2010; PMID: 20686072
- Thomas-Gatewood C, Neeb ZP, Bulley S, Adebiyi A, Bannister JP, Leo MD, Jaggar JH. TMEM16A channels generate Ca²⁺-activated Cl⁻ currents in cerebral artery smooth muscle cells. Am J Physiol Heart Circ Physiol 2011; 301:H1819 - 27; http://dx.doi.org/10.1152/ajpheart.00404.2011; PMID: 21856902
- Davis AJ, Shi J, Pritchard HA, Chadha PS, Leblanc N, Vasilikostas G, Yao Z, Verkman AS, Albert AP, Greenwood IA. Potent vasorelaxant activity of the TMEM16A inhibitor T16A(inh) -A01. Br J Pharmacol 2013; 168:773 - 84; http://dx.doi.org/10.1111/j.1476-5381.2012.02199.x; PMID: 22946562
- Orta G, Ferreira G, José O, Treviño CL, Beltrán C, Darszon A. Human spermatozoa possess a calcium-dependent chloride channel that may participate in the acrosomal reaction. J Physiol 2012; 590:2659 - 75; http://dx.doi.org/10.1113/jphysiol.2011.224485; PMID: 22473777
- Mazzone A, Eisenman ST, Strege PR, Yao Z, Ordog T, Gibbons SJ, Farrugia G. Inhibition of cell proliferation by a selective inhibitor of the Ca(2+)-activated Cl(-) channel, Ano1. Biochem Biophys Res Commun 2012; 427:248 - 53; http://dx.doi.org/10.1016/j.bbrc.2012.09.022; PMID: 22995309