
Abstract
Death of murine T cells induced by extracellular ATP is mainly triggered by activation of purinergic P2X7 receptors (P2X7Rs). However, a link between P2X7Rs and pannexin1 (Panx1) channels, which are non-selective, has been recently demonstrated in other cell types. In this work, we characterized the expression and cellular distribution of pannexin family members (Panxs 1, 2 and 3) in isolated T cells. Panx1 was the main pannexin family member clearly detected in both helper (CD4+) and cytotoxic (CD8+) T cells, whereas low levels of Panx2 were found in both T-cell subsets. Using pharmacological and genetic approaches, Panx1 channels were found to mediate most ATP-induced ethidium uptake since this was drastically reduced by Panx1 channel blockers (10Panx1, Probenecid and low carbenoxolone concentration) and absent in T cells derived from Panx1−/− mice. Moreover, electrophysiological measurements in wild-type CD4+ cells treated with ATP unitary current events and pharmacological sensitivity compatible with Panx1 channels were found. In addition, ATP release from T cells treated with 4Br-A23187, a calcium ionophore, was completely blocked with inhibitors of both connexin hemichannels and Panx1 channels. Panx1 channel blockers drastically reduced the ATP-induced T-cell mortality, indicating that Panx1 channels mediate the ATP-induced T-cell death. However, mortality was not reduced in T cells of Panx1−/− mice, in which levels of P2X7Rs and ATP-induced intracellular free Ca2+ responses were enhanced suggesting that P2X7Rs take over Panx1 channels lose-function in mediating the onset of cell death induced by extracellular ATP.
Introduction
Extracellular ATP is known to play relevant roles in diverse responses of T cells,Citation1 including CD27, CD23 and CD62L shedding,Citation2,Citation3 secretion of IL-2 and IFN-γ,Citation4 cell proliferation and antigen presentation.Citation5-Citation7 In murine T cells, extracellular ATP signaling is transduced mainly, if not exclusively, through the P2X7 receptor (P2X7R).Citation8 This receptor is unique among other P2X receptors, and 4 main features distinguish it from others: (1) it presents an unusual long C terminus, known to interact with a variety of cytoskeletal and signaling proteins;Citation9 (2) its activation requires high (> 100 µM) ATP concentrations; (3) the activation process can exhibit striking changes in time course and amplitude after prolonged application of agonists and (4) cells expressing P2X7Rs are susceptible to lyses after a sustained activation of the receptor.Citation10-Citation12 Lately, P2X7R has been proposed to interact with multiple permeation pathways, although so far only those formed by pannexin1 (Panx1) channels have been demonstrated to interact with it. These channels have been shown to mediate increases both in membrane current amplitude and membrane permeability induced by extracellular ATP.Citation13,Citation14
Pannexins (Panxs) are a family of 3 membrane glycoproteins termed Panx1, Panx2, and Panx3.Citation15 Panx1 forms membrane channels permeable to small signaling molecules (< 1 kDa), including ATP.Citation16 Since Panx1 channels are widely expressed in most cell types, they might represent one of the most commonly used cellular pathways for ATP release.Citation17 Different cellular processes, including mechanical stress, membrane depolarization and intracellular Ca2+ signals are known to open Panx1 channels.Citation18 Interestingly, ATP itself can activate Panx1 channels via a purinergic receptor-dependent mechanism,Citation13,Citation14 although high extracellular ATP concentrations can also inhibit Panx1 channels rapidly and reversibly.Citation19,Citation20
Despite the fact that Panx1 channels were recently discovered, they have already been shown to be involved in a wide variety of cellular functions in the immune system. For instance, diverse immune cells including macrophages, neutrophils, microglia and T cells express Panx1.Citation17,Citation21-Citation24 Panx1 was also found to be critical for the cryopyrin-dependent caspase-1 activation and IL-1β secretion induced by diverse microbial stimuli.Citation14,Citation25-Citation28 Additionally, it participates in monocyte recruitment by apoptotic cells that use this channel as pathway for ATP and UTP release,Citation21,Citation29 and is essential for T-cell activation.Citation7,Citation24
Although the presence of Panx1 has been demonstrated in T cells, a detailed characterization including cellular distribution, pharmacological and functional properties, as well as the presence of other Panx family members has not been reported. In the present work, several aspects of these issues were studied. We found Panx1 and a small amount of Panx2 at the cellular membrane of T cells. The former expresses functional Panx1 channels that serve as the main cell membrane pathway for ATP-induced uptake of small molecules and mediates the ATP-induced T-cell death. We also found that P2X7Rs are overexpressed in T cells of Panx1−/− mice and retain their sensitivity to ATP, suggesting that P2X7Rs take over the lost function of Panx1 channels.
Results
Panx1 and Panx2, but not Panx3, are expressed by T cells and cells of peripheral immune organs
Even though the function and expression of Panx1 has been described in helper T cells,Citation7,Citation24 currently there is no report describing the expression of other members of the Panx family in T cells. To address this issue, we first examined the presence of Panxs in isolated T cells and lymphoid tissues by RT-PCR and western blot analyses. RT-PCR analyses indicated that T cells expressed both Panx1 and Panx2 mRNA as revealed by the amplicon bands displayed at ∼280 bp for Panx1 and ∼270 bp for Panx2, similar to the ones present in proliferating C2C12 cellsCitation30 used as positive controls (). In contrast, Panx3 was not detected in T cell samples but was present in C2C12 cells ().
Figure 1. Panxs 1 and 2 are present in mouse T cells and secondary lymphoid organs. (A) RT-PCR products generated with specific primers for Panx1, Panx2 and Panx3 were obtained from RNA extracts of T cells isolated from lymph nodes of Balb/c mice and C2C12 cells used as positive control. Panx1 amplicon was detected from RNA purified from T cells and C2C12 cells at the expected electrophoretic mobility (∼280 bp). Panx2 amplicon was also present in both samples (∼270 bp). However, Panx3 amplicon was detected in C2C12 cells but not in T cells. No amplicons were detected in samples having RNA-DNase or water (not shown) that were used as DNA-contamination controls for mRNA isolation and PCR amplification control, respectively. (B) Immunoblot of Panx1 in total homogenates of mouse blood, thymus, axillar lymph nodes and spleen, as well as freshly isolated T cells obtained from lymph nodes of BALB/c mice and Jurkat cells. C2C12 cells and mouse brain were used as positive controls. One to four main bands reactive to anti-Panx1 antibody were detected at 45–50 kDa and 90 kDa. (C) Immunoblot analysis of Panx2 in total homogenates of spleen, thymus and lymph node. Brain was used as Panx2 positive control. Panx2 reactive bands were detected mainly between 90–110 kDa.
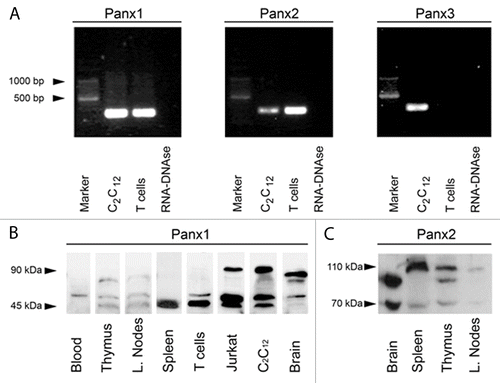
Also, relative levels of Panx1 in total cells and lymphoid tissue homogenates from BALB/c mice were evaluated by immunoblotting. The band profile of Panx1 included 1–3 bands between ~45 and ~90 kDa that were present in different samples (). Two bands with electrophoretic mobility between ~45 kDa and ~50 kDa, which correspond to the non-glycosylated (immature, fastest) and glycosylated (mature, second fastest) forms of Panx1Citation31 were present in most analyzed samples (). However, only the mature form of Panx1 was detected in red blood cell homogenates, while the immature one was detected in spleen (). In addition, a third band that might represent a Panx1 dimer at ~90 kDa was also detected in thymus, lymph nodes and brain, as well as in both Jurkat and C2C12 cells. Additional bands were also present in brain samples, possibly representing Panx1 isoforms as those described by Li and colleagues.Citation32 In support to the specificity of the antibody used, all bands detected with the anti-Panx1 antibody were not observed in immunoblots developed with antibody preabsorbed with the antigenic peptide (not shown).
Lastly, we examined the presence of Panx2 in different lymphoid tissues by using confocal immunofluorescence and a commercial anti-Panx2 antibody. We found that in addition to the monomeric Panx2 detected at 70 kDa a second band of ~110 kDa, similar to the one detected in the cochlea by Wang and colleaguesCitation33, was also evident in all 3 lymphoid tissues analyzed. In addition, a third band at ~98 kDa, that might correspond to the palmitoylated state of the proteinCitation34 was detected in both brain and thymus homogenates (). The Panx2 mRNA was not detected in human T cells (not shown). In addition and consistent with the PCR finding, we did not detect Panx3 reactivity by western blot or immunofluorescence analyses in T cells (not shown).
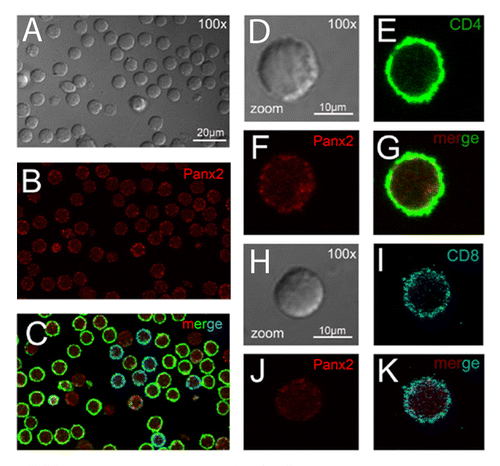
Panxs 1 and 2 are located near the cell membrane of both helper and cytotoxic T cells
We studied the distribution of Panxs 1 and 2 in acute T-cell cultures. T cells were labeled with anti-CD4 and anti-CD8 antibodies together with anti-Panx1 and anti-Panx2 antibodies, respectively. Under resting conditions, both Panxs were detected in the majority (100% Panx1 and ∼98% Panx2) of helper (CD4+) and cytotoxic (CD8+) T-cell subsets (Panx1 in and ; Panx2 in and ). Each Panx was localized mainly at or under the cell membrane. However, in both T-cell subsets fluorescent intensity of Panx1 seemed greater than that of Panx2, as observed by FACS using saturating antibody concentrations (Fig. S1). In addition, neither CD4+ nor CD8+ T cells presented a significant difference in total levels of Panx1 or Panx2 measured by flow cytometry ().
Figure 2. Resting T lymphocytes present high Panx1 reactivity. Confocal immunofluorescence microphotographs that depict helper and cytotoxic T cells showing CD4 (in green), CD8 (in blue), and Panx1 (in red) immunoreactivity. (A–C) Representative field of T cells obtained from the lymph nodes of Balb/c mice (calibration bar: 20 μm). In (D–G) and (H–K), it is shown a detailed view of Panx1 distribution in helper and cytotoxic T cells, respectively (calibration bar: 10 μm). Bright fields of fluorescent views are shown in gray (A, D, and H).
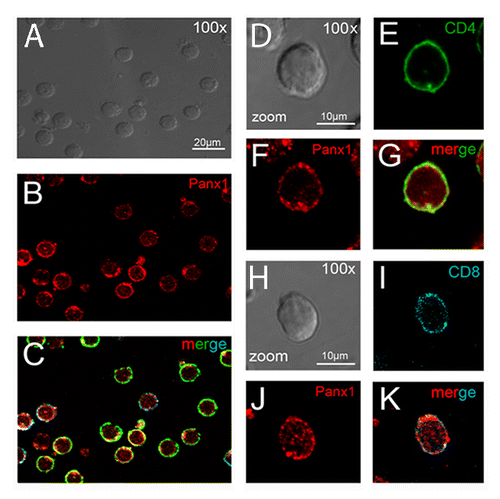
Figure 4. Relative levels of Panx1 and Panx2 in CD4+ and CD8+ T cells. Cells obtained from peripheral lymph nodes were stained for CD4 or CD8 and Panx1 (left panels) or Panx2 (right panels) and analyzed with flow cytometry. Representative counter plots for Panx1 and Panx2 positive cells are presented. The tilted shaded histograms represent staining for Panx1 or Panx2 and blank histograms represent staining for an isotype control antibody for CD4 (A) or CD8 (B). Each result is representative of 4 different mice.
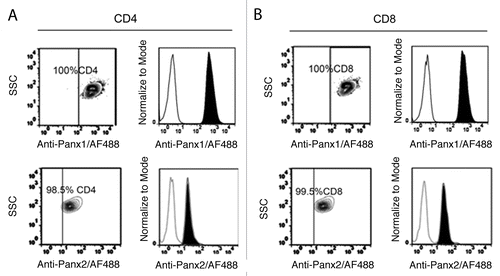
Figure 3. Resting T cells present low Panx2 reactivity. (A–C) Representative confocal immunofluorescence microphotograph from enriched cultures of T cells derived from lymph nodes of Balb/c mice showing CD4 (in green), CD8 (in blue) and Panx2 (in red) reactivity (calibration bar: 20 μm). Detailed views of Panx2 distribution in CD4+ (D–G) and CD8+ lymphocytes (H–K) are illustrated (calibration bar: 10 μm). Bright fields of fluorescent views are shown in gray (A, D, and H).
Electrophysiological recordings of Panx1 channel currents in CD4+ T cells
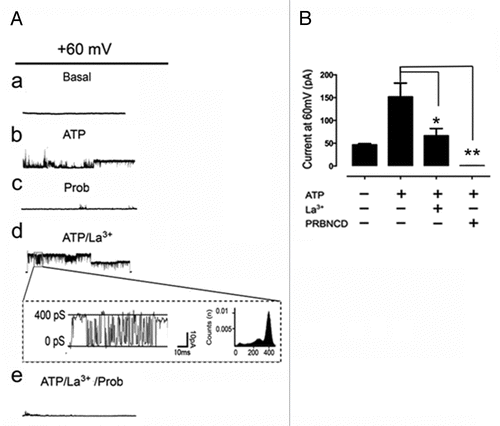
To further demonstrate the presence of functional Panx channels at the T-cell membrane, we measured the macroscopic and microscopic membrane currents generated by the application of 2 transmembrane voltage protocols in the absence and presence of extracellular ATP. In patch clamp experiments using whole cell configuration and intracellular solution that excludes most selective ion channels, we searched for discrete current events after the application of positive and negative membrane potentials. The total membrane current was evaluated under control condition and right after treatment with 500 μM ATP. Additionally, it was applied either a ramp voltage protocol from -80 to + 80 mV or rectangular voltage steps with increments of 20 mV. The total current measured under these conditions showed a rather linear I-V relationship with reversal potential at 0 mV, consistent with the presence of non-selective channels (). Treatment with ATP increased the slope of the current trace recorded during the voltage ramp application (), indicating the opening of non-selective ATP responsive channels. In the same way, the application of rectangular voltage steps under resting conditions (not treated with ATP) promoted a small increment in macroscopic currents, and current traces did not show discrete microscopic current transitions (58/60 successful patches) (, see Basal). However, right after the addition of ATP the total current increase promoted by each voltage step was larger than that under control conditions, and discrete microscopic current transitions were evident, particularly at positive potentials (, ATP). Then, we searched for single channel events using voltage steps from 0 to +60 mV. As a result, 4 consecutive sweeps were done for each protocol allowing us to follow the time course of current transition changes from the time of ATP addition and on. Under control conditions (just voltage step), no discrete current events were found (, 0 s). However, bath application of ATP (at time > 20 s) promoted trains of small current events of ∼20 pS, likely to correspond to P2X7Rs, while after ∼80 s of recording large current events with single channel conductance of ∼400 pS were recorded (, right records) and remained open for more than 120 s (). At this time, the application of 200 μM La3+ (), a connexin hemichannels (Cx HCs) blocker, P2X receptors and TRP channel blockerCitation35 did not reduce the amplitude or frequency of these large unitary events. On the contrary, treatment with 1 mM Probenecid completely reduced the ATP-induced unitary current events (n = 4) ( [c, e] and B), suggesting that these large current events can be attributed mainly to Panx1 rather than Panx2 channels, since the latter are not sensitive to Probenecid.Citation33
Figure 5. Electrophysiological characterization of cell membrane currents in T cells stimulated with ATP. Membrane currents were measured using whole cell voltage-clamp configuration in freshly isolated murine T cells. (A) Ramp voltage protocols from -80 to +80 mV were applied during 4 s in cells under control conditions or after stimulation with 500 μM ATP (gray line). The slope of the current trace in control cells was 0.03 ± 0.01 pA/ms (n = 10) and in ATP treated cells was 0.06 ± 0.01 pA/ms (n = 5). (B) Representative current traces elicited by 4 s voltage steps from -80 to +80 mV applied with 20 mV increments to control and ATP (500 µM) stimulated cells. (C) Representative current events recorded in response to repeated voltage steps from 0 to +60 mV in ATP stimulated T cells during 2 min recordings.
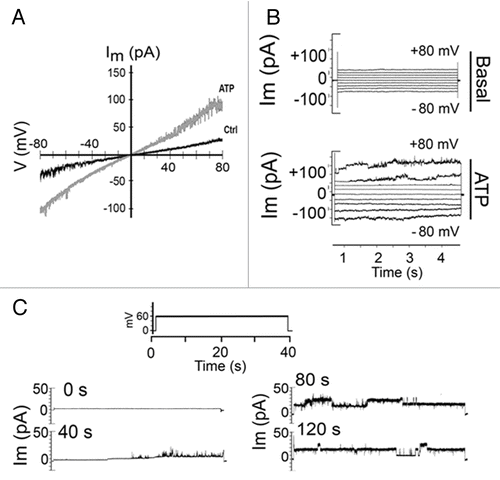
Figure 6. Panx1 single channel opening in response to extracellular ATP. (A) Unitary currents generated by voltage steps from 0 to +60 mV under (a) control conditions and (b) stimulation with 0.5 mM ATP. (c) Probenecid (1 mM), a Panx1 channel blocker, abolished these currents. The addition of 200 μM La3+, a blocker of TRP channels, P2X receptors and Cx HCs did not block the large unitary currents already promoted by ATP. (d) Probenecid (1 mM), a Panx1 channel blocker, abolished these currents. (d, box) Representative current trace elicited by a rectangular voltage step showing unitary transitions recorded in the presence of La3+. (B) Summary of similar experiments showing currents at +60 mV under control conditions (46.1 ± 2.8; n = 8) or after stimulation with ATP (151.4 ± 30.4 pA; n = 8) or treated with ATP in the presence of La3+ (66.13 ± 16 n = 3) or Probenecid (0.5 ± 0.1 pA, n = 3). Each bar represents the mean ± SEM from at least 4 different experiments.
Panx1 channels form the main ATP-activated cell membrane pore permeable to ethidium
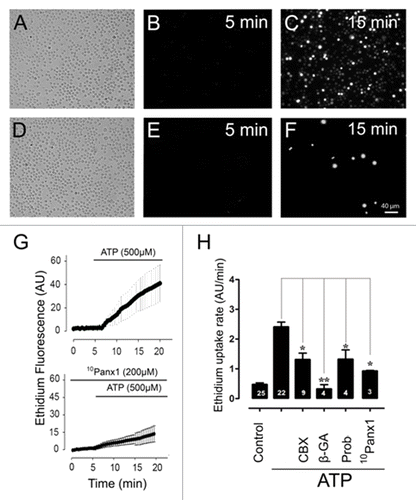
A controversial issue about Panx1 channels is whether they are part of the pore forming unit of P2X7Rs. Recently, P2X7Rs were found to activate different permeation pathways in different cells. At least in bone marrow-derived macrophages, Panx1 was found to be dispensable for uptake of ATP-induced YOPRO-1.Citation29 However, in macrophages derived from human lung alveolar cells and in the macrophage cell lines J774 the mimetic inhibitor peptide 10Panx1 largely eliminated the ATP-induced cell membrane permeability to ethidium (Etd).Citation14 Therefore, we then studied whether Panx1 channels were also involved in Etd uptake promoted by ATP. Changes in cell membrane permeability induced by ATP were measured by time-lapse recordings. Freshly isolated T cells seeded on poly-l-lysine coated coverslips were recorded in Hank’s-HEPES saline solution containing 5 µM Etd. In each recording, the basal slope (first 5 min) and the slope after the addition of 500 µM ATP were evaluated. Under resting conditions, T cells presented low Etd uptake (uptake rate = 0.4 ± 0.1 AU/min, n = 25) (, first 5 min). However, a rapid increase in Etd uptake was evident at ∼60 s after bath application of 500 µM ATP (uptake rate = 2.3 ± 0.2 AU/min, n = 20) ( from 5 min and on) in 90% of the cells (n = 6 experiments, from a total of 3,000 cells analyzed). In contrast, T cells pre-treated for 20 min with 10Panx1 (200 µM), a Panx1 channel blocker,Citation14 and then treated with 500 µM ATP showed very small increase in Etd uptake (). In all experiments, a small group (< 5%) of T cells showed a 10Panx1 resistant Etd uptake (). Likewise, T cells pre-incubated for 15 min with carbenoxolone (5 µM, CBX) at a concentration known to preferentially block Panx1 channels over Cx HCs,Citation33 or Probenecid (1 mM), a blocker of Panx1 channels,Citation36 or 200 µM 10Panx1 displayed a drastic reduction of the ATP-induced Etd uptake, though it was not completely abrogated (CBX: 1.3 ± 0.2 AU/min, n = 9; Probenecid: 1.32 ± 0.3 AU/min, n = 4; 10Panx1: 0.92 ± 0.2 AU/min, n = 3) (). Since T cells express Cxs,Citation37-Citation39 which form functional HCs in the membrane of diverse cell types,Citation37-Citation40 we studied their possible contribution in the ATP-induced Etd uptake. In T cells pre-treated for 20 min with β-GA (50 µM), which blocks both Panx1 channels and Cx HCs,Citation33 the ATP-induced Etd uptake was completely inhibited (uptake rate 0.3 ± 0.1 AU/min n = 4) (), suggesting that both Panx1 channels and Cx HCs mediate the ATP-induced Etd uptake.
Figure 7. Etd uptake is primarily mediated by Panx1 channels. Bright fields and fluorescence images showing a representative field of T cells (A, D) incubated with ethidium (Etd) for 5 min under control conditions (B, E) or after 15 min exposure to ATP (500 µM) (C) or exposure to ATP after preincubation with the mimetic peptide 10Panx1 (200 µM) for 15 min (F) (calibration bar: 40 μm). Representative time-lapse measurements showing Etd uptake of T cells exposed to ATP alone or preincubated with the mimetic peptide 10Panx1 for 15 min and then treated with ATP (G). Etd uptake rates of T cells exposed to ATP alone or after incubation with Panx1 and/or Cx channel blockers carbenoxolone (CBX, 5 µM), 18 β-GA (50 µM), probenecid (1 mM) and 10Panx1 (200 µM) (H). Each value represents the average ± SEM of several independent experiments including at least 50 cells, *P < 0.05, **P < 0.01. The number of experiments is indicated in each bar.
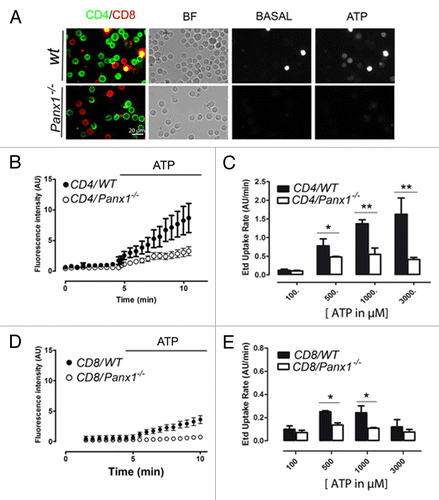
The pharmacological characterization of Panx1 channels was further confirmed using T cells derived from C57BL/6 mice with the Panx1 gene deleted (Panx1−/−) (Fig. S2). In these cells, the ATP-induced Etd uptake was significantly reduced in both CD4+ and CD8+ T-cell populations as compared with that of WT cells (). Notably, the small population of CD4+ lymphocytes that presented a high dye uptake and were insensitive to Panx channel blockers was still present in CD4+ T cells Panx1−/− mice (), suggesting that this T cell small population expresses a different Etd uptake pathway activated by extracellular ATP that was not further characterized in this work. In contrast CD8+ T cells derived from Panx1−/− mice presented a low to absent Etd uptake rate ().
Figure 8. The absence of Panx1 reduces the ATP-induced Etd uptake in T cells. (A) Representative microphotographs showing the CD4+ (green) and CD8+ (red) reactivity in T cells derived from popliteal lymph nodes (PLN) obtained from wild type (WT) or Panx1−/− mice before or after addition of 1mM ATP. The three bright cells present in WT cells untreated with ATP (basal) were dead (calibration bar: 20 μm). Etd uptake kinetics from PLN derived T cells in (B) CD4 or (D) CD8 positive cells obtained from wild type (●) or Panx1−/− (○) mice before and after the addition of extracellular ATP. Bars represent the comparison of dye uptake rates in T cells of WT (black) and Panx1−/− (white) mice induced by different concentrations of ATP (100–3,000 µM) in (C) CD4+ or (E) CD8+ T cells. Each bar corresponds to the mean ± SEM of 4 different mice, *P < 0.05, **P < 0.01.
Previously, it has been demonstrated that total CD4+ cells can be subdivided into three subpopulations with characteristic Etd fluorescence intensities induced by extracellular ATP,Citation41 suggesting that each subtype presents different levels of pore activity and/or different uptake pathways. In addition, it has been observed that regulatory T cells (CD4+CD25+) and memory T cells (CD4+CD44highCD45RBlow) have higher membrane permeability to Etd than conventional T cells do.Citation41,Citation42 Indeed, in Etd uptake studies performed by FACS analysis we found that conventional T cells treated with ATP exhibit 3 distinct populations with different Etd uptake, one with very low or null Etd uptake (called 1), a second one with medium Etd uptake values (called 2) and a third one with the highest Etd uptake (called 3) (Fig. S2). However, CD4+ T cells obtained from Panx1−/− mice exhibited a great reduction in subpopulation 3 and, while subpopulation 2 was absent (Fig. S2) suggesting that all cells of subpopulation 2 and almost two thirds of subpopulation 3 express Panx1. In addition, Etd uptake of CD8+ T cells obtained from Panx1−/− mice was completely absent (Fig. S2), suggesting that all CD8+ T cells express Panx1, which constitutes the only pathway linked to P2X7Rs. This is also the case of most CD4+ cells. However, one third of subpopulation 3 expresses an Etd uptake pathway independent of Panx1.
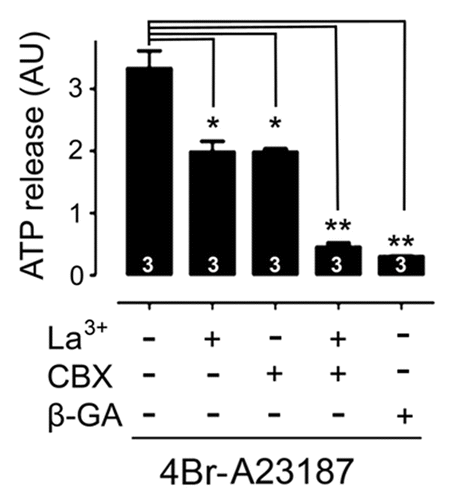
We evaluated whether Panx1 channels of T cells also serve as membrane pathways for ATP. The evaluation of ATP release via Panx1 channel activated through P2X7Rs is difficult to measure because the use of exogenous ATP to activate the purinergic receptors increases the signal-to-noise ratio and thus interferes with the detection of ATP released from the cells. In this way, since Panx1 channels open in response to an increase in intracellular free Ca2+ concentration ([Ca2+]i)Citation13 we tested whether T cells treated with a calcium ionophore 4Br-A23187 (2.5 µM) for 5 min show ATP release to the extracellular solution. We found that the calcium ionophore prominently increased the extracellular ATP levels (3.3 ± 0.2, n = 5 AU) (). Furthermore, the extracellular ATP concentration of T cells pre-incubated for 15 min with either La3+ (200 µM), a non-selective blocker of Cx HCs, P2X receptors and TRP channels, or CBX (5 µM), a blocker of Panx1 channels, was much lower (∼45% of reduction; La3+: 1.98 ± 0.16, n = 5 AU; CBX: 1.96 ± 0.04 AU) than the concentration found in the extracellular solution of control cells (). Moreover, preincubation with La3+ together with CBX caused a greater reduction (additive) in 4Br-A23187-induced ATP release (93% of reduction; 0.46 ± 0.06, n = 5 AU) (). In agreement with the involvement of both HC types, T cells preincubated with β-GA (50 µM), known to block both Cx HCs and Panx channels, showed almost complete inhibition (∼96% of reduction; 0.3 ± 0.03, n = 5 AU) in ATP release ().
Figure 9. ATP release induced by a calcium ionophore is mediated by connexin hemichannels and Panx1 channels. Average levels of extracellular ATP after treatment with 2.5 μM 4Br-A23187 alone or preincubated with 5 μM CBX, a Panx1 channel blocker, 200 μM La3+, a connexin hemichannel blocker or combination of the 2 blockers, or with 18 β-GA (50 μM), a Panx1 channel and Cx HC blocker. Each bar represents the mean ± SEM of at least 4 experiments. The mean of each group was compared with ATP alone using a one way ANOVA and a post-test of Dunns. *P < 0.05, **P < 0.01.
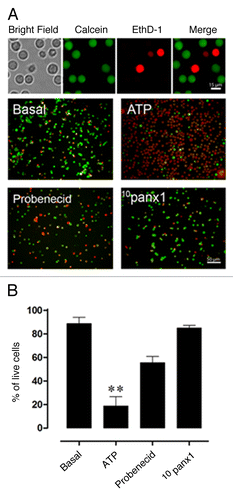
Panx1 channels mediate the ATP-induced T cell death
Panx1 channels have been shown to be Ca2+ permeable.Citation43 Linked to this is the relevance of a persistent increase in [Ca2+]i in the process of cell death, a well-recognized phenomenon for several decades.Citation44 Therefore, it was of particular interest to evaluate whether Panx1 channels are involved in the rapid ATP-induced T-cell death. To test this possibility, the viability of T cells was assessed using the LIVE/DEAD® assay Kit which measures simultaneously live and dead cells using two probes that serve as indication of intracellular esterase activity (calcein-AM) and cell membrane integrity (EthD-1), respectively. T cells were suspended in Hank’s-HEPES buffered saline solution and then preincubated for 15 min with Panx1 channel blockers Probenecid (1 mM) and 10Panx1 (200 µM) and finally treated with 1 mM ATP for 1 h. Treatment with ATP induced massive necrotic death in most T cells (> 90% of cells) not preincubated with HC blockers as revealed by the high proportion of red over green stained cells ().In contrast, preincubation with 10Panx1 or Probenecid reduced drastically the percentage of dead T cells (15 ± 8% n = 3 and 44 ± 5%, respectively; n = 5) ().
Figure 10. Blockade of Panx1 channels prevents ATP-induced T-cell death. (A) T cells suspended in Hank’s-buffered solution were stained with calcein-AM and Etd-homodimer-1. The calcein green-AM permeated live cells and was retained in the intracellular space after cleavage of the AM group by the intracellular esterases, whereas dead cells incorporated ethidium homodimer-1 and did not retain calcein green when the cell membrane was compromised (calibration bar: 15 μm). The pictures show T-cell cultures with cells left either untreated or treated with 1 mM ATP for 1 h alone or in the presence of Panx1 channel blockers Probenecid (1 mM) or 10Panx1 (200 µM) (calibration bar: 50 μm; n = 4). (B) Red and yellow cells were counted as dead cells, while cells negative for ethidium homodimer-1 but positive for calcein green were counted as alive. Each bar represents the mean ± SEM. For statistical analysis, each treatment was compared with the control, and significance was determined by using a 1-way ANOVA and a post-test of Dunn multiple comparison. **, P < 0.01.
Levels of P2X7Rs and ATP-induced intracellular rise in Ca2+ signal are enhanced in T cells lacking Panx1
To further confirm the previous results on cell death, we performed the same studies in T cells obtained from Panx1−/− mice. Cell death in spleen-derived T cells was evaluated 1 h after treatment with different ATP concentrations. CD4+ T cells derived from WT or Panx1−/− mice presented the same sensitivity to different concentrations of ATP (). Since these finding did not support the results obtained with the pharmacological approach, we decided to study a possible compensation for Panx1 absence. Since P2X7Rs was a good candidate, its levels were evaluated in total cell homogenates, resulting in an increase of about 50% as compared with control cells levels (). Relevant to cell death, the basal Ca2+ signal was significantly higher in Panx1−/− than in WT cells, and the ATP-induced rise in Ca2+ signal was also significantly higher in Panx1−/− than in WT cells ().
Figure 11. Conventional Panx1−/− CD4 positive T cells are not resistant to ATP-induced death and show enhanced rise in [Ca2+]i after stimulation with ATP. (A) Histograms showing the comparison of CD4 T cells from wild-type (black bars) and Panx1−/− (white bars) mice treated with different concentrations of ATP. Each value represents the average percentage of live cells ± SEM (B) P2X7R subunit level in total lymph node homogenates of wild-type and Panx1−/− mice. α-tubulin was used as a loading control (bottom). On the right, a graph shows densitometric analysis of P2X7R subunit detected in immunoblots (n = 4). Each bar represents mean + SEM. Differences were evaluated using a nonparametric t test *P < 0.05. (C) Comparison of calcium signals (340/360) promoted by ATP (500 μM) in Fura-2 loaded T cells of wild-type (WT) and Panx1 Panx1−/− mice.
![Figure 11. Conventional Panx1−/− CD4 positive T cells are not resistant to ATP-induced death and show enhanced rise in [Ca2+]i after stimulation with ATP. (A) Histograms showing the comparison of CD4 T cells from wild-type (black bars) and Panx1−/− (white bars) mice treated with different concentrations of ATP. Each value represents the average percentage of live cells ± SEM (B) P2X7R subunit level in total lymph node homogenates of wild-type and Panx1−/− mice. α-tubulin was used as a loading control (bottom). On the right, a graph shows densitometric analysis of P2X7R subunit detected in immunoblots (n = 4). Each bar represents mean + SEM. Differences were evaluated using a nonparametric t test *P < 0.05. (C) Comparison of calcium signals (340/360) promoted by ATP (500 μM) in Fura-2 loaded T cells of wild-type (WT) and Panx1 Panx1−/− mice.](/cms/asset/0d447dac-5500-4ada-a2b2-00d7a7254752/kchl_a_10928122_f0011.gif)
Discussion
In the present work, Panx1 and Panx2, but not Panx3, were found in the vast majority of primary murine helper and cytotoxic T cells. Thus, Panx3 does not seem to play a function in resting T cells. We also found Panx1 as the main membrane pore permeable to Etd in ATP-treated T cells. However, we also found that T cells can release ATP to the extracellular medium via Panx1 channels and Cx HCs. In addition, Panx1 channels were found to mediate the ATP-induced T-cell necrosis, and in the absence of Panx1 T cells overexpress P2X7Rs and show enhanced ATP-induced rise in [Ca2+]i, leading to a similar T-cell mortality to that of WT cells that express Panx1 channels.
Panxs 1 and 2 are glycoproteins.Citation45 Thus, the different immunoreactive bands detected by western blot analyses using anti-Panx1 and -Panx2 antibodies are likely to represent different glycosylation states of each protein.Citation46 This post-translational modification may be related to cell trafficking of hemichannels to the plasma membrane since it happens in other cell types.Citation46 Panx1 has been found in diverse cell types,Citation16,Citation47-Citation49 but Panx2 has been preferentially, if not exclusively, found in the brain.Citation46 Thus, to our knowledge this is the first demonstration that Panx2 is also present beyond the nervous system.
Although the formation of heteromeric Panx1/Panx2 channels has been demonstrated in Xenopus oocytes injected with the RNA of both proteins,Citation15 it has also been proposed that these channels are unstable over time.Citation41 We found low levels of Panx2, which suggests that most T cells express preferentially homomeric Panx1 channels. In support of this interpretation, we found that Probenecid, which inhibits Panx1 channel currents but not Panx2 channels,Citation41 completely blocked the single channel currents induced by ATP.
Several of our findings indicate that murine T cells express functional Panx1 channels. These findings are as follows: (1) Panx1 was located at the cell membrane by confocal immunofluorescence; (2) the reversal potential of macroscopic currents recorded under asymmetric ionic condition was 0 mV, a property of non-selective channels; (3) the macroscopic current was enhanced by extracellular ATP and the single channel currents were promoted by extracellular ATP, indicating a link with P2X7Rs; (4) the unitary currents were more frequent at positive voltages as observed by others;Citation14 (5) the unitary conductance of single channel events promoted by extracellular ATP was ∼400 pS which has been found in other cell types;Citation50,Citation51 (6) Probenecid blocked the ATP-induced channel opening and (7) La3+ did not block the high conductance channels.
Interestingly, Panx1 channels present different voltage-dependent properties.Citation18 In some cases, they show outwardly rectifying properties at voltages > -40 mV,Citation14,Citation19 while in other cases the current-voltage curve is clearly linear.Citation51-Citation53 In T cells, we found a linear voltage-current relationship under resting conditions or after ATP stimulation. However, the ATP-stimulated cells presented unitary events that resembled Panx1 channels recorded in other systems and an evident tendency to open at positive voltages. As discussed by other authors, these differences could account for several features, such as post-translation modifications, mechanisms of activation or attribution to specific isoforms. Multiple proteins have been observed to interact with Panx1 channels including the NMDA receptors, both P2Y and P2X receptors and the K+ channel subunit Kvβ3.Citation13,Citation51,Citation54,Citation55 In fact, the latter interacts physically with the Panx1 protein and apparently regulates the susceptibility of Panx1 channels to redox potential changes. Thus, it is possible that physical interactions between purinergic receptors and the Panx1 reduces the voltage sensitivity of Panx1 channels so they behave similar to ligand-activated channels.
In T cells, Panx1 channels are likely to coexist with Cx HCs as demonstrated in microglia,Citation23,Citation56 in which the ATP-induced Etd uptake was completely inhibited by β-GA, a known blocker of both Panx1 channels and Cx HCs.Citation35 Similarly, the ATP released by cells treated with calcium ionophore was partially inhibited by 5 μM CBX or 200 μM La3+, blockers of Panx1 channels and Cx HCs, respectively.Citation35 However, the simultaneous application of CBX and La3+ caused complete inhibition, a result in agreement with the notion that both channel types are involved in the calcium ionophore-induced ATP release. Accordingly, total inhibition of ATP release was reduced by β-GA, known to inhibit both channel types.Citation42 Therefore, we believe that Panx1 channels and Cx HCs are involved in ATP or calcium ionophore-induced membrane permeabilization response in most T cells. In support of this interpretation, we were able to confirm that T cells express Panx1 channels.Citation7,Citation24 Additionally, it has been reported that T cells also express Cxs 40 and 43.Citation57 However, we did not detect discrete current events characteristic of Cx HCs in most recordings; only 1 out of 30 records at +60 mV showed opening of channels with unitary conductance of ∼220 pS that might correspond to Cx43 HCs (not shown). A possible explanation for this is that Cx HCs were not at the cell membrane of resting T cells but were translocated to the cell membrane upon calcium ionophore treatment. Further studies will be required to clarify this issue.
How could ATP affect the activity of Cx HCs? It is known that higher levels of intracellular free Ca2+ concentration increase the number of Cxs 32 and 43 at the cell surface.Citation58,Citation59 Therefore, if ATP activates P2X7Rs and Panx1 channels, 2 cell membrane channels permeable to Ca2+,Citation43,Citation60 [Ca2+]i could increase mainly due to Ca2+ influx which in turn could increase the levels of surface Cx HCs. In addition, elevated [Ca2+]i has been demonstrated to reduce Cx43 HC activity,Citation61 which might explain why we did not detect the unitary events of ∼220 pS described for Cx43 HCs.Citation52
ATP is the most widely distributed high-energy compound within the human body, driving virtually all cell functions. Depending on the species, tissues or cell differentiation, intracellular ATP content can fluctuate between 3–10 mM.Citation62 In contrast, under resting conditions extracellular ATP concentration is approximately 10 nM.Citation63 However, any event that leads to the opening or even transient break in the plasma membrane can cause release of ATP at a very favorable chemical concentration gradient leading to values close to several hundreds of micromolar. The extracellular ATP concentration has been reported to dramatically increase with a number of physical or chemical stimuli.Citation64 The precise mechanism of ATP release is still controversial in many non-neuronal cells. Alternative transport mechanisms including ATP-binding cassette (ABC) transporters, Cx HCs and Panx channels,Citation63 a volume regulated channel (VRAC),Citation65 maxi-anion channel,Citation66 the purinergic receptor, P2X7,Citation67 vesicular-dependent mechanismsCitation68 and CALHM channelsCitation69 have been postulated. Here, we demonstrated that most murine T cells release ATP via Panx1 channels, and a small population of CD4+ cells present an ATP-activated pathway for Etd uptake independent of Panx1. Since the vesicular ATP releasing pathway might allow endocytosis of extracellular Etd, it could be the same membrane mechanism that permits ATP release and Etd uptake.
The role of P2X7Rs in the survival of T lymphocytes has been discussed for many years. Activation of P2X7Rs is implicated in both cell proliferation and apoptosis depending on the level of activation, which in turn depends on the ATP concentration.Citation10 P2X7Rs have been suggested to participate in many different types of leukemia including those of B- and T-cell types.Citation70,Citation71 Notably, much of this work was done by correlating the expression of P2X7Rs with cellular uptake of Etd. However, many controversies have appeared from studies on this topic. For instance, in many patients suffering from B-chronic lymphocytic leukemia the membrane of numerous cells does not become permeable to Etd in response to ATP despite a strong P2X7R immunoreactivity on the lymphocyte surface.Citation2 It has been proposed that P2X7Rs. Presents different polymorphisms . However, lack of correlation in the incidence, survival and abnormalities in the P2X7Rs genome obscured the sole role of this protein as a possible candidate involved in the onset of leukemia.Citation72,Citation73 Our group was also particularly interested in the role of Panx1 in T-cell death since it had been reported that co-expression of both Panx1 channels and P2X7 receptors on Xenopus oocytes sensitizes these cells to the deleterious effects of ATP.Citation13 In primary T cells, the deleterious effect of ATP is well documented,Citation74,Citation75 and in the present work we demonstrated that blockade of Panx1 channels with 10Panx1, a specific blocker of Panx1 channels,Citation14 largely prevented cell death induced by ATP. Although this finding was not corroborated in T cells derived from the Panx1−/− mice, we believe that the enhanced expression of P2X7Rs in cells of Panx1−/− mice could overcome the lack of Panx1 channels during the process of cell death. In line with this idea, we found that Ca2+ entry in response to ATP was enhanced in these cells despite the fact that dye uptake was reduced. In addition, it is known that in T cells long ATP expositions initiate a severe disruption in the inorganic ion homeostasis. In murine T cells, it has been reported that extracellular Cl- and MEK1/2 activation are necessary in the mechanism of ATP-induced cell death.Citation76 Although we did not measure directly Cl- influx in response to ATP, it was recently reported that Panx1 is also permeable to Cl- and other anions.Citation19 Thus Panx1 might be relevant both for Ca2+ and Cl- influx, although it was also suggested that multiple redundant cell death pathways might be activated in order to ensure initiation of the cell death mechanism. It is now known that the whole body relies on many cell death programs to regulate T-cell elimination,Citation77 thus it is not surprising that the body promotes alternative mechanism to control cell death in order to maintain an efficient cell response.
Materials and Methods
Chemicals
RPMI 1640 culture medium, penicillin, streptomycin, fetal bovine serum (FBS) and L-glutamine were obtained from Gibco®Invitrogen. Adenine triphosphate disodium (Na2ATP), Probenecid, carbenoxolone (CBX), ethidium (Etd) bromide, 4bromo-A23187 (4Br-A23187) and adenosine-5-triphosphate (ATP) bioluminescent assay kit (FLAA-1KT) were obtained fromSigma Chemical. The Halt protease and phosphatase inhibitor cocktail (Cat Nº 1860932) and mammalian protein extraction reagent (M-PER; Cat Nº 78501) were acquired from Thermo Scientific. LIVE/DEAD® viability/cytotoxicity assay kit was acquired from Molecular Probes.
Antibodies
F(ab´)2 fragments of a previously characterized polyclonal rabbit anti-Panx1 serum were used.Citation48 The F(ab´)2 fragments of affinity IgGs purified from the anti-Panx1 serum were prepared as previously described.Citation78 Chicken anti-Panx1 antibody was acquired from (Diatheva, ANT0039). Another purified anti-Panx1 serum was kindly donated by Dr Dale Laird (Department of Anatomy and Cell Biology). Rabbit anti-Panx2 (Mid) polyclonal antibodies (422900), rabbit anti-Panx3 polyclonal antibody (433270) and goat anti-mouse IgG were purchased from Invitrogen. Secondary antibodies were Alexa 488 conjugated to rat anti-mouse CD4 antibody, allophycocyanin (APC) conjugated to rat anti-mouse CD8 antibody and TRITC conjugated goat anti F(ab´)2 rabbit, all which were obtained from Sigma. Cy2 conjugated donkey anti-chicken and Cy3 conjugated goat anti-F(ab´)2 rabbit antibodies were acquired from Jackson Immunoresearch Laboratories Inc. Rat anti-mouse CD16/CD32 (Fc-Block) antibodies were obtained from BD Pharmigen. For flow cytometric analyses, we used directly conjugated antibodies anti-CD45R/B220 (RA3-6B2); anti-T cell lineage mAb anti-CD3, anti-CD4 and anti-CD8 and anti-monocyte/macrophage mAb anti-CD11b/Mac-1 (M1/70), activation antibodies anti-CD25, all obtained from e-Biosciences or BioLegend.
Cells and cell isolation
Lymph nodes from BALB/c and C57/Bl6 male mice (2–3 mo old) obtained from the Animal Institute at Pontificia Universidad Católica de Chile (PUCC) were dissected under sterile conditions according to the protocols approved by the Bioethics Committee of the Pontificia Universidad Católica de Chile. Lymph nodes were mechanically disrupted on a nylon sieve (100 μm mesh), and the resulting cell suspension was washed once in RPMic medium [RPMI 1640 supplemented with 10% heat-inactivated fetal bovine serum (FBS), 2 mM L-glutamine, 100 μg/ml penicillin and 100 μg/ml streptomycin, pH 7.4]. Contaminating red blood cells were lysed using a solution containing 155 mM NH4Cl, 2.7 mM KHCO3 and 3.7 mM EDTA for 10 min at room temperature. White cells were then washed 3 times in Hank’s saline solution by centrifugation at 2,000 rpm for 5 min. Next, cells were resuspended in 5 ml RPMic medium, plated on plastic tissue culture dishes (100 mm in diameter, Nunc) and incubated for 3 h at 37 °C in a 95% O2/5% CO2 atmosphere. Then, non-adherent cells, corresponding mainly to T and B cells, were gently harvested using a sterile Pasteur pipette sylinized, washed once in Hank’s saline solution using centrifugation for 5 min at 1,000 rpm in a bench centrifuge and incubated for 1 h at 4 °C on a 100 mm diameter tissue culture dish coated with mouse anti-IgG antibody in RPMic medium. Finally, non-adherent cells were carefully collected and analyzed. For PCR and electrophysiological experiments, naïve CD4 T cells were obtained from lymph nodes of BALB/c male mice (2–3 mo old) by magnetic-activated cell separation (MACS) using negative selection CD4+ T-cell isolation kit (130-090-860) obtained from Miltenyi Biotec, yielding more than 95% of CD4 positive cells.
C2C12 cells, a cell line derived from myoblasts,Citation79 were cultured in growth medium (GM) containing DMEM/F12 supplemented with 10% FBS, 100 U/ml penicillin and 100 μg/ml streptomycin at pH 7.4, seeded on tissue culture dishes of 100-mm diameter (CORNING) and kept at 37 °C in a 5% CO2/95% air atmosphere at nearly 100% relative humidity. Cell cultures were fed every 48 h with GM before each experiment.
Immunofluorescence
Lymphocytes cultured on glass coverslips were fixed in 4% formaldehyde at room temperature for 30 min. PBS solution containing 1% BSA IgG free, 50 mM NH4Cl and 0.05% Triton X-100 (blocking solution), was used to permeabilize the cells and block unspecific reactive sites. In order to block Fc receptors, samples were incubated for 45 min in a solution containing Fc-Block (1:100) at room temperature. Then, samples were washed twice in PBS and incubated with anti-Panx1 F(ab´)2 fragments for 12 h in blocking solution at 4 °C. Finally, samples were washed three times with blocking solution, incubated with TRITC or Cy2 conjugated goat anti-rabbit IgG F(ab´)2 fragments for 30 min at room temperature and mounted with fluoromount G (Electron Microscopy Sciences). Images were examined with a confocal laser-scanning microscope (Olympus, Fluoview FV1000).
Reverse transcriptase-polymerase chain reaction
Total RNA was isolated using the Chomczynski’s method. cDNA was generated using reverse transcriptase (Superscript II, Invitrogen). Panx primer sequences were obtained from data published by Wang and colleagues.Citation80 The primers used were Panx1 sense 5-ATC TAT TCT TCT ATG ACG CTG-3 and Panx1 antisense 5-CAA GGG AGA GGA CCA GGG C-3; Panx2 sense 5-GAG AAA AAG CAT ACC CGC CAC-3 and Panx2 antisense 5-GGG TGA GCA GAC ATG GAA TGA-3 and Panx3 sense 5-CCT CAC AAG GCT CTT CCC TA-3 and Panx3 antisense 5-AGG TCA GCC TGC ATG TGA TC-3. All primers were purchased from BiosChile. Semi-quantitative polymerase chain reactions (PCR) were performed on cDNA generated from freshly isolated T cells and C2C12 cells used as positive control. The following conditions were used for the reaction: 95 °C for 30 s, 60 °C for 45 s and 72 °C for 60 s, for 40 cycles. The amplified products were electrophoresed in 1.7% agarose gels and stained with Etd for visualization under UV illumination.
Western blot
Frozen tissue samples were pulverized using dry ice and a chilled mortar (-60 °C). Samples were then suspended in a solution containing a mixture of M-PER and Halt protease cocktail inhibitor according to the manufacturer (Thermo Scientific). Tissue samples were disrupted using an ultrasonic cell disrupter (Microson ultrasonic cell disrupter; Heat Systems). Protein content was determined using the Bradford method obtained from Bio-Rad. Total protein amounts of 100 µg (for cells) or 50 µg (for whole tissue) samples were resuspended in Laemmli sample buffer and stored at -80 °C. Aliquots of total tissue and T-cell homogenates were resolved in 10% SDS-PAGE and then transferred to nitrocellulose sheets. Nonspecific protein binding was blocked by 3 h incubation of nitrocellulose sheets in PBS-BLOTTO [5% nonfat milk in phosphate buffered solution (PBS)]. Overnight incubation of blots at 4 °C with rabbit anti-Panx1, anti-Panx2 or anti-Panx3 antibodies was followed by 4 washes in PBS of 15 min each. Blots were incubated for 1 h at room temperature with secondary anti-rabbit IgGs conjugated to HRP. Antigen-antibody complexes were detected using the SuperSignal kit according to manufacturer instructions (Pierce). Resulting immunoblot signals were scanned, and densitometry analyses were performed using Image J software.
Flow cytometry
Flow cytometrical analysis was performed by standard staining procedures. Briefly, acute cultures of T cells obtained from spleen or peripheral lymph nodes were prepared. All suspensions and staining procedures were performed in staining medium [1x Hank balanced salt solution (HBSS); 10 mM HEPES, pH: 7.2 and 2% new born calf serum]. Erythrocytes were lysed by hypotonic shock with 1 ml of red blood cell lysis buffer (Sigma) for 5 min at room temperature, washed with staining medium and spun down. Later, cells were counted in a hemocytometer by Trypan blue exclusion. To minimize nonspecific binding, cell suspensions were pretreated with purified mouse IgG (Sigma) and then stained with a mix of antibodies containing anti-mouse CD11b coupled to Pacific Blue, anti-mouse CD8 coupled to APC and anti-mouse CD4 coupled to PE. Incubation on ice proceeded for 45 min followed by washing in staining medium. Next, cells were fixed with 1% paraformaldehyde (PFA) for 10 min on ice and then washed with PBS. A concentration of 0.05% of Saponin in PBS was used to permeabilize cells. Cells were then stained with chicken anti-mouse-Panx1, rabbit anti-mouse Panx2 or isotype control antibodies and chicken IgGs or rabbit IgGs and incubated overnight in PBS/saponin solution. Finally, cells were washed and stained with anti-B220 PE-Cy7 and secondary antibodies Alexa 488 anti-chicken IgGs for Panx1 and Alexa 488 anti-rabbit IgGs for Panx2. Both antibodies were optimized in terms of their concentration and titration (Fig. S1). All staining procedures were done on ice to prevent quenching of signals. Data were acquired on an LSRII (Becton Dickinson) and analyzed using FlowJo software (Tree Star Inc.).
Electrophysiology
Naive purified CD4+ T cells seeded on poly-l-lysine coated coverslips were transferred to a chamber containing 1 ml bath solution. Cells were visualized with an inverted microscope (Olympus, Fluoview IX-70) using a 40 × objective. For whole cell experiments, the bath solution contained (in mM) 140 NaCl, 5.4 CsCl, 1 MgCl2, 1.8 CaCl2, 2 BaCl2, and 10 HEPES, pH 7.4. The pipette solution contained (in mM) 130 CsCl, 10 AspNa, 0.26 CaCl2, 1 MgCl2, 2 EGTA, 7 TEA-Cl, and 5 HEPES, pH 7.2. All recordings were performed at room temperature (21–23 °C). Patch electrodes were made from borosilicate glass capillaries (inner diameter, 0.86 mm; outer diameter, 1.5 mm; A-M Sytems INC) using a Flaming/Brown micropipette puller (P-97, Sutter Instruments), while tips were later polished using a custom made microforge. Electrode tip resistances were 20–25 MΩ. Single HC current events were studied with voltage clamp under whole cell patch clamp configuration using Axopatch-1D amplifier (Axon Instruments). Whole cell currents were filtered at 1 kHz and sampled at 5 kHz. Recordings were filtered with a digital low pass filter of 0.5 kHz. Only patches with seal resistance between 1 and 10 GΩ were recorded. Data acquisition and analysis were performed using pClamp9 (Axon Instruments). Unitary current events at a given holding potential and point-by-point conversion of the current values to conductance were calculated using frequency histograms analyzed with Clampfit. All recordings were performed in isolated cells in order to preclude current dissipation to adjacent cells via gap junctions.
Transgenic mice
Panx1−/− mice were kindly donated by Dr Hanna Monyer (University of Heilderberg). Disruption of Panx1−/− gene was described by Alselmi and collaborators (supporting information).Citation81 Further characterization of these Panx1−/− animals was described by Bargiotas and colleagues.Citation82 All protocols were approved by the Institutional Bioethics Committee of the Pontificia Universidad Católica de Chile. To minimize the number of animals sacrificed, the use of Panx1−/− mice was limited to crucial experiments.
Evidence for complete Panx1 deletion was obtained by RT-PCR analysis from tail DNA obtained from 2-month-old C57Bl/6 and C57Bl/6-Panx1−/− mice. Protein deletion was confirmed by western blot analyses of samples obtained from total lymph nodes (Fig. S3). Mice were genotyped with PCR primers (wtgin3 GGAAAGTCAACAGAGGTACCC, wtex15 CTTGGCCACGGAGTATGTGTT and lacseq12 GTCCCTCTCACCACTTTTCTTACC) that yield a 330-bp for wild type (WT) (Fig. S3A, line 1) and 660-bp for C57B6/Panx1−/− (Fig. S3A, lines 2–8). A representative immunoblot showed the total protein levels of Panx1 in mouse peripheral lymph nodes from WT (Fig. S3B, line 1) and Panx1−/− mice (Fig. S3B, lines 2 and 3) (100 µg of total protein/lane). Immunoreactive bands observed in WT samples correspond likely to the unglycosylated (43 kDa) and glycosylated states (60 kDa) of Panx1 described in the literature.Citation31 Finally, immune blot showing α-tubulin was used as protein loading controls (Fig. S3B).
Time-lapse fluorescence imaging
For time-lapse experiments, freshly isolated T cells were seeded on No 1 glass poly-l-lysine (0.01%) coated coverslips for 1 h and then washed twice with recording solution (HANKS-HEPES solution, in mM: 140 NaCl, 5.4 KCl, 1.8 CaCl2, 1 MgCl2, 5 D-glucose and 10 HEPES at pH 7.4). Cells were then incubated in recording solution containing 5 µM Etd. Fluorescence was recorded in regions of interest of different cells with a water immersion upright microscope (Olympus BX51WI). Images were captured with a Q Imaging model Retiga 13001 fast cooled monochromatic digital camera (12-bit; QImaging) every 30 s (exposure time = 30 ms, gain = 0.5). Metafluor software (version 6.2R5; Universal Imaging) was used for image analysis and fluorescence quantification.
Data and calculated Etd uptake rates are presented as described previously.Citation35 Briefly, 3 independent background fluorescence intensity measurements at each time (BF, expressed as arbitrary units or AU) were averaged and subtracted from fluorescence intensity of each cell at each time interval (CF). Results of this calculation (CF-BF) at each time interval for each of the 40 cells were averaged and plotted against time (expressed in minutes) during a of 20 min period. For all experiments, Etd uptake rate was calculated from the onset of the agonist application, expressed in AU/min and calculated using Microsoft Excel software. Cells that presented saturating fluorescence intensities before stimulation were excluded from the analysis.
Intracellular Ca2+ signal
The response of intracellular free Ca2+ concentration, here called Ca2+ signal, was evaluated with Fura 2 as described previously.Citation58,Citation59 In brief, T cells were loaded with 5 µM Fura-2-AM in DMEM without serum for 45 min at 37 °C. Cells were then washed 3 times in Hanks-HEPES solution. Ratiometric [Ca2+]i imaging was performed every 10 s at 340- and 380-nm excitation wavelengths using a water immersion upright microscope (Olympus BX51WI) with a 40 × water immersion objective. Changes were monitored using an imaging system equipped with a Retiga 1300I fast cooled monochromatic digital camera (12-bit; QImaging), a monochromator for fluorophore excitation and METAFLUOR software (Universal Imaging) for image acquisition and analysis. Offline analysis involved determining the number of pixels allocated to each cell. The average pixel value of each cell was obtained with excitation at each wavelength and corrected for background interference. Because of the low excitation intensity, no bleaching was observed even when cells were illuminated for a few minutes. The ratio was obtained after dividing the 340-nm by the 380-nm fluorescence image on a pixel-by-pixel base (R = 5 F340nm/ F380nm).
Extracellular ATP measurements
Cellular ATP release was determined with a luciferin/luciferase assay kit (Sigma) in aliquots of extracellular medium. The procedure involved adding 75 µl ATP assay mix prepared in HANK’S-HEPES to 150 µl medium. Photon flux was counted using a fluorescence spectrophotometer (Perkin Elmer LS50B). ATP release was triggered by applying a calcium ionophore (2.5 μM, 4Br-A23187) 5 min before measuring. All assays were performed in equal volumes containing 5x10⁵ cells/ml. In all pharmacological treatments, cells were pre-incubated for 10 min at room temperature in HANK’S-HEPES solution containing Panx HC inhibitors before the addition of the calcium ionophore.
Cell viability test
T cells cultured on glass coverslips were used. Dead cells were recognized using the LIVE/DEAD® viability/cytotoxicity assay kit according to the manufacturer’s instructions. Briefly, cells (5x10⁵ cells/ml) were incubated at room temperature with 1 mM ATP for 1 h in recording solution. Then, each sample was resuspended in recording solution containing 1 µM calcein-AM and 10 µM Etd homodimer-1 dyes for 30 min at room temperature. Samples were washed twice with PBS before being mounted on glass slides. Labeled cells were viewed with a fluorescence microscope (BX51WI, Olympus). The fluorescence emissions were acquired separately: calcein at 530 nm and EthD-1 at 645 nm. Cells were analyzed using ImageJ cell counter (NIMH). As an alternative approach, cell death was evaluated in spleen cells by incubating them with or without ATP (Sigma-Aldrich) at various times and concentrations. Annexin V was used to evaluate phosphatidyl serine exposure and Sytox blue. PI was used to assess membrane integrity. FACS analysis was performed on an LSR II flow cytometer (Becton Dickinson)
Data analysis and statistics
For each data group, results are expressed as mean ± SE and “n” refers to the number of independent experiments. For statistical analysis, each treatment was compared with its respective control, and significance was determined using a 1-way ANOVA followed by a Dunn post hoc test. Differences were considered significant at P < 0.05. Statistics were performed using Microsoft Excel and Graph Pad Prism 4 software (2007 and 2003 versions, respectively).
| Abbreviations: | ||
| ATP | = | adenosine-5′-triphosphate |
| CBX | = | carbenoxolone |
| Cx | = | connexin with the molecular mass in kDa as specified |
| HCs | = | hemichannels |
| I-V | = | current-voltage |
| La3+ | = | lanthanum ion |
| P2X7R | = | P2X7 receptors |
| Panx | = | pannexin with the gene number as specified |
| TRP | = | transient receptor potential channel |
| UTP | = | uridine-5′-triphosphate |
| VRAC | = | volume-regulated channel |
| β-GA | = | 18β-glycyrrhetinic acid |
Additional material
Download Zip (4.4 MB)Disclosure of Potential Conflicts of Interest
No potential conflicts of interest were disclosed.
Acknowledgments
The data of this work was presented by K.F.S. as partial fulfillment of the requirements to obtain the PhD degree in Physiological Sciences at the Pontificia Universidad Católica de Chile. This work was partially supported by Fondo Nacional de Desarrollo Científico y Tecnológico Grants 1111033 (to J.C.S.), Instituto Milenio, Centro Interdisciplinario de Neurociencias de Valparaíso (to J.C.S.), FONDEF D07I1086 (to J.C.S.) and NIH/RC1HL100569–01 (to H.L.A). K.F.S. received a “Comisión Nacional de Investigación Científica y Tecnológica” and PUC fellowship for graduate studies.
References
- Trautmann A. Extracellular ATP in the immune system: more than just a “danger signal”. Sci Signal 2009; 2:pe6; http://dx.doi.org/10.1126/scisignal.256pe6; PMID: 19193605
- Gu B, Bendall LJ, Wiley JS. Adenosine triphosphate-induced shedding of CD23 and L-selectin (CD62L) from lymphocytes is mediated by the same receptor but different metalloproteases. Blood 1998; 92:946 - 51; PMID: 9680363
- Moon H, Na HY, Chong KH, Kim TJ. P2X7 receptor-dependent ATP-induced shedding of CD27 in mouse lymphocytes. Immunol Lett 2006; 102:98 - 105; http://dx.doi.org/10.1016/j.imlet.2005.08.004; PMID: 16207496
- Langston HP, Ke Y, Gewirtz AT, Dombrowski KE, Kapp JA. Secretion of IL-2 and IFN-gamma, but not IL-4, by antigen-specific T cells requires extracellular ATP. J Immunol 2003; 170:2962 - 70; PMID: 12626548
- Baricordi OR, Melchiorri L, Adinolfi E, Falzoni S, Chiozzi P, Buell G, Di Virgilio F. Increased proliferation rate of lymphoid cells transfected with the P2X(7) ATP receptor. J Biol Chem 1999; 274:33206 - 8; http://dx.doi.org/10.1074/jbc.274.47.33206; PMID: 10559192
- Chen L, Brosnan CF. Exacerbation of experimental autoimmune encephalomyelitis in P2X7R-/- mice: evidence for loss of apoptotic activity in lymphocytes. J Immunol 2006; 176:3115 - 26; PMID: 16493071
- Woehrle T, Yip L, Elkhal A, Sumi Y, Chen Y, Yao Y, Insel PA, Junger WG. Pannexin-1 hemichannel-mediated ATP release together with P2X1 and P2X4 receptors regulate T-cell activation at the immune synapse. Blood 2010; 116:3475 - 84; http://dx.doi.org/10.1182/blood-2010-04-277707; PMID: 20660288
- Di Virgilio F, Chiozzi P, Ferrari D, Falzoni S, Sanz JM, Morelli A, Torboli M, Bolognesi G, Baricordi OR. Nucleotide receptors: an emerging family of regulatory molecules in blood cells. Blood 2001; 97:587 - 600; http://dx.doi.org/10.1182/blood.V97.3.587; PMID: 11157473
- Kim M, Jiang LH, Wilson HL, North RA, Surprenant A. Proteomic and functional evidence for a P2X7 receptor signalling complex. EMBO J 2001; 20:6347 - 58; http://dx.doi.org/10.1093/emboj/20.22.6347; PMID: 11707406
- Adinolfi E, Pizzirani C, Idzko M, Panther E, Norgauer J, Di Virgilio F, Ferrari D. P2X(7) receptor: Death or life?. Purinergic Signal 2005; 1:219 - 27; http://dx.doi.org/10.1007/s11302-005-6322-x; PMID: 18404507
- Aswad F, Dennert G. P2X7 receptor expression levels determine lethal effects of a purine based danger signal in T lymphocytes. Cell Immunol 2006; 243:58 - 65; http://dx.doi.org/10.1016/j.cellimm.2006.12.003; PMID: 17286969
- Kawamura H, Aswad F, Minagawa M, Malone K, Kaslow H, Koch-Nolte F, Schott WH, Leiter EH, Dennert G. P2X7 receptor-dependent and -independent T cell death is induced by nicotinamide adenine dinucleotide. J Immunol 2005; 174:1971 - 9; PMID: 15699125
- Locovei S, Scemes E, Qiu F, Spray DC, Dahl G. Pannexin1 is part of the pore forming unit of the P2X(7) receptor death complex. FEBS Lett 2007; 581:483 - 8; http://dx.doi.org/10.1016/j.febslet.2006.12.056; PMID: 17240370
- Pelegrin P, Surprenant A. Pannexin-1 mediates large pore formation and interleukin-1beta release by the ATP-gated P2X7 receptor. EMBO J 2006; 25:5071 - 82; http://dx.doi.org/10.1038/sj.emboj.7601378; PMID: 17036048
- Bruzzone R, Hormuzdi SG, Barbe MT, Herb A, Monyer H. Pannexins, a family of gap junction proteins expressed in brain. Proc Natl Acad Sci U S A 2003; 100:13644 - 9; http://dx.doi.org/10.1073/pnas.2233464100; PMID: 14597722
- Locovei S, Bao L, Dahl G. Pannexin 1 in erythrocytes: function without a gap. Proc Natl Acad Sci U S A 2006; 103:7655 - 9; http://dx.doi.org/10.1073/pnas.0601037103; PMID: 16682648
- Junger WG. Immune cell regulation by autocrine purinergic signalling. Nat Rev Immunol 2011; 11:201 - 12; http://dx.doi.org/10.1038/nri2938; PMID: 21331080
- MacVicar BA, Thompson RJ. Non-junction functions of pannexin-1 channels. Trends Neurosci 2010; 33:93 - 102; http://dx.doi.org/10.1016/j.tins.2009.11.007; PMID: 20022389
- Ma W, Hui H, Pelegrin P, Surprenant A. Pharmacological characterization of pannexin-1 currents expressed in mammalian cells. J Pharmacol Exp Ther 2009; 328:409 - 18; http://dx.doi.org/10.1124/jpet.108.146365; PMID: 19023039
- Qiu F, Dahl G. A permeant regulating its permeation pore: inhibition of pannexin 1 channels by ATP. Am J Physiol Cell Physiol 2009; 296:C250 - 5; http://dx.doi.org/10.1152/ajpcell.00433.2008; PMID: 18945939
- Chekeni FB, Elliott MR, Sandilos JK, Walk SF, Kinchen JM, Lazarowski ER, Armstrong AJ, Penuela S, Laird DW, Salvesen GS, et al. Pannexin 1 channels mediate ‘find-me’ signal release and membrane permeability during apoptosis. Nature 2010; 467:863 - 7; http://dx.doi.org/10.1038/nature09413; PMID: 20944749
- Lemaire I, Falzoni S, Zhang B, Pellegatti P, Di Virgilio F. The P2X7 receptor and Pannexin-1 are both required for the promotion of multinucleated macrophages by the inflammatory cytokine GM-CSF. J Immunol 2011; 187:3878 - 87; http://dx.doi.org/10.4049/jimmunol.1002780; PMID: 21865551
- Sáez PJ, Shoji KF, Retamal MA, Harcha PA, Ramírez G, Jiang JX, von Bernhardi R, Sáez JC. ATP is required and advances cytokine-induced gap junction formation in microglia in vitro. Mediators Inflamm 2013; 2013:216402; http://dx.doi.org/10.1155/2013/216402; PMID: 23737642
- Schenk U, Westendorf AM, Radaelli E, Casati A, Ferro M, Fumagalli M, Verderio C, Buer J, Scanziani E, Grassi F. Purinergic control of T cell activation by ATP released through pannexin-1 hemichannels. Sci Signal 2008; 1:ra6; http://dx.doi.org/10.1126/scisignal.1160583; PMID: 18827222
- Brough D, Pelegrin P, Rothwell NJ. Pannexin-1-dependent caspase-1 activation and secretion of IL-1beta is regulated by zinc. Eur J Immunol 2009; 39:352 - 8; http://dx.doi.org/10.1002/eji.200838843; PMID: 19130485
- Kanneganti TD, Lamkanfi M, Kim YG, Chen G, Park JH, Franchi L, Vandenabeele P, Núñez G. Pannexin-1-mediated recognition of bacterial molecules activates the cryopyrin inflammasome independent of Toll-like receptor signaling. Immunity 2007; 26:433 - 43; http://dx.doi.org/10.1016/j.immuni.2007.03.008; PMID: 17433728
- Marina-García N, Franchi L, Kim YG, Miller D, McDonald C, Boons GJ, Núñez G. Pannexin-1-mediated intracellular delivery of muramyl dipeptide induces caspase-1 activation via cryopyrin/NLRP3 independently of Nod2. J Immunol 2008; 180:4050 - 7; PMID: 18322214
- Pelegrin P, Surprenant A. Pannexin-1 couples to maitotoxin- and nigericin-induced interleukin-1beta release through a dye uptake-independent pathway. J Biol Chem 2007; 282:2386 - 94; http://dx.doi.org/10.1074/jbc.M610351200; PMID: 17121814
- Qu Y, Misaghi S, Newton K, Gilmour LL, Louie S, Cupp JE, Dubyak GR, Hackos D, Dixit VM. Pannexin-1 is required for ATP release during apoptosis but not for inflammasome activation. J Immunol 2011; 186:6553 - 61; http://dx.doi.org/10.4049/jimmunol.1100478; PMID: 21508259
- Riquelme MA, Cea LA, Vega JL, Boric MP, Monyer H, Bennett MV, Frank M, Willecke K, Sáez JC. The ATP required for potentiation of skeletal muscle contraction is released via pannexin hemichannels. Neuropharmacology 2013; 75:594 - 603; http://dx.doi.org/10.1016/j.neuropharm.2013.03.022; PMID: 23583931
- Peñuela S, Bhalla R, Nag K, Laird DW. Glycosylation regulates pannexin intermixing and cellular localization. Mol Biol Cell 2009; 20:4313 - 23; http://dx.doi.org/10.1091/mbc.E09-01-0067; PMID: 19692571
- Li S, Tomić M, Stojilkovic SS. Characterization of novel Pannexin 1 isoforms from rat pituitary cells and their association with ATP-gated P2X channels. Gen Comp Endocrinol 2011; 174:202 - 10; http://dx.doi.org/10.1016/j.ygcen.2011.08.019; PMID: 21907716
- Ambrosi C, Gassmann O, Pranskevich JN, Boassa D, Smock A, Wang J, Dahl G, Steinem C, Sosinsky GE. Pannexin1 and Pannexin2 channels show quaternary similarities to connexons and different oligomerization numbers from each other. J Biol Chem 2010; 285:24420 - 31; http://dx.doi.org/10.1074/jbc.M110.115444; PMID: 20516070
- Swayne LA, Sorbara CD, Bennett SA. Pannexin 2 is expressed by postnatal hippocampal neural progenitors and modulates neuronal commitment. J Biol Chem 2010; 285:24977 - 86; http://dx.doi.org/10.1074/jbc.M110.130054; PMID: 20529862
- Schalper KA, Palacios-Prado N, Orellana JA, Sáez JC. Currently used methods for identification and characterization of hemichannels. Cell Commun Adhes 2008; 15:207 - 18; http://dx.doi.org/10.1080/15419060802014198; PMID: 18649191
- Silverman W, Locovei S, Dahl G. Probenecid, a gout remedy, inhibits pannexin 1 channels. Am J Physiol Cell Physiol 2008; 295:C761 - 7; http://dx.doi.org/10.1152/ajpcell.00227.2008; PMID: 18596212
- Bopp T, Becker C, Klein M, Klein-Hessling S, Palmetshofer A, Serfling E, Heib V, Becker M, Kubach J, Schmitt S, et al. Cyclic adenosine monophosphate is a key component of regulatory T cell-mediated suppression. J Exp Med 2007; 204:1303 - 10; http://dx.doi.org/10.1084/jem.20062129; PMID: 17502663
- Elgueta R, Tobar JA, Shoji KF, De Calisto J, Kalergis AM, Bono MR, Rosemblatt M, Sáez JC. Gap junctions at the dendritic cell-T cell interface are key elements for antigen-dependent T cell activation. J Immunol 2009; 183:277 - 84; http://dx.doi.org/10.4049/jimmunol.0801854; PMID: 19542439
- Oviedo-Orta E, Errington RJ, Evans WH. Gap junction intercellular communication during lymphocyte transendothelial migration. Cell Biol Int 2002; 26:253 - 63; http://dx.doi.org/10.1006/cbir.2001.0840; PMID: 11991653
- Bermudez-Fajardo A, Ylihärsilä M, Evans WH, Newby AC, Oviedo-Orta E. CD4+ T lymphocyte subsets express connexin 43 and establish gap junction channel communication with macrophages in vitro. J Leukoc Biol 2007; 82:608 - 12; http://dx.doi.org/10.1189/jlb.0307134; PMID: 17596336
- Chused TM, Apasov S, Sitkovsky M. Murine T lymphocytes modulate activity of an ATP-activated P2Z-type purinoceptor during differentiation. J Immunol 1996; 157:1371 - 80; PMID: 8759716
- Aswad F, Kawamura H, Dennert G. High sensitivity of CD4+CD25+ regulatory T cells to extracellular metabolites nicotinamide adenine dinucleotide and ATP: a role for P2X7 receptors. J Immunol 2005; 175:3075 - 83; PMID: 16116196
- Vanden Abeele F, Bidaux G, Gordienko D, Beck B, Panchin YV, Baranova AV, Ivanov DV, Skryma R, Prevarskaya N. Functional implications of calcium permeability of the channel formed by pannexin 1. J Cell Biol 2006; 174:535 - 46; http://dx.doi.org/10.1083/jcb.200601115; PMID: 16908669
- Schanne FA, Kane AB, Young EE, Farber JL. Calcium dependence of toxic cell death: a final common pathway. Science 1979; 206:700 - 2; http://dx.doi.org/10.1126/science.386513; PMID: 386513
- Peñuela S, Bhalla R, Gong XQ, Cowan KN, Celetti SJ, Cowan BJ, Bai D, Shao Q, Laird DW. Pannexin 1 and pannexin 3 are glycoproteins that exhibit many distinct characteristics from the connexin family of gap junction proteins. J Cell Sci 2007; 120:3772 - 83; http://dx.doi.org/10.1242/jcs.009514; PMID: 17925379
- Peñuela S, Celetti SJ, Bhalla R, Shao Q, Laird DW. Diverse subcellular distribution profiles of pannexin 1 and pannexin 3. Cell Commun Adhes 2008; 15:133 - 42; http://dx.doi.org/10.1080/15419060802014115; PMID: 18649185
- Baranova A, Ivanov D, Petrash N, Pestova A, Skoblov M, Kelmanson I, Shagin D, Nazarenko S, Geraymovych E, Litvin O, et al. The mammalian pannexin family is homologous to the invertebrate innexin gap junction proteins. Genomics 2004; 83:706 - 16; http://dx.doi.org/10.1016/j.ygeno.2003.09.025; PMID: 15028292
- Buvinic S, Almarza G, Bustamante M, Casas M, López J, Riquelme M, Sáez JC, Huidobro-Toro JP, Jaimovich E. ATP released by electrical stimuli elicits calcium transients and gene expression in skeletal muscle. J Biol Chem 2009; 284:34490 - 505; http://dx.doi.org/10.1074/jbc.M109.057315; PMID: 19822518
- Ransford GA, Fregien N, Qiu F, Dahl G, Conner GE, Salathe M. Pannexin 1 contributes to ATP release in airway epithelia. Am J Respir Cell Mol Biol 2009; 41:525 - 34; http://dx.doi.org/10.1165/rcmb.2008-0367OC; PMID: 19213873
- Bao L, Locovei S, Dahl G. Pannexin membrane channels are mechanosensitive conduits for ATP. FEBS Lett 2004; 572:65 - 8; http://dx.doi.org/10.1016/j.febslet.2004.07.009; PMID: 15304325
- Locovei S, Wang J, Dahl G. Activation of pannexin 1 channels by ATP through P2Y receptors and by cytoplasmic calcium. FEBS Lett 2006; 580:239 - 44; http://dx.doi.org/10.1016/j.febslet.2005.12.004; PMID: 16364313
- Bennett MV, Contreras JE, Bukauskas FF, Sáez JC. New roles for astrocytes: gap junction hemichannels have something to communicate. Trends Neurosci 2003; 26:610 - 7; http://dx.doi.org/10.1016/j.tins.2003.09.008; PMID: 14585601
- Thompson RJ, Macvicar BA. Connexin and pannexin hemichannels of neurons and astrocytes. Channels (Austin) 2008; 2:81 - 6; http://dx.doi.org/10.4161/chan.2.2.6003; PMID: 18849665
- Bunse S, Locovei S, Schmidt M, Qiu F, Zoidl G, Dahl G, Dermietzel R. The potassium channel subunit Kvbeta3 interacts with pannexin 1 and attenuates its sensitivity to changes in redox potentials. FEBS J 2009; 276:6258 - 70; http://dx.doi.org/10.1111/j.1742-4658.2009.07334.x; PMID: 19780818
- Thompson RJ, Jackson MF, Olah ME, Rungta RL, Hines DJ, Beazely MA, MacDonald JF, MacVicar BA. Activation of pannexin-1 hemichannels augments aberrant bursting in the hippocampus. Science 2008; 322:1555 - 9; http://dx.doi.org/10.1126/science.1165209; PMID: 19056988
- Orellana JA, Shoji KF, Abudara V, Ezan P, Amigou E, Sáez PJ, Jiang JX, Naus CC, Sáez JC, Giaume C. Amyloid β-induced death in neurons involves glial and neuronal hemichannels. J Neurosci 2011; 31:4962 - 77; http://dx.doi.org/10.1523/JNEUROSCI.6417-10.2011; PMID: 21451035
- Oviedo-Orta E, Hoy T, Evans WH. Intercellular communication in the immune system: differential expression of connexin40 and 43, and perturbation of gap junction channel functions in peripheral blood and tonsil human lymphocyte subpopulations. Immunology 2000; 99:578 - 90; http://dx.doi.org/10.1046/j.1365-2567.2000.00991.x; PMID: 10792506
- Sánchez HA, Orellana JA, Verselis VK, Sáez JC. Metabolic inhibition increases activity of connexin-32 hemichannels permeable to Ca2+ in transfected HeLa cells. Am J Physiol Cell Physiol 2009; 297:C665 - 78; http://dx.doi.org/10.1152/ajpcell.00200.2009; PMID: 19587218
- Schalper KA, Sánchez HA, Lee SC, Altenberg GA, Nathanson MH, Sáez JC. Connexin 43 hemichannels mediate the Ca2+ influx induced by extracellular alkalinization. Am J Physiol Cell Physiol 2010; 299:C1504 - 15; http://dx.doi.org/10.1152/ajpcell.00015.2010; PMID: 20881238
- Bianchi BR, Lynch KJ, Touma E, Niforatos W, Burgard EC, Alexander KM, Park HS, Yu H, Metzger R, Kowaluk E, et al. Pharmacological characterization of recombinant human and rat P2X receptor subtypes. Eur J Pharmacol 1999; 376:127 - 38; http://dx.doi.org/10.1016/S0014-2999(99)00350-7; PMID: 10440098
- De Vuyst E, Wang N, Decrock E, De Bock M, Vinken M, Van Moorhem M, Lai C, Culot M, Rogiers V, Cecchelli R, et al. Ca(2+) regulation of connexin 43 hemichannels in C6 glioma and glial cells. Cell Calcium 2009; 46:176 - 87; http://dx.doi.org/10.1016/j.ceca.2009.07.002; PMID: 19656565
- Ataullakhanov FI, Vitvitsky VM. What determines the intracellular ATP concentration. Biosci Rep 2002; 22:501 - 11; http://dx.doi.org/10.1023/A:1022069718709; PMID: 12635847
- Cotrina ML, Lin JH, Alves-Rodrigues A, Liu S, Li J, Azmi-Ghadimi H, Kang J, Naus CC, Nedergaard M. Connexins regulate calcium signaling by controlling ATP release. Proc Natl Acad Sci U S A 1998; 95:15735 - 40; http://dx.doi.org/10.1073/pnas.95.26.15735; PMID: 9861039
- Corriden R, Insel PA. Basal release of ATP: an autocrine-paracrine mechanism for cell regulation. Sci Signal 2010; 3:re1; http://dx.doi.org/10.1126/scisignal.3104re1; PMID: 20068232
- Hisadome K, Koyama T, Kimura C, Droogmans G, Ito Y, Oike M. Volume-regulated anion channels serve as an auto/paracrine nucleotide release pathway in aortic endothelial cells. J Gen Physiol 2002; 119:511 - 20; http://dx.doi.org/10.1085/jgp.20028540; PMID: 12034759
- Sabirov RZ, Okada Y. ATP-conducting maxi-anion channel: a new player in stress-sensory transduction. Jpn J Physiol 2004; 54:7 - 14; http://dx.doi.org/10.2170/jjphysiol.54.7; PMID: 15040843
- Suadicani SO, Brosnan CF, Scemes E. P2X7 receptors mediate ATP release and amplification of astrocytic intercellular Ca2+ signaling. J Neurosci 2006; 26:1378 - 85; http://dx.doi.org/10.1523/JNEUROSCI.3902-05.2006; PMID: 16452661
- Tokunaga A, Tsukimoto M, Harada H, Moriyama Y, Kojima S. Involvement of SLC17A9-dependent vesicular exocytosis in the mechanism of ATP release during T cell activation. J Biol Chem 2010; 285:17406 - 16; http://dx.doi.org/10.1074/jbc.M110.112417; PMID: 20382737
- Taruno A, Vingtdeux V, Ohmoto M, Ma Z, Dvoryanchikov G, Li A, Adrien L, Zhao H, Leung S, Abernethy M, et al. CALHM1 ion channel mediates purinergic neurotransmission of sweet, bitter and umami tastes. Nature 2013; 495:223 - 6; http://dx.doi.org/10.1038/nature11906; PMID: 23467090
- Adinolfi E, Melchiorri L, Falzoni S, Chiozzi P, Morelli A, Tieghi A, Cuneo A, Castoldi G, Di Virgilio F, Baricordi OR. P2X7 receptor expression in evolutive and indolent forms of chronic B lymphocytic leukemia. Blood 2002; 99:706 - 8; http://dx.doi.org/10.1182/blood.V99.2.706; PMID: 11781259
- Wiley JS, Dao-Ung LP, Gu BJ, Sluyter R, Shemon AN, Li C, Taper J, Gallo J, Manoharan A. A loss-of-function polymorphic mutation in the cytolytic P2X7 receptor gene and chronic lymphocytic leukaemia: a molecular study. Lancet 2002; 359:1114 - 9; http://dx.doi.org/10.1016/S0140-6736(02)08156-4; PMID: 11943260
- Paneesha S, Starczynski J, Pepper C, Delgado J, Hooper L, Fegan C, Pratt G. The P2X7 receptor gene polymorphism 1513 A-->C has no effect on clinical prognostic markers and survival in multiple myeloma. Leuk Lymphoma 2006; 47:281 - 4; http://dx.doi.org/10.1080/10428190500305901; PMID: 16321858
- Zhang LY, Ibbotson RE, Orchard JA, Gardiner AC, Seear RV, Chase AJ, Oscier DG, Cross NC. P2X7 polymorphism and chronic lymphocytic leukaemia: lack of correlation with incidence, survival and abnormalities of chromosome 12. Leukemia 2003; 17:2097 - 100; http://dx.doi.org/10.1038/sj.leu.2403125; PMID: 12931211
- Persechini PM, Bisaggio RC, Alves-Neto JL, Coutinho-Silva R. Extracellular ATP in the lymphohematopoietic system: P2Z purinoceptors off membrane permeabilization. Braz J Med Biol Res 1998; 31:25 - 34; http://dx.doi.org/10.1590/S0100-879X1998000100004; PMID: 9686176
- Taylor SR, Alexander DR, Cooper JC, Higgins CF, Elliott JI. Regulatory T cells are resistant to apoptosis via TCR but not P2X7. J Immunol 2007; 178:3474 - 82; PMID: 17339442
- Tsukimoto M, Maehata M, Harada H, Ikari A, Takagi K, Degawa M. P2X7 receptor-dependent cell death is modulated during murine T cell maturation and mediated by dual signaling pathways. J Immunol 2006; 177:2842 - 50; PMID: 16920919
- Strasser A, Pellegrini M. T-lymphocyte death during shutdown of an immune response. Trends Immunol 2004; 25:610 - 5; http://dx.doi.org/10.1016/j.it.2004.08.012; PMID: 15489190
- Brañes MC, Contreras JE, Sáez JC. Activation of human polymorphonuclear cells induces formation of functional gap junctions and expression of connexins. Med Sci Monit 2002; 8:BR313 - 23; PMID: 12165735
- Yaffe D, Saxel O. A myogenic cell line with altered serum requirements for differentiation. Differentiation 1977; 7:159 - 66; http://dx.doi.org/10.1111/j.1432-0436.1977.tb01507.x; PMID: 558123
- Wang XH, Streeter M, Liu YP, Zhao HB. Identification and characterization of pannexin expression in the mammalian cochlea. J Comp Neurol 2009; 512:336 - 46; http://dx.doi.org/10.1002/cne.21898; PMID: 19009624
- Anselmi F, Hernandez VH, Crispino G, Seydel A, Ortolano S, Roper SD, Kessaris N, Richardson W, Rickheit G, Filippov MA, et al. ATP release through connexin hemichannels and gap junction transfer of second messengers propagate Ca2+ signals across the inner ear. Proc Natl Acad Sci U S A 2008; 105:18770 - 5; http://dx.doi.org/10.1073/pnas.0800793105; PMID: 19047635
- Bargiotas P, Krenz A, Hormuzdi SG, Ridder DA, Herb A, Barakat W, Peñuela S, von Engelhardt J, Monyer H, Schwaninger M. Pannexins in ischemia-induced neurodegeneration. Proc Natl Acad Sci U S A 2011; 108:20772 - 7; http://dx.doi.org/10.1073/pnas.1018262108; PMID: 22147915