Abstract
Background
The December 14, 2012 mass shooting at Sandy Hook Elementary School in Newtown, Connecticut, USA, vaulted concerns regarding gun violence to the forefront of public attention. This high-visibility incident occurred within the epidemiological context of U.S. firearm mortality that claims more than 88 lives daily.
Methods
National epidemiologic data on firearm deaths over two decades were analyzed along with data registries on school shootings in order to place the tragedy at Sandy Hook in perspective. School shootings were classified as random or targeted.
Results
The U.S. has the highest rates of firearm deaths, suicides, and homicides among the world’s 34 “advanced economies.” Seventy percent of U.S. homicides and more than 50% of U.S. suicides are committed using a firearm. U.S. firearm homicide rates first declined, and then stabilized, during the past 23 years, 1990-2012. “Shooting massacres” in school settings, a new phenomenon within the past 50 years, are extremely rare events. Over 23 years, 1990-2012, 215 fatal school shooting incidents resulted in 363 deaths, equivalent to 0.12% of national firearm homicides during that time period. Most episodes were “targeted” shootings in which the perpetrator intentionally killed a specific individual in a school setting. Only 25 of these 215 events (11.6%) were “random” or “rampage” shootings, resulting in 135 deaths (0.04% of national firearm homicides). Among these, just three shooting rampages – Columbine High School, Virginia Tech University, and Sandy hook Elementary School – accounted for 72 (53.3%) of these 135 deaths. The frequency of random/rampage shooting incidents in schools has remained within the narrow range of 0 to 3 episodes per year.
Conclusions
Each year, more than 32,000 Americans die by firearms and more than 70,000 are wounded, representing a volume of preventable deaths and injuries that the U.S. government describes as a “public health crisis.” School massacres, such as Sandy Hook, occur periodically, galvanizing public reaction and bringing forth a collective call for intervention. Epidemiological analyses position these rare, but uniquely compelling, incidents within the broader national patterns of gun violence. The intention is to inform the selection of a balanced, comprehensive set of effective remedies to address the daily death toll from firearm suicides and “targeted” firearm homicides that account for more than 99% of firearm fatalities; as well as the rare, random, and sporadic rampage shootings in school or community settings.
Introduction
On December 14, 2012, Sandy Hook Elementary School (456 students in grades kindergarten-4th grade), Newtown, Connecticut, was the scene of a shooting massacre.Citation1 In less than 12 minutes, armed with a Bushmaster XM15-E2S rifle, the 20-year-old perpetrator, Adam Peter Lanza, blasted his way into the locked school building and killed 20 first-grade students and six adult staff, firing off 50 to 100 rounds with his semi-automatic weapon. Most victims died from multiple gunshot wounds inflicted at close range using frangible ammunition that fragments upon impact. As police entered the school responding to the incident, Mr. Lanza killed himself with a handgun. Had officers not arrived on the scene swiftly, Mr. Lanza had sufficient ammunition in large-capacity magazines to expeditiously kill dozens or hundreds more students and teachers. Given the documented motivation of some shooters to attempt to exceed previous body counts,Citation2 Mr. Lanza may have aspired to out-kill Norwegian gunman Anders Breivik who stalked, shot, and killed dozens of unarmed youth and young adults at the Norwegian Labour Party’s summer camp on Utøya Island in July 2011.Citation3,Citation4
The Sandy Hook Elementary School Shooting was a galvanizing — and polarizing —3 event, bringing forth strident calls for gun control and mental health reform.Citation5 President Barack Obama became personally involved, making repeated visits to Newtown, empaneling a special investigative committee, spearheading progress toward implementation of 23 gun violence reduction executive actions,Citation6 packing the chambers of Congress with survivors of gun violence as he delivered his 2013 State of the Union address,Citation7 and actively involving family members of the Sandy Hook victims as advocates for legislation to address this national problem.Citation8 Nevertheless, the forceful political rhetoric and extensive media coverage of the issue of mass violence has yet to result in policy or behavioral change.Citation5,Citation9,Citation10
We have written separatelyCitation5 about the “tipping point” nature of the Sandy Hook Elementary School shooting and the psychological and social media ramifications.Citation11 In the present article, we examine school-based shooting massacres from an epidemiological vantage, exploring the national context of firearm mortality. The purpose is to simultaneously demonstrate both the importance, and the exceptional nature, of school-based shooting massacres.
National patterns of firearm violence and mass shooting events
Gun violence riddles U.S. inner cities and rural areas.Citation12 In 2011, the most recent year for which U.S. national mortality data are available, 32,163 persons were killed by firearms, equivalent to 88 deaths per day.Citation13 The annual firearm homicide death toll, at more than 11,000 deaths in 2011, is equivalent to 30 homicides-by-gun per day, a sobering figure that reproduces the Sandy Hook Elementary School body count each day, every day, year-round.Citation13
Among the 34 nations characterized as “advanced economies,”Citation14 the U.S. rates for total firearm deaths (10.3/100,000 in 2011), firearm suicides (6.30/100,000 in 2011), and firearm homicides (3.60/100,000 in 2011), are unmatched.Citation15-Citation17 In fact, each of these rates is multiple times higher than for any other developed nation.
Firearm mortality in the U.S. represents a compelling public health problem.Citation18 Any comprehensive, population-based approach for reducing the incidence of firearm violence must begin by defining the intricate epidemiologic patterning of firearm-related injury and mortality, including both suicide and homicide by firearms and accidental gun deaths.Citation6,Citation19
Shooting massacres in school and community settings
North and King (2009) examined trends in shooting massacres.Citation20 According to these authors, the frequency of mass shooting events, occurring in school and community settings, has increased with accelerating pace since 1966, beginning with the Austin Tower shootings on the University of Texas campus. Among the top 12 deadliest shootings in history,Citation21 four were school shootings, including the top two deadliest mass shooting events, Virginia Tech University in 2007 (32 firearm homicides and the shooter, Mr. Cho, committed suicide)Citation22,Citation23 and Sandy Hook Elementary School in 2012 (26 firearm homicides at the school following the killing of the shooter’s mother at her home - and the shooter, Mr. Lanza, committed suicide).Citation1 Analyses presented here will examine whether the upward trend noted by North and King continues almost one-half century after the seminal incident in Austin, Texas.
Specific to school shootings, MuschertCitation24 has devised a five-point typology that includes 1) rampage shootings, 2) school invasion mass murders, 3) terrorist attacks on a school or school children, 4) school-related targeted shootings, and 5) government shootings taking place at schools (e.g. Ohio National Guard shooting of Kent State students, May 4, 1970). Fortunately, in the U.S. there have been no episodes of terrorist attacks in schools, although the horrific spectacle of the Beslan School hostage crisis in 2004 compels all nations to be vigilant.Citation25-Citation29 In that event, Chechen and Ingush separatist militants laid siege to Beslan School Number One, in North Ossetia, an autonomous republic in the Russian Federation, holding 1,100 hostages. When Russian security forces entered the building on the third day, 386 persons were killed (334 were hostages, including 156 children) from a combination of improvised explosives, rockets, artillery, and small weapons fire.
The shooting massacres at Sandy Hook Elementary School,Citation1,Citation9 Virginia Tech University,Citation22,Citation23 and Columbine High SchoolCitation2,Citation30-Citation35 are the three highest-fatality examples of “rampage shootings,” as described by Newman et al.Citation36 in their book, Rampage: The Social Roots of School Shootings, in this manner: “An institutional attack takes place on a public stage before an audience, is committed by a member or former member of the institution, and involves multiple victims, some chosen for their symbolic significance or at random. This final condition signifies that it is the organization, not the individuals, who are important.” Actually, the episode at Sandy Hook Elementary School represents the cusp between rampage shootings (Mr. Lanza was a former student, ostensibly an “insider”) and a school-related mass murder (at age 20, Mr. Lanza had graduated from Sandy Hook more than a decade earlier and was, in a sense, an “outsider”).Citation24 Analyses reported here will classify school shootings into the categories of random/rampage (a combination of rampage and school-based mass murder categories in the Muschert typologyCitation24), targeted, and other, in keeping with previous studies from another of our authors (RF).Citation37
To place school-based shooting incidents in public health context, a “top-down” sequence of analyses is presented: 1) international data and rankings of firearm deaths, homicides, and suicides for the world’s 34 “advanced economies;” 2) numbers and time trends in U.S. firearm deaths, homicides, and suicides; 3) 12 deadliest mass shootings and 12 deadliest school shootings in U.S. history; 4) annual school shooting incidents and fatalities; 5) single- vs. multiple-victim school shootings; 6) numbers and trends in school shootings categorized into random/rampage, targeted, or other shooting incidents; and 7) analyses of distinctions between random and targeted shootings in terms of type of school, urban – rural continuum, and perpetrator characteristics. Starting broadly by examining global patterns of firearm deaths, the focus is successively narrowed to U.S. firearm mortality in recent decades, then to firearm homicides, school-based fatal shooting incidents, and finally, to random and targeted subcategories of school shootings.
Methods
A top-down examination of U.S. firearm deaths was performed in the seven-step sequence described below.
1) International rankings of firearm fatalities
Rates of total U.S. firearm deaths, firearm homicides, and firearm suicides per 100,000 citizens, and gun ownership per 100 citizens, were compared to rates among the remainder of the 34 nations with “advanced economies” as identified by the International Monetary Fund (IMF).Citation14-Citation16 The original source for rate and rankings data was a series of country-level reports compiled by the University of Sydney School of Public Health.Citation15 Rate and rank data were organized for the 34 nations, grouped by continent or region, and listed alphabetically within regional groups ().
Table 1. Firearm death rates among developed nations representing the 34 “advanced economies”.
2) U.S. national firearm mortality data
Firearm mortality data for the 22 years, 1990-2011, were obtained from a series of annual National Vital Statistics Reports developed by the National Center for Health Statistics (NCHS).Citation13,Citation38-Citation50 “Final” death data were available for all years, 1990-2010,Citation38-Citation50 and “preliminary” death data were available for 2011.Citation13 NCHS does not yet have mortality data compiled for 2012, the year of the Sandy Hook Elementary School shooting. NCHS data categorizes firearm deaths into firearm suicides, firearm homicides, accidental discharge of a firearm, deaths from firearms occurring during “legal intervention,” and a small residual category described as firearm “deaths of undetermined intent.” Data from these vital statistics reports were compiled by year into tabular format with separate columns for total firearm deaths, firearm homicides, firearm suicides, and “other” firearm deaths [calculated as (total deaths) – (homicides) – (suicides)] (). Each of the annual vital statistics reports provided population (denominator) estimates from the U.S. census used in the computation of firearm death rates per 100,000 U.S. citizens. From these reports, annual rates for total firearm deaths, firearm homicides, firearm suicides, and other firearm deaths were obtained and presented graphically to display time trends ().
Table 2. Annual firearm mortality by type of death, 1990-2011.
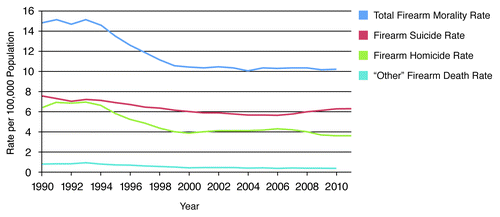
Figure 1. United States annual firearm mortality rates per 100,000 population, 1990-2011.
3) U.S. mass shooting events
The scholarly literature on mass shooting events was explored,Citation2,Citation36,Citation51 and lists of the deadliest mass shootings and school shootings were examined.Citation21,Citation52,Citation53 The 12 deadliest U.S. mass shootings and 12 deadliest U.S. school shootings were tabulated in order by numbers of deaths and described in terms of event, date, city, state, setting, and numbers of persons killed and injured ( and ).Citation21,Citation52,Citation53 The top four deadliest school shootings also appeared among the 12 deadliest mass shootings. These high-fatality mass shooting events were portrayed graphically on a timeline, separating school shootings (appearing above the timeline) from non-school “community” shootings (appearing below the timeline) (). For the purposes of this epidemiological analysis, and provide tallies of the deaths among shooting victims but exclude deaths of shooters. One of our authors (GWM) has carefully examined the issue of including versus excluding shooters and has published on this theme from a sociological vantage.Citation54,Citation55
Table 3. 12 deadliest mass shooting events in the United States.
Table 4. 12 deadliest school shooting events in the United States.
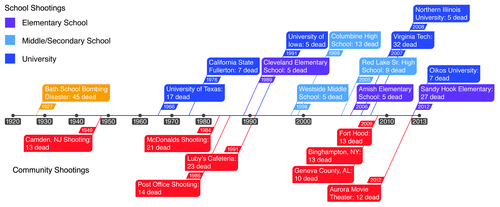
Figure 2. Timeline of deadliest mass shootings in school and community settings, United States.
4) School shooting incidents and fatalities
School shootings were tallied and categorized () for the period 1990 through 2012, by reviewing several corroborating sources. Mortality from school shootings was examined in relation to total firearm deaths, suicides, and homicides (, ).
Table 5. Number of school shooting incidents and deaths by type of shooting, 1990-2012.
Table 6. Distribution of United States firearm deaths, 1990-2011.
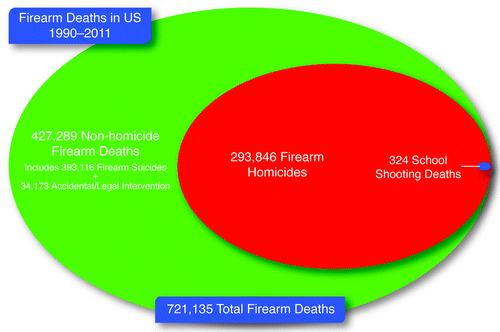
Figure 3. Firearm deaths in United States, 1990–2011.
Primary sources
Appendix L of the Virginia Tech Review Panel details fatal school shootings of 1966 – 2007, giving the date, location, and a brief description of the incident.Citation56 Slate Magazine has compiled a list of fatal school shootings from 1980 to 2012, providing the date, location, number killed, and a timeline graphic of these incidents.Citation57 The National School Safety Center published a report on all school associated deaths, including suicides, homicides, and accidental deaths from 1992 to 2010, giving the date, school name, location, victims’ names, method of killing (e.g. shooting, stabbing, etc.), reason for killing (e.g. gang-related, suicide, accident, etc.), number of victims, and a description of the incident.Citation58 The Brady Campaign to Prevent Gun Violence also produced a listing of school shooting events for the period, 1997 through 2012, giving the date, location, and a brief description of each event.Citation59
School shooting incidents for the period 1990 through 2012 were included in the present analysis if they were listed in rosters of school shootings provided by either the Virginia Tech Review Panel Appendix LCitation56 or the Slate Magazine analysis.Citation57
The National School Safety Center’s listCitation58 was detailed and more expansive, listing many incidents that were suicides or homicides only indirectly related to the school. Thus, only incidents meeting specific criteria, were selected from this list for inclusion in the present study. To be included in the roster of school shootings, an incident from the National School Safety Center’s list needed to indicate the method of death as shooting (deaths from stab/slashing, hanging, jumping, and unknown methods were excluded). Firearm deaths in school settings that were categorized as suicide or legal intervention were excluded, but the remaining categories (interpersonal dispute, gang-related, robbery, accidental, and unknown) were included. To be included in the analysis, location had to be listed as: on campus, playground, hallway, school parking lot, bus/bus stop, athletic field/gym, or school classroom/office. The only location descriptor that was excluded was “near school.” Fatal school firearm incidents from the Brady Campaign to Prevent Gun Violence listCitation59 were used if the incident could be corroborated with a published news article.
During 21 years, 1990-2010, for which estimates of student enrollment (elementary, middle school, high school, and college/university) were available to use as denominator data,Citation60,Citation61 it was possible to calculate school shooting death rates.
5) Single vs. multiple victim school shootings
In parallel with previous reviews of school shootings,Citation62 the roster of selected/included episodes was classified in terms of single victim vs. multiple victim incidents and presented as a graph ().
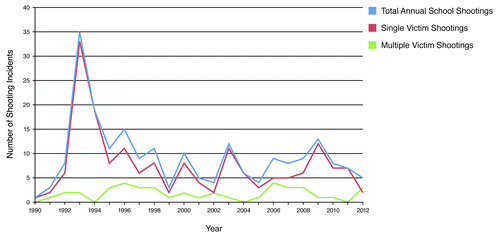
Figure 4. United States school shootings: Single victim vs. multiple victim shooting incidents, 1990-2012.
6) Numbers and trends in fatal school shootings categorized into random/rampage, targeted, or other shooting incident
Details on each of the enumerated fatal school shooting events were compared among the four primary sourcesCitation56-Citation59 and supplemented with news articles gathered by searching the name of the school, the year of the shooting, and the word “shooting” to classify each incident as random, targeted or other ( and , , , and ). A shooting was classified as a “random/rampage” incident if it involved 1) a perpetrator, 2) the intention to commit homicide, 3) no specific person identified as the targeted victim, and 4) one or more victim fatalities. This category subsumes both rampage shootings and school invasion mass murders from the Muschert typology.Citation24 Two shootings were classified as random even though some of the victims were targeted because the part of the incident that occurred on a school campus was random, even though targeted victims (family members in both instances) were killed off campus. A “targeted” incident was one that involved 1) a perpetrator, 2) the intention to shoot someone, 3) a specific targeted person, and 4) death or injury of the targeted person. Gang violence that involved the death of the intended target as the victim was classified as targeted. Incidents were classified as targeted when others, in addition to the targeted individual, were killed. Shootings committed during robbery were also classified as targeted, even if there was no pre-meditated intention to kill the victim. Shooting incidents were classified as “other” if they were accidental, missed the intended target, involved the shooting death of bystanders (but not the intended target) during gang violence, occurred as an act of self-defense, or when it was impossible to determine whether the incident was random or targeted.
Figure 5. Random/rampage, targeted, and other school shooting incidents by year, United States, 1990-2012.
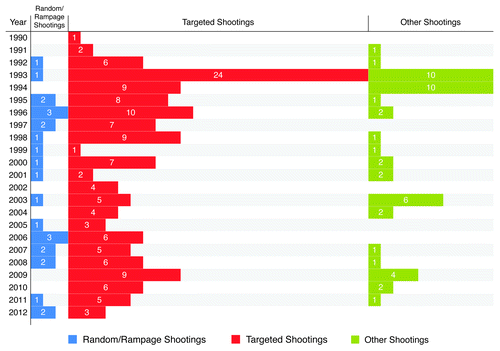
Figure 6. Number of deaths in random/rampage school shootings by incident and year, United States, 1990-2012.
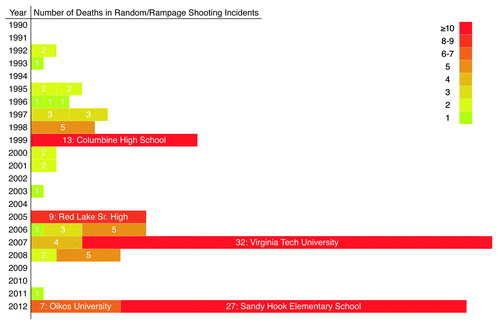
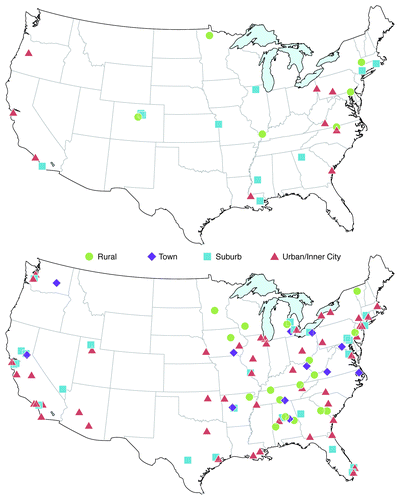
Figure 7. Geographic distribution of school shootings displaying urban/rural continuum, United States, 1990-2012. Random/rampage school shootings (upper map). Targeted school shootings (lower map).
7) Comparison of targeted versus random school shootings
Using geo-coded data for the site of the school shootings, two maps were developed to display and contrast the number and geographic distribution of the random/rampage and targeted shootings (). By using different colors/shapes for the location markers, the shooting incidents were simultaneously portrayed along a four-category, urban–rural continuum consisting of urban/inner city, suburban, town, and rural locales ().
Data analyses contrasted random, targeted, and other school shootings in terms of type of school (elementary school, middle school, high school, college/university) (), urban-rural continuum (urban/inner city, suburban, town, rural) (), and perpetrator characteristics (). Perpetrator information was gathered when available, linked to the year of incident, school name, and school location (city and state). Information from the four primary sourcesCitation56-Citation59 that provided lists of school shootings was compiled on the perpetrator(s) including the perpetrator’s age, gender, relation to the school setting where the incident occurred, and whether the perpetrator committed suicide.
Table 7. Type of school shooting incident in relation to level of educational institution.
Table 8. Type of school shooting incident in relation to urban/rural continuum.
Table 9. Perpetrator characteristics by type of school shooting, 1990-2012.
Results
1) International rankings of firearm fatalities
The U.S. ranks first among the 34 nations with IMF-defined “advanced economies”Citation14 in rates of total firearm deaths, firearm homicides, and firearm suicides (per 100,000 persons) and gun ownership per 100 citizens ().Citation15-Citation17 However, it should be noted that about one dozen developing nations, primarily in Latin America, have higher rates of total firearm deaths (Top 5: Honduras, El Salvador, Swaziland, Guatemala, Colombia) and firearm homicides (Top 5: Honduras, El Salvador, Jamaica, Swaziland, Guatemala) compared to the U.S.Citation15,Citation16
2) U.S. national firearm mortality data, 1990-2011
Annual U.S. firearm deaths for the 22 years, 1990-2011, were categorized into firearm homicides, firearm suicides, other firearm deaths, and total firearm deaths (). Converted to annual rates per 100,000 U.S. citizens, these data were compiled for each of these categories of firearm deaths and presented graphically to examine trends (). The decline in firearm homicides was the major contributor to a corresponding decline in total firearm deaths. In the early 1990s, firearm homicides declined by about one-third from around 17,000 firearm homicides per year to approximately 11-12,000 per year. In parallel, total firearm deaths dropped from 37-38,000 per year to 31-32,000 per year, with corresponding rates dropping from the range of 15 firearm deaths per 100,000 citizens to about 10/100,000. Firearm suicide death rates displayed a downward trend during the late 1990s and early 2000s but this was reversed by a notable upturn since 2006, with increasing numbers and rates each year through 2011.
Firearm fatalities in the United States, 2011
In 2011, 32,163 persons died in firearm-related incidents ().Citation13 Firearms were used in 19,766 (51.6%) of 38,285 suicides (episodes of “intentional self-harm”) and 11,101 (69.6%) of 15,953 homicides. There were also 851 accidental deaths due to discharge of a firearm, 222 firearm deaths of undetermined intent, and 223 firearm deaths due to “legal intervention.”
Twenty-two years of firearm fatalities in the United States, 1990-2011
During the 22-year period, 1990-2011, for which U.S. national mortality figures are available, 721,135 firearm deaths occurred, equivalent to an average of 32,779 deaths annually. Among these, more than half were firearm suicides (393,116, 54.5%). Ongoing increases in suicides have occurred among the civilian population, particularly in the age group 35-64 years.Citation63,Citation64 Rates of suicides in both active-duty military personnel and armed forces veterans have prompted epidemiologic studies and intervention research.Citation65-Citation67 In all population subsets, firearms represent the most common “lethal means” by which individuals commit, and “complete,” an act of suicide.Citation66 Although suicide deaths are not the primary focus of this analysis, the fact that firearms are the primary method of inflicting “intentional self-harm” resulting in death adds a relevant dimension to this discussion.
Returning to the 22-year period, 1990-2011, 293,846 firearm homicides accounted for 40.8 percent of total firearm deaths. Thus, over more than two decades, the average annual number of homicides was 13,356 (almost 37 per day). Fortunately, in contrast to the rise in suicide rates in recent years, the rates and the absolute numbers of both total homicides and firearm homicides have significantly declined during this period.Citation64 Furthermore, the percentage of homicides committed using firearms has significantly decreased.
3) U.S. mass shooting events
The 12 deadliest mass shooting events in U.S. history, through year-end 2012, have all occurred since 1949, claiming a total of 208 lives. Six of these episodes, accounting for 107 deaths, have taken place since 2007. In parallel, the 12 deadliest school massacres in U.S. history have occurred since 1966, claiming a total of 137 lives. Six of these episodes, accounting for 85 deaths, have occurred since 2005. As displayed in and , and , there is an overlap; among the 12 deadliest mass shooting events, four have occurred in school settings (rank order: 1, 2, 5, and 7). Not included in this analysis, but displayed in , is the deadliest school-based mass murder, the 1927 bombing of a school in Bath, Michigan that killed 38 elementary students and 6 adults. This was not a firearm incident although the bomber used a gun to kill his wife prior to blowing up the school.Citation68
4) School shooting incidents and fatalities: Twenty-three years of school shootings in the United States, 1990-2012
Perpetrated school shootings represent a distinct subset of firearm homicides. Over the 23-year period, 1990-2012, a total of 215 school shooting incidents occurred (9.3 per year; range: 1-35) resulting in 363 deaths (15.8 per year; range: 1-44) (). The mean number of fatalities per school shooting across these 215 incidents was 1.69 deaths and most school shootings resulted in a single death.
For 1990-2012, among the 215 episodes of fatal school shootings, only nine resulted in five or more deaths (32, 27, 13, 9, 7, 5, 5, 5 ,5 deaths, respectively). These nine are all represented among the 12 deadliest school shootings in U.S. history (, ). The other three school shootings with five or more deaths (17, 7, 5 deaths, respectively) occurred prior to 1990. It is instructive, therefore, to note the extreme rarity of school “shooting massacres” in the context of the large numbers of firearm deaths and homicides.
During 21 years, 1990-2010, for which an estimate of student enrollment (elementary, middle school, high school, and college/university) exists, it is possible to calculate school shooting death rates. During that period, the number of school shooting deaths per year ranged from 1 (in 1990) to 44 (in 2007) and the total student enrollment for all grades, including institutions of higher education, increased every year, from 61 million (1990) to 76 million (2010). During this time period the school firearm death rate ranged from 0.16 deaths per 10 million students (1990) to 6.1 deaths per 10 million students (2007).
When examining school shooting deaths in relation to the overarching patterns of firearm deaths, the comparison is restricted to the 22-year period, 1990-2011, because U.S. national mortality figures are not available for 2012. It is notable that during this 22-year interval, the 324 school shooting deaths were equivalent to 0.11% of the 293,846 firearm homicides and 0.04% of the 721,135 total firearm deaths (, ).
5) Single vs. multiple victim school shootings, 1990-2012
As a parallel portrayal of the point just made, a spike in single-victim school shootings occurred in 1993 and 1994 but annual numbers of single-victim incidents have remained stable in the 2-to-12 events per year range thereafter. Meanwhile, multiple-victim shooting incidents have fluctuated between 0 and 4 episodes annually for the entire 23-year time period.
6) Numbers and trends in school shootings categorized into random/ rampage, targeted, or other shooting incidents
For the 23-year period, 1990-2012, the 215 fatal school shooting incidents, resulting in 363 deaths, were distributed as follows: 25 random/rampage shootings (135 deaths), 142 targeted shootings (179 deaths), and 48 other shootings (49 deaths) (). Targeted – and “other” - school shooting incidents and deaths were elevated for several years in the early 1990s and then diminished, remaining relatively stable during the past 15 years. The annual number of random/rampage shooting incidents has varied from 0 to 3 events per year without change ().
Random/rampage school shootings
For the 23-year analysis (1990-2012), 25 school-based random shootings occurred, resulting in 135 deaths (mean: 5.40 deaths per incident). The number of random/rampage shooting episodes per year was distributed as follows: 0 incidents (7 years), 1 incident (9 years), 2 incidents (5 years), and 3 incidents (2 years) (, ). Across the 25 incidents, the distribution of random/rampage shooting deaths, in descending order was 32 deaths (1 incident: Virginia Tech University), 27 deaths (1 incident: Sandy Hook Elementary School), 13 deaths (1 incident: Columbine High School), 9 deaths (1 incident: Red Lake Senior High School), 7 deaths (1 incident: Oikos University), 5 deaths (3 incidents: Cleveland School, Northern Illinois University, Amish School), 4 deaths (1 incident), 3 deaths (3 incidents), 2 deaths (6 incidents), and 1 death (7 incidents). As depicted graphically in , three of the 25 random shootings –Sandy Hook Elementary School, Columbine High School, and Virginia Tech University – accounted for 72 of the 135 deaths (53.3%).
Targeted school shootings
For the 23-year analysis period (1990-2012), 142 school-based targeted shootings occurred, resulting in 179 deaths (mean: 1.26 deaths per incident) (, ). Without exception, targeted shootings occurred every year, ranging from 1 to 24 episodes per year. No targeted shooting resulted in more than 5 deaths, and most incidents resulted in a single shooting fatality. The distribution of targeted shooting deaths in descending order was: 5 deaths (2 incidents: Westside Middle School, University of Iowa), 4 deaths (1 incident), 3 deaths (7 incidents), 2 deaths (12 incidents), and 1 death (120 incidents).
7) Comparison of targeted versus random school shootings
During the 23-years, 1990-2012, the 25 random/rampage shootings represented 11.6% of the 215 school shootings and accounted for 135 (37.2%) of the 363 deaths ). The 142 targeted shootings represented 66.1% of school shootings and accounted for 49.3% of school shooting deaths. The 48 “other shootings” contributed the remaining 22.3% of incidents and 13.5% of school shooting deaths. For comparison of numbers and distribution of random and targeted school shooting events, the incidents were plotted geographically on two comparison U.S. maps ().
Level of educational institution
This sub-analysis of 207 school shootings classified the level of the educational institution into four categories: elementary school, middle school, high school, and college/university. About 60% of all school shootings occurred in a high school setting ().
Urban – rural continuum
Schools were classified along an urban-rural gradient as: urban inner city, suburban, small town, or rural. Compared to targeted and other shootings, random shootings tended to occur in either suburban or rural school settings rather than urban inner city locales (). portrays the urban-rural continuum in two comparison maps of targeted and random shootings.
Rampage shooter characteristics
The 12 deadliest school shooting incidents (, ) included 10 random/rampage shootings and two targeted shootings (Westside Middle School, University of Iowa). Among the 14 perpetrators of the 12 deadliest school shootings (), including two shooters each at Columbine High School and Westside Middle School, all were male, ages 11-43 (3 juveniles, 8 in the age range 18-28, 3 over 30), 12 were students (8 current and 4 former) at the school where the shooting took place, and nine shooters committed suicide at the scene. In the U.S., rates of firearm homicides are highest in African-Americans (the majority of both shooters and victims are African-American). Yet none of these 14 shooters (12 white/non-Hispanic, 1 Asian, 1 American Indian) and few of the victims were African-American. Perpetrators of school massacres, and their victims, appear to diverge from the prevalent demographic patterns of the remainder of firearm homicides. On some occasions, the perpetrator has demonstrated behavior problems and is not “fitting in,” a problem that is exacerbated in school systems in close-knit communities.
For 1990-2012, perpetrator characteristics were compared for random/rampage, targeted, and other school shootings (). Most shooters were male and young (mean age: 23.0 years) and half were current or former students in the school where the shooting took place, or in a nearby school. Fourteen percent of the 230 perpetrators committed suicide, including 37% of the random/rampage shooters.
Discussion
Synopsis of findings
This analytical exploration was set in motion by the tragic and horrific mass shooting at Sandy Hook Elementary School that captivated the nation and dominated the media throughout the 2012 year-end holiday season. We have written a commentary describing the synergistic features of this event that produced a “tipping point” phenomenon, generating a critical mass of focused attention.Citation5 While maintaining concentrated coverage on Sandy Hook, print and broadcast media periodically mentioned that this killing took place against a backdrop of high numbers of gun homicides and suicides that occur continuously and unceasingly every day, usually without receiving notice.Citation69 The present analysis was conducted to position the Sandy Hook massacre within the broader epidemiologic context of gun violence in the U.S.
The key findings are: 1) the U.S. has the highest rates of firearm deaths among all developed nations; 2) annual firearm mortality exceeds 32,000 deaths, including 11,000 firearm homicides and almost 20,000 firearm suicides; 3) most firearm homicides – including those that occur in schools - are targeted, single-victim episodes; 4) rampage shooting massacres – whether in community or school settings - are rare and sporadic events; 5) random/rampage school shootings are different from targeted shootings occurring in school settings in terms of: frequency (fewer), numbers of victims per episode (more), urban/rural geography (more suburban), and perpetrator characteristics, including perpetrator suicide on-scene; and 6) the sum of all deaths from all forms of shootings in a school setting – random/rampage, targeted, other – accounts for merely 0.12% (1/800th) of total firearm homicides and 0.05% (1/2000th) of total firearm deaths in the U.S.
Analysis of firearm mortality and a note on firearm injury
At the national level, from a public health vantage, firearms represent the lethal means by which more than 32,000 Americans die each year. Firearms are the method used in the commission of 70% of homicides and more than 50% of suicides. These deaths are human-generated acts of intentional harm to others (homicide) or intentional self-harm (suicide) and thus, these deaths are preventable. This echoes the viewpoint of Dr. Mark Rosenberg who helped establish the National Center for Injury Prevention and Control within the Centers for Disease Prevention and Control (CDC) and led the agency’s early gun violence research.Citation70
Equally preventable is the toll of firearm injuries. According to the Institute of Medicine, “In 2010, more than 105,000 people were injured or killed in the
United States as the result of a firearm-related incident.”Citation19 This figure includes 32,000 firearm deaths and 73,000 non-fatal firearm injuries, representing a ratio of 2.3 firearm injuries per firearm death. Moreover, in the twin tallies of the 12 deadliest mass shootings () and the 12 deadliest school shootings (), the numbers of firearm injuries exceeded the numbers of firearm deaths.
The present analysis has focused on firearm mortality because national death data are available, reliable, complete, carefully verified at state and federal levels, meticulously analyzed by the National Center for Health Statistics, and consistently reported on an annual basis. Although outside of the scope of the current study, additional research on firearm injuries is clearly warranted, especially because of the high likelihood that such injuries may result in life-changing disability, disfigurement, paralysis, or brain damage.
The special case of school shooting massacres
The daily cadence of dozens of firearm suicides and single, targeted homicides that comprise the major burden of intentional death from firearms in the U.S. is periodically punctuated by a multiple-victim shooting massacre. Such mass shootings represent a relatively recent phenomenon in the U.S., dating from the middle of the Twentieth Century. In fact, half of the deadliest community- and school-based mass shootings have occurred since 2005. Sandy Hook Elementary School, Columbine High School, and Virginia Tech University are the most notable U.S. examples of a primary school, a secondary school, and an institution of higher education impacted by a tragic shooting massacre. These specific events are closely cross-referenced in media accounts.Citation71-Citation73 Yet, despite the high visibility and notoriety of such acts, we have demonstrated that the numbers of incidents are few and the numbers of deaths represent a minute fraction of total firearm fatalities.
International perspectives on prevention
Considered in international context, the fact that the U.S. ranks first in gun ownership per capita; and first in rates of total firearm deaths, firearm homicides, firearm suicides; among the 34 most “advanced economies”Citation14 is a powerful testament to the potential for prevention. Reinforcing this point of view, a just-published study examined gun ownership in more than two dozen “developed” countries, including the U.S., and concluded, “The number of guns per capita per country was a strong and independent predictor of firearm-related death in a given country.”Citation74
The other 33 “advanced economies” of the world provide a cross-cultural spectrum of alternatives for achieving much lower rates of firearm deaths through a variety of strategies. These 33 case examples provide ample illustration that gun deaths, both suicides and homicides, can be limited. Indeed, among economically advanced nations, the U.S. is the odd case, the global outlier.
Strategies to reduce the consequences of gun violence
Our canvassing description of firearm mortality in America strongly supports the need to design a comprehensive package of solutions to address the complete spectrum of firearm fatalities. Already, steps have been taken toward these ends since the mass shooting at Sandy Hook Elementary School.
On January 16, 2013, The White House released, “Now is the Time: The President’s Plan to Protect Our Children and Our Communities by Reducing Gun Violence.”Citation75 On that date, President Obama introduced and signed 23 gun violence reduction Executive Actions,Citation6,Citation76 a wide-ranging set of possible remedies compiled from the testimonies of hundreds of experts who appeared before the Gun Violence Task Force. These 23 Executive Actions were grouped into seven categories. Five actions aimed at strengthening the existing background check system, six dealt with empowering law enforcement, two focused on making schools safer, and three encouraged responsible gun ownership. The remaining seven actions were clustered in three categories related to public health and health care services: improving access to mental health care (four actions), preserving the rights of health providers to protect their patients and communities from gun violence (two actions), and finally, a single Executive Action under the heading of “ending the freeze on gun violence research.” This rather provocative phrasing addressed the fact that CDC appropriations for gun violence research were slashed by 96% back in 1996,Citation70 purportedly in retaliation for a 1993 CDC study that showed a threefold higher rate of gun homicides in households with firearms.Citation77 The Executive Action on gun violence is captured in a single sentence, “Issue a Presidential Memorandum directing the Centers for Disease Control to research the causes and prevention of gun violence,”Citation6,Citation77 accompanied by the following background statement:Citation6
There are over 30,000 firearm-related homicides and suicides a year. This fact makes it clear that gun violence is a public health crisis that merits the attention of top public health researchers. But for years, Congress has effectively placed a freeze on gun violence research. The Centers for Disease Control and Prevention and other scientific agencies are prohibited from using funds to “advocate or promote gun control,” and some members of Congress have claimed this ban extends to any research on the causes of gun violence.
Research on gun violence is not advocacy; it is critical public health research. So the President has taken action to immediately restart this important work and is calling on Congress to provide $10 million to allow the CDC to conduct further research.
As an immediate offshoot of this Executive Action, the CDC and CDC Foundation asked the Institute of Medicine (IOM) to convene a committee to define a research agenda that examines both the causes of firearm-related violence and possible interventions and strategies to reduce the public health burden. This initiative has already begun to pay dividends with the release of an initial IOM report in June 2013, entitled, “Priorities for Research to Reduce the Threat of Firearm-Related Violence.”Citation19
Currently, with specific reference to the Sandy Hook shooting massacre, researchers in a variety of institutions are analyzing accessible data on gun violence and publishing findings.Citation78
Concluding Discussion
Firearm violence is a preventable public health crisis. Public health and mental health can play central roles, infusing science and bringing a population perspective to the search for preventive interventions.
The rare rampage shooting incidents in school settings, like Sandy Hook Elementary, provide impetus and leverage to take action and search for solutions.Citation5 In the aftermath of this mass shooting, some of the remedies for healing that can unify and rally the American nation will focus on ensuring the safety of children from gun violence in school settings. This is imperative. However, the present analysis underscores the need to devise a comprehensive set of programs and policies that concurrently address the 99.8% of firearm homicides that occur outside of school settings, and the even larger number of firearm suicides.
Preventive interventions must be devised to mitigate the loss of life to firearm violence across the lifespan. Approaches must identify and address both the common, and the distinguishing, risk factors for firearm suicides and firearm homicides. Within the category of homicides, strategies must confront the mainstay of targeted, single-victim shootings as well as the rare, random, and sporadic rampage massacres in school or community settings.
Related Research Data
References
- Wikipedia. Sandy Hook Elementary School shooting. Available at: http://en.wikipedia.org/wiki/Sandy_Hook_Elementary_School_shooting. Accessed 10 October 2013.
- Larkin RW. The Columbine legacy: Rampage shootings as political acts. Am Behav Sci 2009; 52:1309 - 26; http://dx.doi.org/10.1177/0002764209332548
- Wikipedia. 2011 Norway Attacks. The Available at: https://en.wikipedia.org/wiki/2011_Norway_attacks. Accessed 10 October 2013.
- Newtown Shooter Motivated by Norway Massacre Sources Say. Available at: http://www.cbsnews.com/8301-18563_162-57569958/newtown-shooter-motivated-by-norway-massacre-sources-say/. Accessed 10 October 2013.
- Shultz JM, Muschert GW, Dingwall A, Cohen AM. The Sandy Hook Elementary School shooting as tipping point: “This time Is different. Disaster Health 2013;
- The White House. Progress Report on the President’s Executive Actions to Reduce Gun Violence, 17 April 2013. Available at: http://www.whitehouse.gov/sites/default/files/docs/exec_actions_progress_report_final.pdf. Accessed 10 October 2013.
- The White House. Remarks by the President in the State of the Union Address, 12 February, 2013. Available at: http://www.whitehouse.gov/the-press-office/2013/02/12/remarks-president-state-union-address. Accessed 10 October 2013.
- The White House. Weekly Address: Sandy Hook Victim’s Mother Calls for Commonsense Gun Responsibility Reforms. Available at: http://www.whitehouse.gov/the-press-office/2013/04/12/weekly-address-sandy-hook-victim-s-mother-calls-commonsense-gun-responsi. Accessed 10 October 2013.
- Schildkraut J, Muschert GW. Violent media, guns, and mental illness: The three ring circus of causal factors for school massacres, as related in media discourse. In: Agger B, Luke T (eds.): Gun Violence and Public Life. St. Paul, MN: Paradigm Publishing, 2013.
- Birkland TA, Lawrence RG. Media framing and policy change after Columbine. Am Behav Sci 2009; 52:1405 - 25; http://dx.doi.org/10.1177/0002764209332555
- Cillizza C. The gun debate: Are the Newtown, Conn., killings a tipping point? The Washington Post, 16 December 2012. Available at: http://articles.washingtonpost.com/2012-12-16/politics/35864130_1_gun-control-gun-ownership-stricter-gun-laws. Accessed 10 October 2013.
- Norris FH. Impact of mass shooting on survivors, families, and communities. PTSD Research Quarterly 2007; 18:1 - 7
- Hoyert DL, Xu JQ. Deaths: Preliminary data for 2011. Natl Vital Stat Rep. 2012; 61(6):1-50. Hyattsville, MD: National Center for Health Statistics. Available at: http://www.cdc.gov/nchs/data/nvsr/nvsr61/nvsr61_06.pdf. Accessed 10 October 2013.
- International Monetary Fund. World Economic Outlook: Growth Resuming, Dangers Remain: A Survey by the Staff of the International Monetary Fund. Washington, DC, April, 2012, pages 177-180. ISBN 978-1-61635-246-2. Available at: http://www.imf.org/external/pubs/ft/weo/2012/01/. Accessed 10 October 2013.
- Sydney School of Public Health. GunPolicy.org Website: International Firearm Injury Prevention and Policy. University of Sydney, New South Wales, Australia. Available at: http://www.gunpolicy.org/firearm/home. Accessed 10 October 2013.
- Wikipedia. List of Countries by Firearm-Related Death Rate. Available at: http://en.wikipedia.org/wiki/List_of_countries_by_firearm-related_death_rate. Accessed 10 October 2013.
- Krug EG, Powell KE, Dahlberg LL. Firearm-related deaths in the United States and 35 other high- and upper-middle-income countries. Int J Epidemiol 1998; 27:214 - 21; http://dx.doi.org/10.1093/ije/27.2.214; PMID: 9602401
- Mozaffarian D, Hemenway D, Ludwig DS. Curbing gun violence: lessons from public health successes. JAMA 2013; 309:551 - 2; http://jama.jamanetwork.com/article.aspx?articleid=1556167 http://dx.doi.org/10.1001/jama.2013.38; PMID: 23295618
- Institute of Medicine. Report Brief: Priorities for Research to Reduce the Threat of Firearm-Related Violence. Institute of Medicine, National Research Council. Washington, DC, 2013. Available at: http://www.iom.edu/~/media/Files/Report%20Files/2013/Firearm-Violence/FirearmViolence_RB.pdf. Accessed 10 October 2013.
- North CS, King RV. Eyewitness to Mass Murder. In: Neria Y, Galea S, Norris FH, eds. Mental Health and Disasters. Cambridge University Press, 2009, pp. 497-507.
- Berkowitz B, Cuadra A, Rivero C, Stanton L, Wei S. The Washington Post. Deadliest U.S. Shootings. Available at: http://www.washingtonpost.com/wp-srv/special/nation/deadliest-us-shootings/. Accessed 10 October 2013.
- Virginia Tech Review Panel. Mass Shootings at Virginia Tech. Report of the Review Panel Presented to Governor Kaine, Commonwealth of Virginia. August, 2007. Available at: http://www.governor.virginia.gov/tempcontent/techpanelreport.cfm. Accessed 10 October 2013.
- Wikipedia. Virginia Tech massacre. Available at: http://en.wikipedia.org/wiki/Virginia_Tech_massacre. Accessed 10 October 2013.
- Muschert GW. Research in school shootings. Soc Compass 2007; 1:60 - 80; http://dx.doi.org/10.1111/j.1751-9020.2007.00008.x
- Wikipedia. Beslan School Hostage Crisis. Available at: http://en.wikipedia.org/wiki/Beslan_school_hostage_crisis. Accessed 10 October 2013.
- Tuathail GO. Placing blame: Making sense of Beslan. Polit Geogr 2009; 28:4 - 15; http://dx.doi.org/10.1016/j.polgeo.2009.01.007
- Scrimin S, Axia G, Capello F, Moscardino U, Steinberg AM, Pynoos RS. Posttraumatic reactions among injured children and their caregivers 3 months after the terrorist attack in Beslan. Psychiatry Res 2006; 141:333 - 6; http://dx.doi.org/10.1016/j.psychres.2005.11.004; PMID: 16515809
- Scrimin S, Moscardino U, Capello F, Axia G. Attention and memory in school-age children surviving the terrorist attack in Beslan, Russia. J Clin Child Adolesc Psychol 2009; 38:402 - 14; http://dx.doi.org/10.1080/15374410902851689; PMID: 19437300
- Vetter S, Dulaev I, Mueller M, Henley R, Gallo W, Kanukova Z. Impact of resilience enhancing programs on youth surviving the Beslan school siege. Child Adolesc Psychiatry Ment Health 2010; 4:1 - 11; http://dx.doi.org/10.1186/1753-2000-4-11; PMID: 20051130
- Larkin R. Comprehending Columbine. Philadelphia, PA: Temple University Press. 2007.
- Muschert GW, Henry S, Bracy NL, Peguero AA, eds. Responding to School Violence: Confronting the Columbine Effect. Boulder CO: Lynne Rienner Publishers, Inc. 2013.
- Muschert GW. The Columbine victims and the myth of the juvenile superpredator. Youth Violence Juv Justice 2007; 5:351 - 66; http://dx.doi.org/10.1177/1541204006296173
- Muschert GW, Larkin RW. The Columbine High School Shootings. In: S Chermak & FY Bailey (eds): Crimes and Trials of the Century. Westport, CT: Praeger. 2007, pages 253-266.
- Muschert GW, Peguero AA. The Columbine effect and school anti-violence policy. Research in Social Problems and Public Policy: New Approaches to Social Problems Treatment. 2010; 17:117 - 48; http://dx.doi.org/10.1108/S0196-1152(2010)0000017007
- Muschert GW, Ragnedda M. Media and violence control: The framing of school shootings. In: Heitmeyer W, Haupt H, Malthaner S, Kirschner A (eds.): The Control of Violence in Modern Society: Multidisciplinary Perspectives from School Shootings to Ethnic Violence. New York, NY: Springer Publishing, 2010. pp 345-361.
- Newman K, Fox C, Harding D, Mehta J, Roth W. Rampage: The Social Roots of School Shootings. New York: Basic Books. 2004.
- de Apodaca RF, Brighton LM, Perkins AN, Jackson KN, Steege JR. Characteristics of schools in which fatal shootings occur. Psychol Rep 2012; 110:363 - 77; http://dx.doi.org/10.2466/13.16.PR0.110.2.363-377; PMID: 22662391
- Centers for Disease Control and Prevention. WISQARS. Fatal Injury Reports, 1981-1998. http://webappa.cdc.gov/sasweb/ncipc/mortrate9.html. Accessed 10 October 2013.
- Hoyert DL, Arias E, Smith BL, Murphy SL, Kochanek KD. Deaths: Final Data for 1999. Natl Vital Stat Rep. 2001; 49(8). Hyattsville, MD: National Center for Health Statistics.
- Miniño AM, Arias E, Kochanek KD, Murphy SL, Smith BL. Deaths: Final Data for 2000. Natl Vital Stat Rep. 2002; 50(15). Hyattsville, MD: National Center for Health Statistics.
- Arias E, Anderson RN, Hsiang-Ching K, Murphy SL, Kochanek KD. Deaths: Final data for 2001. Natl Vital Stat Rep. 2003; 52(3). Hyattsville, MD: National Center for Health Statistics.
- Kochanek KD, Murphy SL, Anderson RN, Scott C. Deaths: Final data for 2002. Natl Vital Stat Rep. 2004; 53(5). Hyattsville, MD: National Center for Health Statistics.
- Hoyert DL, Heron MP, Murphy SL, Kung H. Deaths: Final Data for 2003. Natl Vital Stat Rep. 2006; 54(13). Hyattsville, MD: National Center for Health Statistics.
- Miniño AM, Heron MP, Murphy SL, Kochankek KD. Deaths: Final Data for 2004. Natl Vital Stat Rep. 2007; 55(19). Hyattsville, MD: National Center for Health Statistics.
- Kung HC, Hoyert DL, Xu JQ, Murphy SL. Deaths: Final data for 2005. Natl Vital Stat Rep. 2008; 56(10). Hyattsville, MD: National Center for Health Statistics.
- Heron MP, Hoyert DL, Murphy SL, Xu JQ, Kochanek KD, Tejada-Vera B. Deaths: Final data for 2006. Natl Vital Stat Rep. 2009; 57(14). Hyattsville, MD: National Center for Health Statistics.
- Xu JQ, Kochanek KD, Murphy SL, Tejada-Vera B. Deaths: Final data for 2007. Natl Vital Stat Rep. 2010; 58(19). Hyattsville, MD: National Center for Health Statistics.
- Miniño AM, Murphy SL, Xu JQ, Kochanek KD. Deaths: Final data for 2008. Natl Vital Stat Rep. 2011; 59(10). Hyattsville, MD: National Center for Health Statistics.
- Kochanek KD, Xu J, Murphy SL, et al. Deaths: Final Data for 2009. Natl Vital Stat Rep. 2012; 60(3). Hyattsville, MD: National Center for Health Statistics.
- Murphy SL, Xu JQ, Kochanek KD. Final Data for 2010. Natl Vital Stat Rep. 2013; 61(4). Hyattsville, MD: National Center for Health Statistics.
- Moore MH, Petrie CV, Braga AA, McLaughlin BL. Deadly Lessons: Understanding Lethal School Violence. Washington, DC: The National Academies Press. 2003.
- News MSN. 14 December 2012. Timeline: Deadliest Attacks at US Schools and Colleges. Available at: http://news.msn.com/us/timeline-deadliest-attacks-at-us-schools-and-colleges. Accessed 10 October 2013.
- The Associated Press. AP Lists Deadliest School Shootings in US. http://www.wrdw.com/home/headlines/AP-lists-deadliest-school-shootings-in-US-183539321.html. Accessed 10 October 2013.
- Spencer JW, Muschert GW. The contested meaning of the crosses at Columbine. Am Behav Sci 2009; 52:1371 - 86; http://dx.doi.org/10.1177/0002764209332553
- Muschert GW, Janssen L. Deciphering rampage: Assigning blame to youth offenders in news coverage of school shootings.” In: Muschert GW, Sumiala J (eds.). School Shootings: Mediatized Violence in a Global Age. Series on Studies in Media and Communications, Volume 7. Bingley, UK: Emerald Group Publishing, 2012.
- Virginia Tech Review Panel. Appendix L, Fatal School Shootings in the United States: 1966-2007. Available at: http://www.governor.virginia.gov/tempcontent/techPanelReport-docs/27%20APPENDIX%20L%20-%20Fatal%20School%20Shooting%20in%20the%20US.pdf. Accessed 10 October 2013.
- Kirk C. Since 1980, 297 People Have Been Killed in School Shootings. 19 December 2012. Available at: http://www.slate.com/articles/news_and_politics/map_of_the_week/2012/12/sandy_hook_a_chart_of_all_196_fatal_school_shootings_since_1980_map.html. Accessed 10 October 2013.
- National School Safety Center. School Associated Violent Deaths. 3 March 2010. Available at: https://docs.google.com/viewer?a=v&pid=sites&srcid=c2Nob29sc2FmZXR5LnVzfG5zc2N8Z3g6NWFlZDdjZjBjMGY1Yjc3Mw. Accessed 10 October 2013.
- Brady Campaign to Prevent Gun Violence. Major School Shootings in the United States since 1997. December 2012. Available at: http://www.bradycampaign.org/xshare/pdf/school-shootings.pdf. Accessed 10 October 2013.
- Institute of Education Sciences. National Center for Education Statistics. Search for Schools, Colleges, and Libraries. http://nces.ed.gov/globallocator/. Accessed 10 October 2013.
- Institute of Education Sciences. National Center for Education Statistics. Digest of Education Statistics. http://nces.ed.gov/programs/digest/. Accessed 10 October 2013.
- Anderson M, Kaufman J, Simon TR, Barrios L, Paulozzi L, Ryan G, Hammond R, Modzeleski W, Feucht T, Potter L, School-Associated Violent Deaths Study Group. School-associated violent deaths in the United States, 1994-1999. JAMA 2001; 286:2695 - 702; http://dx.doi.org/10.1001/jama.286.21.2695; PMID: 11730445
- Centers for Disease Control and Prevention (CDC). Suicide among adults aged 35-64 years--United States, 1999-2010. MMWR Morb Mortal Wkly Rep 2013; 62:321 - 5; PMID: 23636024
- Centers for Disease Control and Prevention (CDC). Firearm homicides and suicides in major metropolitan areas - United States, 2006-2007 and 2009-2010. MMWR Morb Mortal Wkly Rep 2013; 62:597 - 602; PMID: 23903593
- Lineberry TW, O’Connor SS. Suicide in the US Army. Mayo Clin Proc 2012; 87:871 - 8; http://dx.doi.org/10.1016/j.mayocp.2012.07.002; PMID: 22958991
- Anestis MD, Bryan CJ. Means and capacity for suicidal behavior: a comparison of the ratio of suicide attempts and deaths by suicide in the US military and general population. J Affect Disord 2013; 148:42 - 7; http://dx.doi.org/10.1016/j.jad.2012.11.045; PMID: 23261130
- LeardMann CA, Powell TM, Smith TC, Bell MR, Smith B, Boyko EJ, Hooper TI, Gackstetter GD, Ghamsary M, Hoge CW. Risk factors associated with suicide in current and former US military personnel. JAMA 2013; 310:496 - 506; http://dx.doi.org/10.1001/jama.2013.65164; PMID: 23925620
- Wikipedia. Bath School Disaster. Available at: http://en.wikipedia.org/wiki/Bath_School_disaster. Accessed 10 October 2013.
- Selway W, Crawford AJ, Vekshin A. Daily Gun Slaughter in U.S. Obscured by Newtown Rampage. Bloomberg News. Dec 21, 2012. Available at: http://www.bloomberg.com/news/2012-12-21/daily-gun-slaughter-in-u-s-obscured-by-newtown-rampage.html. Accessed 10 October 2013.
- Straussmann M. NRA, Congress stymied CDC gun research budget. CBS Evening News, July 17, 2013. Available at: http://www.cbsnews.com/8301-18563_162-57564599/nra-congress-stymied-cdc-gun-research-budget/. Accessed 10 October 2013.
- Muschert GW. Frame-changing in the media coverage of a school shooting: The rise of Columbine as a national concern. Soc Sci J 2009; 46:164 - 70; http://dx.doi.org/10.1016/j.soscij.2008.12.014
- Muschert GW. School shootings as mediatized violence. In: Böckler N, Seeger T, Sitzer P, Heitmeyer W (eds.): School Shootings: International Research, Case Studies, and Concepts for Prevention. New York, NY: Springer Publishing, 2012.
- Muschert GW, Carr DC. Media salience and frame changing across events: Coverage of nine school shootings, 1997-2001. Journalism Mass Commun Q 2006; 83:747 - 66; http://dx.doi.org/10.1177/107769900608300402
- Bangalore S, Messerli FH. Gun ownership and firearm-related deaths. Am J Med 2013; 126:873 - 6; http://dx.doi.org/10.1016/j.amjmed.2013.04.012; PMID: 24054955
- The White House. Now is the Time: The President’s Plan to Protect Our Children and Our Communities by Reducing Gun Violence. January 16, 2013. Available at: http://www.whitehouse.gov/issues/preventing-gun-violence. Accessed 10 October 2013.
- Politics WP. President Obama’s remarks on new gun control actions (Transcript). Washington Post, January 16, 2013. Available at: http://www.washingtonpost.com/politics/president-obamas-remarks-on-new-gun-control-proposals-jan-16-2013-transcript/2013/01/16/528e7758-5ffc-11e2-b05a-605528f6b712_story.html. Accessed 10 October 2013.
- Kellermann AL, Rivara FP, Rushforth NB, Banton JG, Reay DT, Francisco JT, Locci AB, Prodzinski J, Hackman BB, Somes G. Gun ownership as a risk factor for homicide in the home. N Engl J Med 1993; 329:1084 - 91; http://dx.doi.org/10.1056/NEJM199310073291506; PMID: 8371731
- Siegel M, Ross CS, King C 3rd. The relationship between gun ownership and firearm homicide rates in the United States, 1981-2010. Am J Public Health 2013; 103:2098 - 105; http://dx.doi.org/10.2105/AJPH.2013.301409; PMID: 24028252