Abstract
Prenatal development and early childhood are critical periods for establishing the tissue-specific epigenome, and may have a profound impact on health and disease in later life. However, epigenomic profiles at birth and in early childhood remain largely unexplored. The focus of this report is to examine the individual variation and longitudinal pattern of genome-wide DNA methylation levels from birth through the first two years of life in 105 Black children (59 males and 46 females) enrolled at the Boston Medical Center. We performed epigenomic mapping of cord blood at birth and venous blood samples from the same set of children within the first two years of life using Illumina Infinium Humanmethylation27 BeadChip. We observed a wide range of inter-individual variations in genome-wide methylation at each time point including lower levels at CpG islands, TSS200, 5′UTR and 1st Exon locations, but significantly higher levels in CpG shores, shelves, TSS1500, gene body and 3′UTR. We identified CpG sites with significant intra-individual longitudinal changes in the first two years of life throughout the genome. Specifically, we identified 159 CpG sites in males and 149 CpG sites in females with significant longitudinal changes defined by both statistical significance and magnitude of changes. These significant CpG sites appeared to be located within genes with important biological functions including immunity and inflammation. Further studies are needed to replicate our findings, including analysis by specific cell types, and link those individual variations and longitudinal changes with specific health outcomes in early childhood and later life.
Introduction
DNA methylation on the carbon-5 position of the pyrimidine ring of cytosine in a CpG dinucleotide is one of the epigenetic marks that influences gene expression.Citation1 In contrast to relatively stable genetic sequences, DNA methylation patterns are dynamic in response to internal and external environmental stimuli throughout the lifecycle.Citation2,Citation3 For example, demographic factors (e.g., age and gender), environmental exposures (e.g., cigarette smoking and folate intake) and genetic variations (e.g., SNPs and CNVs) all can influence DNA methylation patterns.Citation4-Citation8 Epigenetic variations are associated with normal growth and development and with health outcomesCitation2,Citation3 and diseases including obesity, diabetes, cardiovascular disease, cancer and allergic disease.Citation1,Citation9-Citation14 There is a growing recognition that epigenetic mechanisms are likely the interface that connects the influence of genetic and environmental factors on gene expression, cell/tissue function and the development of disease.Citation3
This report attempts to fill several gaps in the field. Prenatal development and early childhood are critical periods for the establishment of the epigenome.Citation3,Citation15-Citation18 Epigenomic profiles at birth reflect a net result of underlying genetic variations, in utero environmental exposures and stochastic epigenetic changes.Citation16 Animal studies have demonstrated that early maternal care could influence the epigenetic processes of the offspring and subsequently contribute to inter-individual variations in future behavior.Citation15,Citation17,Citation18 Despite the critical role of the epigenome at birth and during early childhood in the health outcomes of later life, there is a particular lack of epigenomic data during this time period in humans. Several studies have examined DNA methylation in cord blood,Citation19-Citation26 but these studies were either limited to global methylation (e.g., Alu and LINE-1 repeated sequences throughout the genome) or, in the case of genome-wide DNA methylation at a single nucleotide resolution, limited to a small sample size (i.e., 12 cord blood samplesCitation20) or limited to the study of DNA methylation determinantsCitation22,Citation23,Citation25 rather than looking into DNA methylation profiles at birth and longitudinal patterns from birth onward. While several studies have evaluated the longitudinal changes of genome-wide DNA methylation in peripheral blood cells in adults,Citation27-Citation29 longitudinal epigenomic profiles from birth to early childhood remain unexplored. Previous studies have suggested that DNA methylation levels vary by specific locations across CpG and gene structures in the genome in both the normal condition and in the disease state. For example, when considering CpG islands relative to the RefSeq genes, the percentage of methylated CpG islands was highest in gene body, followed by 3′ end of a gene, intergenic, and 5′ end of a gene in human B cells.Citation30 In general, CpG islands have significantly lower methylation levels than non-CpG island regions across different tissues;Citation20,Citation31-Citation33 and most methylation alterations, for instance in colon cancer, occur at CpG island shores (i.e., < 2,000 bp from the borders of a CpG island) rather than at CpG islands.Citation34 However, no cross-sectional or longitudinal data are available to address whether DNA methylation levels vary by specific locations across CpG and gene structures on a genome-wide scale at birth and within the first two years of life.
Using a prospective birth cohort design, we sought to address the following questions: (1) what is the genome-wide DNA methylation profile at birth and in the first two years of life and does it vary by gender and among individuals? (2) What is the longitudinal pattern of DNA methylation from birth to the first two years of life and does it vary by gender and among individuals? And (3) do cross-sectional and longitudinal patterns of DNA methylation vary across CpG and gene structures throughout the genome?
A total of 105 Black children (59 males and 46 females) enrolled at Boston Medical Center were included in this study. We performed epigenomic mapping for paired cord blood samples at birth and venous blood samples from the same set of children within the first two years of life using Illumina Infinium Humanmethylation27 BeadChip. To our knowledge, this is the first and the largest epigenomic study of its kind in a prospective US birth cohort.
Results
Characteristics of study population
Our study included 105 pairs of cord blood samples at birth and venous blood samples within the first two years of life. Blood samples were obtained from 46 (43.81%) females and 59 (56.19%) males with a mean follow-up age of 0.99 (± 0.33) years. The study children were all Black, singleton, full-term births, with an average African ancestry proportion of 81% (± 15%). The average birth weight was 3301 (± 490) grams and average gestational age was 40 (± 1.2) weeks.
Distributions and variations of methylation levels
shows the distributions of methylation levels of 27K CpG sites within and across each study sample. A bimodal pattern was observed for the methylation-level distribution of all CpG sites within each sample. Approximately 45% of the CpG sites had methylation levels less than 0.1 in both male and female samples at each time point. In addition, less than 20% of the CpG sites had methylation levels greater than 0.8. The inter-individual variability of CpG sites’ proportions with methylation levels < 0.2 appeared higher than those with methylation levels > 0.2. We also found a wide range of inter-individual variations in genome-wide methylation levels (Figs. S1andS2), although the majority of CpG sites (~90%) had a median absolute deviation (MAD) of less than 0.04 for both cord and postnatal samples.
Figure 1. Gender specific distributions [(A) male, (B) female] of methylation levels of 27K CpG sites at two time points. CB stands for cord blood and PB stands for postnatal blood. The y-axis is the proportions of CpG sites corresponding to methylation categories specified by the x-axis. A bimodal distribution pattern was observed for both cord and postnatal blood samples. Comparisons of proportions of CpG sites in different methylation categories were conducted between males and females, and between cord and postnatal blood samples using Wilcoxon Rank Sum test or Wilcoxon Signed-Rank test. The FDR adjusted p-values are presented in the table below the figure.
![Figure 1. Gender specific distributions [(A) male, (B) female] of methylation levels of 27K CpG sites at two time points. CB stands for cord blood and PB stands for postnatal blood. The y-axis is the proportions of CpG sites corresponding to methylation categories specified by the x-axis. A bimodal distribution pattern was observed for both cord and postnatal blood samples. Comparisons of proportions of CpG sites in different methylation categories were conducted between males and females, and between cord and postnatal blood samples using Wilcoxon Rank Sum test or Wilcoxon Signed-Rank test. The FDR adjusted p-values are presented in the table below the figure.](/cms/asset/03fa94d6-4133-4b22-a461-217ed7d00aec/kepi_a_10920117_f0001.gif)
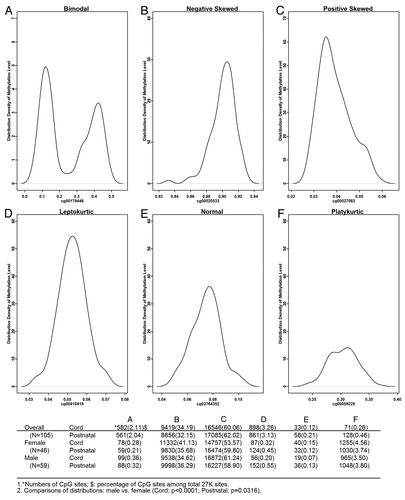
Six major types of methylation-level distributions of the 27K probes were identified across the 105 samples (). The majority of CpG sites had positively skewed (~60%) or negatively skewed distributions (~30%). About 2% of the CpG sites had bimodal distributions, and less than 1% was normally distributed. The number of CpG sites across six types of distributions was significantly different between males and females both for cord and postnatal samples. For example, the percentage of CpG sites with a negatively skewed distribution was 41% in males compared with 35% in females in cord blood samples. We further explored how bimodal CpG sites were distributed across chromosomes. In all 105 samples, we found that 538 (92%) bimodal CpG sites in cord blood samples and 521 (93%) sites in postnatal samples were on the X chromosome. However, in male cord blood samples, 52 (53%) bimodal sites were on the X chromosome, but in female cord blood samples only 2 (3%) sites were on the X chromosome. Similar results were observed in postnatal samples. It appears that CpG sites on the X chromosome account for the majority of bimodal distributions in combined samples and in male samples but not in female samples. We further investigated whether CpG sites with bimodal distribution across samples were associated with SNPs or frequent structural variations. Interestingly, the majority of these CpG sites on the X chromosome were away from the known SNPs.
Figure 2. Six major types of DNA methylation distributions across 105 samples. The number of CpG sites (and the proportion) with each specific distribution is presented in the table below the figure. Bimodal (A) and unimodal distributions (B to F) were identified using the DIP test (the threshold value for combined samples is 0.051, for male samples is 0.074, and for female samples is 0.067). Kurtosis (K) and Skewness (S) parameters were used to further classify unimodal distributions into five categories: (B) S < -0.03, (C) S > 0.03, (D) -0.03 ≤ S ≤ 0.03 and K > 0.05, (E) -0.03 ≤ S ≤ 0.03 and -0.05 ≤ K ≤ 0.05, and (F): -0.03 ≤ S ≤ 0.03 and K < -0.05. The kurtosis was estimated using the moment method and then subtract 3.
Longitudinal changes in methylation from birth to the first two years of life
DNA methylation changes over time were evaluated based on continuous β values and/or changes in methylation categorical status from birth to the first two years of life. Tables S1 and S2 listed CpG sites with significant genome-wide methylation level changes in the first two years of life for males and females, separately. Some gender differences were noticed at each time point, especially on the X chromosome (Fig. S3 and S4). However, changes over time were not significantly different between males and females in all chromosomes except for the X chromosome (Figs. S5 and S6). The inter-individual variability of methylation changes ranged from 0.003 to 0.1, which was similar within each gender. Categorical classification of CpG sites showed that about 95% of CpG sites stayed in the same category from birth through the first two years of life, and only 5% of CpG sites had methylation categorical changes ranging from hypo to intermediate, intermediate to hyper, intermediate to hypo, or hyper to intermediate (). When we combined the results of continuous methylation level changes and categorical status changes according to stringent criteria as described in the Statistical Analysis Methods section, we identified a total of 149 significant CpG sites in female samples and 159 significant CpG sites in male samples, and of those 98 CpG sites were shared by both males and females (Table S3). Among the 98 sites, 2% changed from intermediate to hypo-methylation, 27% changed from intermediate to hyper-methylation and 71% changed from hyper-methylation to the intermediate methylation category.
Table 1. Dynamic changes of 27K probes from birth to the first 2 years of life
Using the significant CpG sites identified above, we further conducted network analyses using IPA software and presented five networks showing the top scores for males and females, separately (Tables S1 and S2). The top functions of networks were largely overlapped across gender, and were mainly associated with hematological system development and function, or immune and inflammatory response. We present the top network with the highest score in Figures S7 (males) and S8 (females) and their detailed biological functions in Tables S7 and S8. Specifically, for males the methylation levels of the tested probes in six genes increased while ten decreased during the first two years of life. For females, the number of CpG site annotated genes with increased and decreased methylation levels during the first two years of life was seven and nine, respectively. We also conducted IPA analysis for 98 common CpG sites across gender (Table S6) and detailed results are presented in Table S3.
Methylation patterns within CpG island groups and gene structures
We investigated methylation patterns within CpG island groups ( and S9) and different gene structures ( and S10) by gender at each time point. Among 27K probes, 43% were within CpG islands, 17% distributed in the north shore,Citation34 15% were in the south shore, about 1% was within the north shelf (a gene feature beyond the north shoreCitation35) and the south shelf (a gene feature beyond the south shoreCitation35) each, while the rest were located at non-CpG islands and their nearby features. We found a “U” shape pattern of methylation levels across CpG island groups, i.e., CpG islands had the lowest methylation levels, and the further away from the CpG islands the higher the methylation levels became (). This “U” shape pattern was similar for both males and females at each time point. In parallel with the “U” shape cross-sectional pattern, longitudinal changes were similar between north and south shelves and between north and south shores, though they all differed from that found in CpG islands (all p < 0.0001). This observation was true for both males and females (). We did find a significant gender difference in the distributions of methylation levels within CpG islands for both cord (p < 0.0001) and postnatal samples (p = 0.0084), but this was not the case in other CpG island groups.
Figure 3. Distributions of mean methylation levels are presented at different CpG island groups for cord blood samples at birth (A) and postnatal venous samples within 2 y of life (B). For each boxplot, the dot in the box represents the mean methylation level, and the horizontal bar in the box is the median methylation level. The two horizontal bars below the 25th percentile bars (the bottom side of the box) reflect the minimum and 5th percentile, respectively. Similarly, the top two bars above the 75th percentile (the top side of the box) reflect the 95th percentile and the maximum, respectively. The lower two panels are density plots of changes in methylation levels (postnatal minus cord) for males (C) and females (D), respectively.
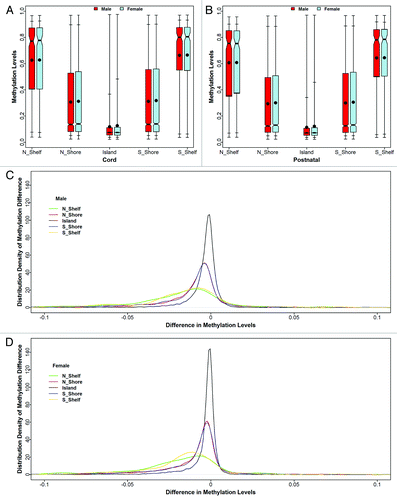
Figure 4. Distributions of mean methylation levels are presented at different locations of the gene structures at two time points. For each boxplot, the dot in the box represents the mean methylation level, and the horizontal bar in the box is the median methylation level. Two horizontal bars below the 25th percentile bar (the bottom side of the box) reflect the minimum and 5th percentile, respectively. Similarly, the top two bars above the 75th percentile bar (the top side of the box) reflect the 95th percentile and the maximum, respectively. The lower two panels are probability density plots of the mean methylation level changes (postnatal minus cord) for males and females, respectively.
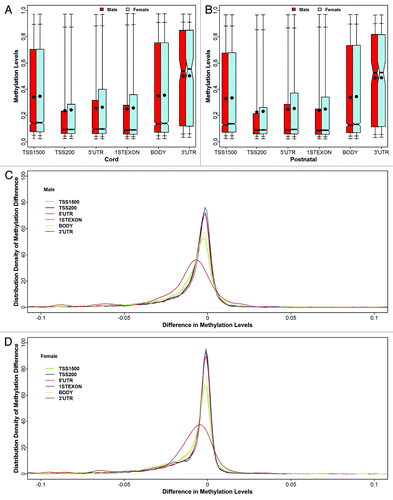
Mean methylation levels were comparable among TSS200 [left 200 bp from the transcription start sites (TSS)], 5′UTR, and 1stExon, but were higher in the other three locations including gene body, TSS1500 (left 1500 bp from the transcription start sites), and 3′UTR (). The probability densities of mean methylation levels were similar among TSS200, 5′UTR, and 1st Exon, and between TSS1500 and gene body, but they were quite different compared with the levels at 3′UTR (Fig. S10). Compared with TSS200, the distributions of mean methylation levels were significantly different from other gene structures for both cord and postnatal samples (all p < 0.0001) in males and females. Mean longitudinal changes were similar at TSS200, 5′UTR, and 1st Exon, but they shaped differently at 3′UTR (). Compared with that at TSS200, the distributions of mean methylation longitudinal changes were significantly different at all other gene structures (p < 0.0001) except 5′UTR for both genders.
Inter-individual variability of methylation levels was the smallest in the CpG islands and was significantly higher in other island groups (all p < 0.0001). This pattern was observed at each time point and in both genders (Fig. S11A, B and C). Inter-individual variability at TSS200 was similar to that at 5′UTR and in the 1stExon regions (p > 0.05), but was significantly lower than that at TSS1500, gene body and 3′UTR (all p < 0.0001). This observation was identified in both genders at each time point, and also was true across two time points (Fig. S11D, E and F). There was no gender difference for inter-individual variations at different CpG island groups or at different gene locations at each time point, except for at birth when males had a higher inter-individual variability at CpG islands than did females (p < 0.0001).
Among 98 common significant CpG sites identified through longitudinal analysis, 53% were not annotated on the known CpG islands, 9% were in the CpG islands, 2% were in the north shelf, 5% were in the south shelf, 13% were in the north shore and 18% were in the south shore. In terms of their locations within gene structures, 35% were in TSS1500, 13% in TSS200, 21% in gene body, 14% in 5′UTR, and 17% in 1stExon (Table S3). It appears that methylation levels at CpG shores and/or distant gene structures tend to experience more active methylation changes over time.
Discussion
This is the first and the largest epigenetic study to investigate genome-wide variation of DNA methylation levels and longitudinal changes from birth to the first two years of life in a prospective US birth cohort. This study contributes new information as discussed below.
Distribution and individual variability of DNA methylation levels
At single-nucleotide resolution on a genome-wide scale at birth and in the first two years of life, we demonstrated bimodal distributions for methylation levels of all CpG sites within each study sample. Our findings are consistent with previous reports.Citation36,Citation37 We also observed that a similar bimodal pattern is sustained across the structural features of the genes and the CpG islands, but undergoes a shifted distribution with regards to methylation levels: low methylation levels (e.g., < 0.2) is prominent in CpG islands and the 5′ region of the gene; while high methylation levels (e.g., > 0.8) is pronounced in distant regions from CpG islands and the gene body (Figs. S9 and S10). These patterns were similar across gender and across two time points. Our findings corroborated previous findings showing that DNA methylation distributions were different between non-CpG island regions and CpG islands, as was found in a UK epigenomic study of 12 fetal cord blood samples.Citation20 More importantly, we provided a comprehensive depiction of distributions for the detailed classification of CpG islands and gene structures in a large prospective US birth cohort.
We also observed that different CpG sites had different methylation distributions across the sample population, including skewed distributions in the majority and a small percentage of bimodal distributions. This fact suggests the importance of choosing appropriate analytical methods that consider the diversity of methylation distributions, for example, non-parametric tests (e.g., Wilcoxon Rank Sum test) represent better choices than parametric tests (e.g., t-test) for methylation data analysis.
In addition, we found that overall inter-individual methylation variations were small (Figs. S1 and S2). However, the variations of methylation levels had a large range and were different with regards to CpG islands groups ( and S9) and gene structures ( and S10): they were smallest in CpG islands, followed by shores and shelves; and they were smaller in nearby TSS regions (i.e., TSS200, 5′UTR, 1stExon) than in distant TSS regions (i.e., TSS1500, gene body, and 3′UTR). The largest methylation variation observed was at 3′UTR, however this finding should be interpreted with caution given that there were only a small number of probes covering this region (e.g., only 0.5% of the probes were located at 3′UTR). Still, we found that neither gender nor different time points had an influence on these variation patterns (Fig. S11). These findings suggest that the magnitude of inter-individual methylation variations observed for a given locus is associated with its biological function, i.e., the CpG islands under strongest functional constraint have the smallest inter-individual methylation variations. Similar conclusions apply to gene regions close to TSS vs. those further away from TSS. Consistent with a recent study on DNA methylation entropy,Citation38 our results indicated that methylation variation could be loci-specific and associated with the functional aspects of the corresponding genomic sequences. Higher inter-individual variations in the CpG shores and shelves and in TSS1500 indicated that these features were possibly more likely to be influenced by environmental factor exposure in utero and during early life, and thus could be strong candidates for disease differential methylation regions (DMR).Citation29
Longitudinal changes of methylation levels
We demonstrated that DNA methylation levels in general are also stable within the first two years of life, which is similar to a previous report in adults in which there was 8 to 11 y separating the sample collection.Citation3,Citation28 Our findings support the belief that epigenomes originate mainly in utero and then are maintained through mitotic inheritance. On the other hand, we did identify approximately 0.5% CpG sites with substantial meaningful changes in DNA methylation levels in the first two years of life using stringent criteria as described in the Statistical Analysis Methods section. Interestingly, these longitudinal changes were mainly located in the CpG and gene features with higher variability (e.g., TSS1500 or CpG shores). We speculate that early environmental factors such as breastfeeding, infection and immunization could contribute to dynamic epigenetic changes, which in turn affect individual risk for the development of disease. Data from our IPA indicate that many of the significant CpG sites are associated with genes that are known to be involved in the development and function of various systems including the immune system, which begins in utero and matures during the first few years of life.Citation39,Citation40
Our study has the following merits. We have presented the first genome-wide DNA methylation profiles at birth and within the first two years of life in a prospective US birth cohort. This study is also the first attempt to evaluate the longitudinal changes of DNA methylation levels within the first two years of life. To minimize technique variability, each pair of samples was placed on the same chip. The high correlations and high reproducibility (Fig. S12) of the duplicated samples, which were placed on different chips, indicate the high quality of the methylation data. Additionally, in the analytical phase we removed potential batch effects in the experiments using an empirical Bayes method implemented in program ComBat,Citation41 which in general outperforms the other five batch adjustment methods commonly used in gene expression studies.Citation42 We performed in-depth analysis by considering gender, two time points, CpG islands and gene structures. Finally, we ranked top probes/genes based on the combined criteria by not only considering the changes in methylation levels and methylation categories, but also the number of subjects within the category change. This method is especially useful to reduce false positive findings due to small variations in methylation data.
Limitations and Future Recommendations
When interpreting our findings, the following limitations need to be considered. We used Illumina HumanMethylation27 BeadChip for this longitudinal study. It is well known that the BeadChip has a limited coverage of the full range of genomic CpG sites, however it has high quantitative accuracy because of the high correlation coefficients between the Infinium assay and the GoldenGate and MethyLight assays (r2 > 0.8)Citation43 (www.illumina.com/support/literature.ilmn). A recent study used the HumanMethylation27 assay as a common reference to evaluate the accuracy of sequencing-based methods for methylation.Citation44 Consequently, the quantitative accuracy rather than the coverage of this assay may be more critical to the present study, which focuses on the variability of DNA methylation levels and longitudinal changes. Another limitation is that this study assessed DNA methylation levels in whole blood samples, which reflect a net result from a mixture of various types of blood cells. As such, the observed variations can be affected by the proportions of various cell types. The degree to which our observed patterns and variability can reflect DNA methylation in each specific type of blood cell remains to be determined. Nevertheless, DNA samples extracted from whole blood have been commonly used in methylation studies, including two longitudinal studies in adults conducted by Feinberg et al.Citation27,Citation28 Previous studies also have demonstrated that the cellular heterogeneity in leukocytes did not contribute to the variation of DNA methylation for the majority of the candidate loci.Citation45 Whether this is the case for a genome-wide scan needs to be investigated in the future. From a clinical and public health perspective, blood samples are the most easily accessible biospecimens, and the variability of genome-wide DNA methylation in peripheral blood, if linked to health and disease, should be of great value for disease diagnosis, prevention, and therapy. In addition, follow-up time of these 105 children (59 males and 46 females) varied from 6 mo to 2 y of age. The median follow-up is 10 mo for males and 11 mo for females. Due to sample size limitation, we were unable to further stratify by the follow-up length in the analyses since the estimates will be unstable. As such, we could not eliminate any possible influence of varied length of follow-up age on DNA methylation patterns. Finally, since the Illumina BeadChip does not provide a direct measure of DNA methylation, our findings need to be replicated in independent samples and validated by pyrosequencing. Validation using orthogonal techniques will provide meaningful biological interpretations if methylation findings and phenotypes are linked together.
Despite the limitations, our study represents the first step in understanding the patterns, variations, and longitudinal changes of the epigenome in early life, which may be relevant to health and disease in later life. The Boston Medical Center cohort is an ongoing birth cohort, and the continued follow-up of this cohort will enable us to distinguish the consistently stable CpG sites from the dynamic ones. With this knowledge, stable CpG sites could contribute to personalized epigenotypes and become the focus of future studies to identify the earliest biomarkers for complex diseases, while dynamic CpG sites could be considered environmentally inducible epigenetic markers and become the focus of future studies to understand the mechanisms underlying the associations between postnatal exposure and the development of disease.
Materials and Methods
Study subjects
The study samples are part of an ongoing birth cohort study in which mother-infant pairs are enrolled at Boston Medical Center at birth and infants are followed from birth onward. The initial recruitment and follow-up have been previously described.Citation46-Citation48 This report included 105 Black children (59 males and 46 females), who were singleton, full-term births and whose cord blood and venous blood were collected at birth and within the first 2 years of life, respectively. Written informed consents were obtained from all participants in this study. The study protocols have been approved by the Institutional Review Boards (IRBs) of Children’s Memorial Hospital in Chicago and the Boston University Medical Center.
Epigenetic mapping and quality control
Genomic DNA was extracted from whole blood leukocytes and quantified with SpectraMax M2 (www.moleculardevices.com). Genome-wide DNA methylation was assessed using Illumina HumanMethylation27 BeadChip at the Genomics Core Facility, Northwestern University. Each pair of study samples was placed on the same chip. We also included six duplicates, which were randomly selected from the 105 paired DNA samples. A β value signifying the percentage of methylation ranging from 0 to 1.0 was reported for each of the 27,578 probes from Illumina’s GenomeStudio. Sample-independent (e.g., hybridization and extension) and sample-dependent (e.g., bisulfite conversion and mismatch) control analyses illustrated the high quality of the microarray process and high performance of the samples, respectively. Pearson correlation coefficients for the six duplicates were > 0.99, and 99% of CpG sites had an absolute methylation-level difference of less than 0.05 between two duplicates (Fig. S12). All of the samples had greater than 98% CpG call rates (i.e., > 27,000 probes).
Statistical analyses method
The 105 paired samples were hybridized on 18 chips. To eliminate potential batch effect, an empirical Bayes methodology implemented in ComBat softwareCitation41 was applied to all data from each of the different chips to effectively remove batch effects in the experiment.Citation42,Citation49 Analysis of variance (ANOVA) was conducted to evaluate the batch effects for normalized β values and showed that about 96% of CpG sites had significant batch effects before normalization, but this proportion dropped to 0.12% after normalization using ComBat. All of the analyses were based on methylation levels after performing ComBat and were stratified by gender due to potential gender differences in DNA methylation.Citation6,Citation50
We first assessed the overall distributions of methylation levels across all 105 samples and within each sample. The DIP testCitation51 was used to identify bimodal distributions across samples. We used a graphic interpolation method to identify appropriate significant cut-off values for DIP statistics specific to a sample size (Fig. S13). The cut-off value for the DIP statistics at a sample size of n = 105 (combined samples) was 0.051, and was 0.074 for n = 59 (males) and 0.076 for n = 46 (females). Kurtosis (K) and skewness (S) parameters were used to classify unimodal methylation distributions in the sample population. Specifically, a normal distribution had -0.03 ≤ S ≤ 0.03 and -0.05 ≤ K ≤ 0.05 (K was estimated using the moment method and subtract 3); a negative skewed distribution had S < -0.03; a positive skewed distribution had S > 0.03; a platykurtic distribution had -0.03 ≤ S ≤ 0.03 and K < -0.05; and a leptokurtic distribution had -0.03 ≤ S ≤ 0.03 and K > 0.05. We used 0.03 and 0.05 as cutoff values of skewness and kurtosis instead of their theoretic values to consider the small sample variability of estimation.
Second, we investigated distributions and variations of methylation levels for different CpG island groups (i.e., CpG islands, CpG shores and CpG shelves) and gene structures (i.e., transcription start sites 200 (TSS200), TSS1500, 5′UTR, gene body, and 3′UTR) defined by Illumina at each time point for males and females, separately. The Kolmogorov-Smirnov testCitation52 was utilized to compare empirical distributions of methylation levels between different CpG island groups and gene structures. Median absolute deviation (MAD) was calculated to measure inter-individual variations of methylation levels, and the Wilcoxon Rank Sum test was used to compare MAD shift between different groups (e.g., between different CpG island groups) and to compare differences in proportions of CpG sites and methylation level changes between male and female samples at each time point.
Finally, we investigated longitudinal changes in methylation levels within the first two years of life and conducted pathway analysis using Ingenuity Pathway Analysis (IPA), as described below. We used the Wilcoxon Signed-Rank test to compare methylation changes for all CpG sites over two time points, and to compare differences of proportions of CpG sites for each methylation level category over time for each gender. A three-component normal mixture modelCitation53,Citation54 was applied to classify CpG sites into different methylation categories (i.e., hypo, intermediate or hyper) (Fig. S14). This approach is less arbitrary compared with that used in previous studies, which defined hypo-methylation or hyper-methylation using a cutoff of 20% or 80%.Citation36,Citation55 The Stuart-MaxewellCitation56,Citation57 test was used to test methylation categorical status changes over time. We selected CpG sites with significant longitudinal changes by merging results derived from the Wilcoxon Signed-Rank test and Stuart-Maxewell test. The combined results were sorted ascendingly by two FDR adjusted p-values, and then were sorted descendingly by both absolute changes in methylation levels and total number of discordant pairs (i.e., the number of subjects with discordant methylation categories). For each gender group, we included CpG sites for the network analyses by IPA only when the following criteria were met: methylation level changes greater than 0.1 in β values and multiple comparison corrected p values less than 0.05; and methylation categorical status changes in at least half of the samples. The Benjamini and Hochberg false discovery rateCitation58 was used to adjust p values for multiple testing. A sample size of 46 has 91% power to detect an effect size of 0.8 for an individual CpG site assuming the standard deviation is 0.1 (i.e., the difference is 0.08). We also assume that 150 CpG sites among 27K probes are truly significantly different over time, and the false discovery rate is controlled to be 5% for the power analysis. Thus, we had appropriate power to detect methylation difference of 0.1, which was used as one criterion for selecting CpG sites for IPA analysis.
Network analyses
The CpG sites to be included in the IPA were annotated to the corresponding UCSC genes. For these selected genes, we conducted network analyses using IPA (www.ingenuity.com/index.html). Networks were generated based on ‘seeds’ (i.e., network eligible molecules), which are encoded by the selected genes and also interact with other molecules in the Ingenuity Pathways Knowledge Base. A high score for a network indicates a more approximate fit between network eligible molecules and the molecules that constitute the network. For the top-ranked network, IPA also identified their top biological functions.
| Abbreviations: | ||
| DIP | = | a name of statistical test to identify bimodal distribution |
| TSS | = | the transcription start sites |
| MAD | = | median absolute deviation |
| CpG | = | genomic regions that contain a high frequency of CpG sites |
| IPA | = | ingenuity pathway analysis |
| DMR | = | differential methylation regions |
Additional material
Download Zip (12 MB)Acknowledgments
The parent study is supported in part by the March of Dimes PERI grants (PI: Wang, 20-FY02–56), the NIEHS (PI: Wang, R21 ES011666), and the NICHD (PI: Wang, R01 HD041702). The study is supported in part by the Food Allergy Initiative, the March of Dimes Birth Defects Foundation (PI: Tsai, 21-FY07-605) the NIAID (PI: Wang, R21AI079872; R21AI088609; U01AI090727), and the NICHD (PI: Wang, R21HD066471). This study also is supported in part by the Department of Defense (PI: Wang, W81XWH-10–1-0123). Dr. Liu is supported by the NIAID (PI: Liu, R21AI087888). None of the authors have a conflict of interest pertaining to this work.
Disclosure of Potential Conflicts of Interest
No potential conflicts of interest were disclosed.
Author Contributions
Designed the study and provided direction: XW XL DW. Conducted data analyses and interpretation of results: DW XL HX YZ XW. Performed the lab analysis: XH GW RL. Draft and revision of the manuscript: DW XL HX HJT XH GW RL XW. Provided financial support: XW XL HJT.
Related Research Data
References
- Tost J. DNA Methylation: An introduction to the Biology and the Disease-Associated Changes of a Promising Biomarker. Humana Press, 2008:3-20.
- Edwards TM, Myers JP. Environmental exposures and gene regulation in disease etiology. Environ Health Perspect 2007; 115:1264 - 70; http://dx.doi.org/10.1289/ehp.9951; PMID: 17805414
- Feinberg AP. Epigenetics at the epicenter of modern medicine. JAMA 2008; 299:1345 - 50; http://dx.doi.org/10.1001/jama.299.11.1345; PMID: 18349095
- Boks MP, Derks EM, Weisenberger DJ, Strengman E, Janson E, Sommer IE, et al. The relationship of DNA methylation with age, gender and genotype in twins and healthy controls. PLoS One 2009; 4:e6767; http://dx.doi.org/10.1371/journal.pone.0006767; PMID: 19774229
- El-Maarri O, Becker T, Junen J, Manzoor SS, Diaz-Lacava A, Schwaab R, et al. Gender specific differences in levels of DNA methylation at selected loci from human total blood: a tendency toward higher methylation levels in males. Hum Genet 2007; 122:505 - 14; http://dx.doi.org/10.1007/s00439-007-0430-3; PMID: 17851693
- Liu J, Morgan M, Hutchison K, Calhoun VD. A study of the influence of sex on genome wide methylation. PLoS One 2010; 5:e10028; http://dx.doi.org/10.1371/journal.pone.0010028; PMID: 20386599
- Relton CL, Davey Smith G. Epigenetic epidemiology of common complex disease: prospects for prediction, prevention, and treatment. PLoS Med 2010; 7:e1000356; http://dx.doi.org/10.1371/journal.pmed.1000356; PMID: 21048988
- Zhang K, Deng M, Chen T, Waterman MS, Sun F. A dynamic programming algorithm for haplotype block partitioning. Proc Natl Acad Sci U S A 2002; 99:7335 - 9; http://dx.doi.org/10.1073/pnas.102186799; PMID: 12032283
- Bell CG, Teschendorff AE, Rakyan VK, Maxwell AP, Beck S, Savage DA. Genome-wide DNA methylation analysis for diabetic nephropathy in type 1 diabetes mellitus. BMC Med Genomics 2010; 3:33; http://dx.doi.org/10.1186/1755-8794-3-33; PMID: 20687937
- Campión J, Milagro FI, Goyenechea E, Martínez JA. TNF-alpha promoter methylation as a predictive biomarker for weight-loss response. Obesity (Silver Spring) 2009; 17:1293 - 7; PMID: 19584886
- Ling C, Groop L. Epigenetics: a molecular link between environmental factors and type 2 diabetes. Diabetes 2009; 58:2718 - 25; http://dx.doi.org/10.2337/db09-1003; PMID: 19940235
- Ordovás JM, Smith CE. Epigenetics and cardiovascular disease. Nat Rev Cardiol 2010; 7:510 - 9; http://dx.doi.org/10.1038/nrcardio.2010.104; PMID: 20603647
- Rodríguez-Paredes M, Esteller M. Cancer epigenetics reaches mainstream oncology. Nat Med 2011; 17:330 - 9; http://dx.doi.org/10.1038/nm.2305; PMID: 21386836
- North ML, Ellis AK. The role of epigenetics in the developmental origins of allergic disease. Ann Allergy Asthma Immunol 2011; 106:355 - 61, quiz 362; http://dx.doi.org/10.1016/j.anai.2011.02.008; PMID: 21530865
- Champagne FA, Curley JP. Epigenetic mechanisms mediating the long-term effects of maternal care on development. Neurosci Biobehav Rev 2009; 33:593 - 600; http://dx.doi.org/10.1016/j.neubiorev.2007.10.009; PMID: 18430469
- Ollikainen M, Smith KR, Joo EJ, Ng HK, Andronikos R, Novakovic B, et al. DNA methylation analysis of multiple tissues from newborn twins reveals both genetic and intrauterine components to variation in the human neonatal epigenome. Hum Mol Genet 2010; 19:4176 - 88; http://dx.doi.org/10.1093/hmg/ddq336; PMID: 20699328
- McGowan PO, Szyf M. The epigenetics of social adversity in early life: implications for mental health outcomes. Neurobiol Dis 2010; 39:66 - 72; http://dx.doi.org/10.1016/j.nbd.2009.12.026; PMID: 20053376
- Meaney MJ, Szyf M. Maternal care as a model for experience-dependent chromatin plasticity?. Trends Neurosci 2005; 28:456 - 63; http://dx.doi.org/10.1016/j.tins.2005.07.006; PMID: 16054244
- Fryer AA, Nafee TM, Ismail KM, Carroll WD, Emes RD, Farrell WE. LINE-1 DNA methylation is inversely correlated with cord plasma homocysteine in man: a preliminary study. Epigenetics 2009; 4:394 - 8; http://dx.doi.org/10.4161/epi.4.6.9766; PMID: 19755846
- Fryer AA, Emes RD, Ismail KM, Haworth KE, Mein C, Carroll WD, et al. Quantitative, high-resolution epigenetic profiling of CpG loci identifies associations with cord blood plasma homocysteine and birth weight in humans. Epigenetics 2011; 6:86 - 94; http://dx.doi.org/10.4161/epi.6.1.13392; PMID: 20864804
- Kile ML, Baccarelli A, Tarantini L, Hoffman E, Wright RO, Christiani DC. Correlation of global and gene-specific DNA methylation in maternal-infant pairs. PLoS One 2010; 5:e13730; http://dx.doi.org/10.1371/journal.pone.0013730; PMID: 21060777
- Schroeder JW, Conneely KN, Cubells JC, Kilaru V, Newport DJ, Knight BT, et al. Neonatal DNA methylation patterns associate with gestational age. Epigenetics 2011; 6:1498 - 504; http://dx.doi.org/10.4161/epi.6.12.18296; PMID: 22139580
- Adkins RM, Thomas F, Tylavsky FA, Krushkal J. Parental ages and levels of DNA methylation in the newborn are correlated. BMC Med Genet 2011; 12:47; http://dx.doi.org/10.1186/1471-2350-12-47; PMID: 21453505
- Einstein F, Thompson RF, Bhagat TD, Fazzari MJ, Verma A, Barzilai N, et al. Cytosine methylation dysregulation in neonates following intrauterine growth restriction. PLoS One 2010; 5:e8887; http://dx.doi.org/10.1371/journal.pone.0008887; PMID: 20126273
- Adkins RM, Krushkal J, Tylavsky FA, Thomas F. Racial differences in gene-specific DNA methylation levels are present at birth. Birth Defects Res A Clin Mol Teratol 2011; 91:728 - 36; http://dx.doi.org/10.1002/bdra.20770; PMID: 21308978
- Michels KB, Harris HR, Barault L. Birthweight, maternal weight trajectories and global DNA methylation of LINE-1 repetitive elements. PLoS One 2011; 6:e25254; http://dx.doi.org/10.1371/journal.pone.0025254; PMID: 21980406
- Bjornsson HT, Sigurdsson MI, Fallin MD, Irizarry RA, Aspelund T, Cui H, et al. Intra-individual change over time in DNA methylation with familial clustering. JAMA 2008; 299:2877 - 83; http://dx.doi.org/10.1001/jama.299.24.2877; PMID: 18577732
- Feinberg AP, Irizarry RA, Fradin D, Aryee MJ, Murakami P, Aspelund T, et al. Personalized epigenomic signatures that are stable over time and covary with body mass index. Sci Transl Med 2010; 2:49ra67; http://dx.doi.org/10.1126/scitranslmed.3001262; PMID: 20844285
- Bollati V, Schwartz J, Wright R, Litonjua A, Tarantini L, Suh H, et al. Decline in genomic DNA methylation through aging in a cohort of elderly subjects. Mech Ageing Dev 2009; 130:234 - 9; http://dx.doi.org/10.1016/j.mad.2008.12.003; PMID: 19150625
- Rauch TA, Wu X, Zhong X, Riggs AD, Pfeifer GP. A human B cell methylome at 100-base pair resolution. Proc Natl Acad Sci U S A 2009; 106:671 - 8; http://dx.doi.org/10.1073/pnas.0812399106; PMID: 19139413
- Byun HM, Siegmund KD, Pan F, Weisenberger DJ, Kanel G, Laird PW, et al. Epigenetic profiling of somatic tissues from human autopsy specimens identifies tissue- and individual-specific DNA methylation patterns. Hum Mol Genet 2009; 18:4808 - 17; http://dx.doi.org/10.1093/hmg/ddp445; PMID: 19776032
- Milani L, Lundmark A, Kiialainen A, Nordlund J, Flaegstad T, Forestier E, et al. DNA methylation for subtype classification and prediction of treatment outcome in patients with childhood acute lymphoblastic leukemia. Blood 2010; 115:1214 - 25; http://dx.doi.org/10.1182/blood-2009-04-214668; PMID: 19965625
- Bibikova MLJ, Le J, Barnes B, Saedinia-Melnyk S, Zhou L, Shen R, et al. Genome-wide DNA methylation profiling using Infinium® assay. Epigenomics 2009; 1:177 - 200; http://dx.doi.org/10.2217/epi.09.14; PMID: 22122642
- Irizarry RA, Ladd-Acosta C, Wen B, Wu Z, Montano C, Onyango P, et al. The human colon cancer methylome shows similar hypo- and hypermethylation at conserved tissue-specific CpG island shores. Nat Genet 2009; 41:178 - 86; http://dx.doi.org/10.1038/ng.298; PMID: 19151715
- Illumina. Data sheet: epigenetics. http://wwwilluminacom/documents/products/datasheets/datasheet_humanmethylation450pdf 2011.
- Zhang D, Cheng L, Badner JA, Chen C, Chen Q, Luo W, et al. Genetic control of individual differences in gene-specific methylation in human brain. Am J Hum Genet 2010; 86:411 - 9; http://dx.doi.org/10.1016/j.ajhg.2010.02.005; PMID: 20215007
- Chu T, Handley D, Bunce K, Surti U, Hogge WA, Peters DG. Structural and regulatory characterization of the placental epigenome at its maternal interface. PLoS One 2011; 6:e14723; http://dx.doi.org/10.1371/journal.pone.0014723; PMID: 21373191
- Xie H, Wang M, de Andrade A, Bonaldo MdeF, Galat V, Arndt K, et al. Genome-wide quantitative assessment of variation in DNA methylation patterns. Nucleic Acids Res 2011; 39:4099 - 108; http://dx.doi.org/10.1093/nar/gkr017; PMID: 21278160
- Teran R, Mitre E, Vaca M, Erazo S, Oviedo G, Hübner MP, et al. Immune system development during early childhood in tropical Latin America: evidence for the age-dependent down regulation of the innate immune response. Clin Immunol 2011; 138:299 - 310; http://dx.doi.org/10.1016/j.clim.2010.12.011; PMID: 21247809
- Zinkernagel RM. Maternal antibodies, childhood infections, and autoimmune diseases. N Engl J Med 2001; 345:1331 - 5; http://dx.doi.org/10.1056/NEJMra012493; PMID: 11794153
- Johnson WE, Li C, Rabinovic A. Adjusting batch effects in microarray expression data using empirical Bayes methods. Biostatistics 2007; 8:118 - 27; http://dx.doi.org/10.1093/biostatistics/kxj037; PMID: 16632515
- Chen C, Grennan K, Badner J, Zhang D, Gershon E, Jin L, et al. Removing batch effects in analysis of expression microarray data: an evaluation of six batch adjustment methods. PLoS One 2011; 6:e17238; http://dx.doi.org/10.1371/journal.pone.0017238; PMID: 21386892
- Weisenberger DJBD, Pan F, Berman BP, Laird PW. Comprehensive DNA Methylation Analysis on the Illumina Infinium Assay Platform. Illumina Application Note 2008.
- Bock C, Tomazou EM, Brinkman AB, Müller F, Simmer F, Gu H, et al. Quantitative comparison of genome-wide DNA methylation mapping technologies. Nat Biotechnol 2010; 28:1106 - 14; http://dx.doi.org/10.1038/nbt.1681; PMID: 20852634
- Talens RP, Boomsma DI, Tobi EW, Kremer D, Jukema JW, Willemsen G, et al. Variation, patterns, and temporal stability of DNA methylation: considerations for epigenetic epidemiology. FASEB J 2010; 24:3135 - 44; http://dx.doi.org/10.1096/fj.09-150490; PMID: 20385621
- Kumar R, Curtis LM, Khiani S, Moy J, Shalowitz MU, Sharp L, et al. A community-based study of tobacco smoke exposure among inner-city children with asthma in Chicago. J Allergy Clin Immunol 2008; 122:754 - 9, e1; http://dx.doi.org/10.1016/j.jaci.2008.08.006; PMID: 19014767
- Tsai HJ, Liu X, Mestan K, Yu Y, Zhang S, Fang Y, et al. Maternal cigarette smoking, metabolic gene polymorphisms, and preterm delivery: new insights on GxE interactions and pathogenic pathways. Hum Genet 2008; 123:359 - 69; http://dx.doi.org/10.1007/s00439-008-0485-9; PMID: 18320229
- Wang X, Zuckerman B, Pearson C, Kaufman G, Chen C, Wang G, et al. Maternal cigarette smoking, metabolic gene polymorphism, and infant birth weight. JAMA 2002; 287:195 - 202; http://dx.doi.org/10.1001/jama.287.2.195; PMID: 11779261
- Kitchen RR, Sabine VS, Sims AH, Macaskill EJ, Renshaw L, Thomas JS, et al. Correcting for intra-experiment variation in Illumina BeadChip data is necessary to generate robust gene-expression profiles. BMC Genomics 2010; 11:134; http://dx.doi.org/10.1186/1471-2164-11-134; PMID: 20181233
- Sarter B, Long TI, Tsong WH, Koh WP, Yu MC, Laird PW. Sex differential in methylation patterns of selected genes in Singapore Chinese. Hum Genet 2005; 117:402 - 3; http://dx.doi.org/10.1007/s00439-005-1317-9; PMID: 15928902
- Hartigan J, Hartigan PM. The Dip Test of Unimodality. Ann Stat 1985; 13:70 - 84; http://dx.doi.org/10.1214/aos/1176346577
- Kiefer J. Sample Analogues of the Kolmogorov-Smirnov and Cramer-von Mises Tests. Ann Math Stat 1959; 30:420 - 47; http://dx.doi.org/10.1214/aoms/1177706261
- Fraley C, Raftery AE. Model-based clustering, discriminant analysis, and density estimation. J Am Stat Assoc 2002; 97:611 - 31; http://dx.doi.org/10.1198/016214502760047131
- Fraley C, Raftery AE. MCLUST Version 3 for R: Normal Mixture Modeling and Model-Based Clustering. Technical Report no 504, Department of Statistics, University of Washington 2006, revised 2010.
- Eckhardt F, Lewin J, Cortese R, Rakyan VK, Attwood J, Burger M, et al. DNA methylation profiling of human chromosomes 6, 20 and 22. Nat Genet 2006; 38:1378 - 85; http://dx.doi.org/10.1038/ng1909; PMID: 17072317
- Stuart AA. A test for homogeneity of the marginal distributions in a two-way classification. Biometrika 1955; 42:412 - 6
- Maxwell AE. Comparing the classification of subjects by two independent judges. Br J Psychiatry 1970; 116:651 - 5; http://dx.doi.org/10.1192/bjp.116.535.651; PMID: 5452368
- Benjamini Y, Hochberg Y.. Controlling the false discovery rate: a practical and powerful approach to multiple testing. Journal of the Royal Statistical Society. 1995; 57:289 - 300