Abstract
Artificial induction of active DNA demethylation appears to be a possible and useful strategy in molecular biology research and therapy development. Dimethyl sulfoxide (DMSO) was shown to cause phenotypic changes in embryonic stem cells altering the genome-wide DNA methylation profiles. Here we report that DMSO increases global and gene-specific DNA hydroxymethylation levels in pre-osteoblastic MC3T3-E1 cells. After 1 day, DMSO increased the expression of genes involved in DNA hydroxymethylation (TET) and nucleotide excision repair (GADD45) and decreased the expression of genes related to DNA methylation (Dnmt1, Dnmt3b, Hells). Already 12 hours after seeding, before first replication, DMSO increased the expression of the pro-apoptotic gene Fas and of the early osteoblastic factor Dlx5, which proved to be Tet1 dependent. At this time an increase of 5-methyl-cytosine hydroxylation (5-hmC) with a concomitant loss of methyl-cytosines on Fas and Dlx5 promoters as well as an increase in global 5-hmC and loss in global DNA methylation was observed. Time course-staining of nuclei suggested euchromatic localization of DMSO induced 5-hmC. As consequence of induced Fas expression, caspase 3/7 and 8 activities were increased indicating apoptosis. After 5 days, the effect of DMSO on promoter- and global methylation as well as on gene expression of Fas and Dlx5 and on caspases activities was reduced or reversed indicating down-regulation of apoptosis. At this time, up regulation of genes important for matrix synthesis suggests that DMSO via hydroxymethylation of the Fas promoter initially stimulates apoptosis in a subpopulation of the heterogeneous MC3T3-E1 cell line, leaving a cell population of extra-cellular matrix producing osteoblasts.
DMSO is a strong inducer of DNA hydroxymethylation in pre-osteoblastic MC3T3-E1 cells
Introduction
Methylation of cytosine-guanine dinucleotides (CpGs) on DNA is an important epigenetic mechanism involved in the selective regulation of gene expression and in the stabilization of chromatin. Therewith it is implicated in cell and tissue development and pathogenesisCitation1-Citation3 such as cellular differentiation and cancer development, respectively. For example, it has been demonstrated that suppression of the pro-apoptotic gene Fas via promoter methylation is an essential mechanism for the generation of RAS transformed tumor cells.Citation4 Methylation of CpGs on DNA is achieved by DNA methyltransferases (DNMTs) whereby DNMT1 is associated with maintenance of global DNA methylation patterns and DNMT3a and DNMT3b are defined as de novo DNA methyltransferases.Citation5
Except a potential passive DNA demethylation during cell replication, for a long time CpG methylation markers were thought to be very stable. However, very recently groundbreaking insights have been published regarding the long-standing enigma of active DNA demethylation. In addition to findings of direct demethylation of cytosines,Citation6 conversion of 5-methyl-cytosine (5-mC) to 5-hydroxymethyl-cytosines (5-hmC) by members of the TET-hydroxylase gene family was shown to promote active DNA demethylation in mammalian cells through a process that requires the base excision repair pathway involving the GADD45 gene family.Citation7-Citation12 Further, it has been demonstrated that 5-hmC patterns are dynamically regulated during early embryonic differentiation and in mouse embryonic stem cells (ESC).Citation13 Tet1 is specifically expressed in murine ESC where it is required for stem cell maintenance by promoting the transcription of pluripotency factors.Citation14 These studies suggested for the first time a naturally occurring way for dynamic regulation of DNA methylation.
Dimethyl sulfoxide (DMSO) alters the epigenetic DNA methylation profile of mouse embryoid bodies causing phenotypic changes in embryonic stem cells by stimulation of Dnmt3aCitation15 and affect differentiation in several cell-lines.Citation16-Citation20 Furthermore, a direct and specific stimulatory effect of DMSO on the catalytic activity of has been demonstrated in vitro.Citation21 The effect of this epigenetic active compound on genes related to active DNA demethylation is unknown.
Osteoblasts, the bone forming cells, derive from mesenchymal stem cells.Citation22 Driven by transcription factors like Dlx5,Citation23-Citation27 initially the pre-osteoblastic MC3T3-E1 cell line expresses a phenotype which forms several cell layers and synthesizes huge amounts of collagen type I (COL1A1, COL2A2) containing extra cellular matrix,Citation28,Citation29 which mineralizes at late differentiation stages.Citation30-Citation32 Recently it was demonstrated that at late differentiation stages, DMSO enhances mineralization of the extra cellular matrix by the osteoblastic MC3T3-E1 cell line.Citation33
Using the MC3T3-E1 cell line we report the ability of DMSO to induce active DNA demethylation. We demonstrate that via CpG hydroxymethylation DMSO affects promoter methylation of Fas and Dlx5 as well as global methylation patterns. This has an impact on cell viability and, as suggested by genome wide mRNA expression analysis, this compound may induce matrix synthesis in MC3T3-E1 cells.
Results
DMSO simultaneously affects the mRNA expression of genes involved in active DNA demethylation and DNA methylation processes
qRT-PCR analyses have shown that DMSO, particularly after 1 d of treatment, strongly and dose dependently upregulated the mRNA expression of two members of the TET-oncogene family Tet1 (Tet oncogene 1) and Tet2 (Tet oncogene 2) while no regulation was found at day 5 (). Tet3, the third member of this family, was not regulated at day 1 but was significantly higher expressed at day 5 ().
Figure 1. Effect of DMSO on the mRNA expression of genes involved in active DNA demethylation. After 1 d, DMSO strongly induced the expressions of Tet1 (A) and Tet2 (B) in a concentration dependent manner. Expression of Tet3 was not affected at this time (C). Concomitantly, for Gadd45b (D) and Gadd45 g (E) at 2% of DMSO and for Gadd45a (F) already at 1% DMSO in culture medium a significant upregulation was measured. After 5 d the effect was depleted or reduced except for Tet3 (C) and Gadd45a (F). At this time expression of Tet3 was significantly increased when compared with day 1. An even stronger effect was seen for Gadd45a expression after 5 d. To analyze mRNA expressions, RNA was isolated and analyzed by qRT-PCR. Gene expressions were normalized to 18S rRNA. Treated probes are referred as fold change to untreated control (Co). Results are represented as mean +/− SD *p < 0.05, **p < 0.01, *** or +++ p < 0.001, n = 3. Significances were calculated by one-way ANOVA (*) or by two-way ANOVA (+).
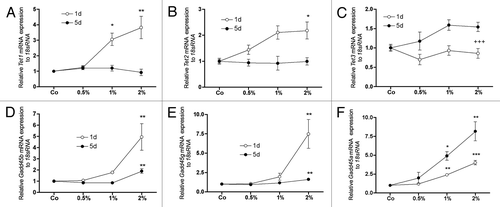
At both time points, DMSO significantly increased expression all members of the GADD45 (growth arrest and DNA-damage-inducible 45) family. While DMSO stimulated Gadd45b and Gadd45 g expression at day 1 () Gadd45a was higher expressed at day 5 compared with day 1 ().
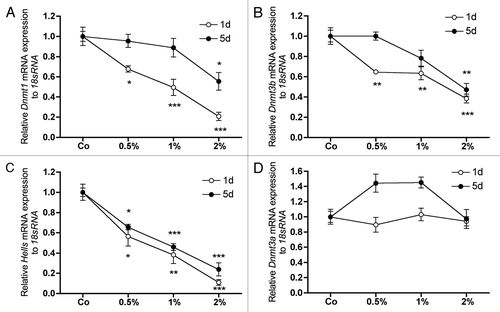
At the same time the mRNA expression of Dnmt1, Dnmt3b and Hells was downregulated in a concentration dependent manner (). At day 5, however, attenuation of the effect was observed for most of the listed genes (Figs. Two and 3). Interestingly, only a marginal regulation of the mRNA expression of Dnmt3a could be observed at any time analyzed ().
Figure 2. Effect of DMSO on the mRNA expression of genes involved in DNA methylation. mRNA expression of Dnmt1 (A), Dnmt3b (B) and Hells (C) showed a strong, DMSO-concentration dependent downregulation after 1 d of treatment. Also if the repression of Hells was after 5 d similar to day 1 (C), for all three genes a general alleviation was observed at this time (A-C). No significant effects could be measured for Dnmt3a expression at these times (D). To analyze mRNA expressions, RNA was isolated and analyzed by qRT-PCR. Gene expressions were normalized to 18S rRNA. Treated probes are referred as fold change to untreated control (Co). Results are represented as mean +/− SD *p < 0.05, **p < 0.01, ***p < 0.001, n = 3. Significances were calculated by one-way ANOVA.
Effects of DMSO on the mRNA expression of Fas and Dlx5
DNA methylation dependent regulation of the pro-apoptotic gene Fas in MC3T3-E1 has previously been shown.Citation34 Furthermore, Gadd45a dependent demethylation of the early osteoblastic differentiation factor Dlx5 has recently been demonstrated.Citation35 After 1 d of DMSO treatment, Fas expression was clearly dose-dependently upregulated. However, a significant inverse effect was observed after 5 d of treatment (). Further, after 1 d of DMSO treatment, we also observed a strong and concentration dependent upregulation of Dlx5 (). After 5 d this effect on Dlx5 expression by DMSO disappeared ().
Figure 3. The impact of DMSO treatment on the mRNA expression of Fas and Dlx5 in MC3T3-E1 cells. mRNA expression of the apoptosis inducer Fas was clearly and dose dependently upregulated after 1 d of treatment. After 5 d, the effect was reversed (A). The early osteoblastic differentiation factor Dlx5 was concentration dependently upregulated by DMSO after 1 d whereby significance was reached at 2% DMSO in medium. At day 5, expression of Dlx5 was generally unaffected by DMSO treatment. To analyze mRNA expressions, RNA was isolated and analyzed by qRT-PCR. Gene expressions were normalized to 18S rRNA. Treated probes are referred as fold change to untreated control (Co). Results are represented as mean +/− SD *p < 0.05 **p < 0.01, ***p < 0.001, n = 3. Significances were calculated by one-way ANOVA.

Time course of DMSO modulated gene expression
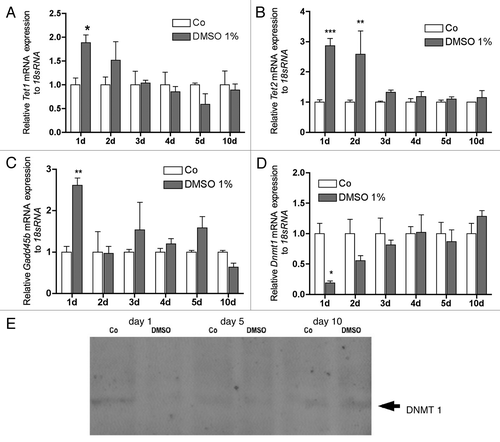
To narrow the timeframe of the expression of genes, which are suggested being involved in the active demethylation process, MC3T3-E1 cells were treated with 1% DMSO for 1, 2, 3, 3, 4, 5 and 10 d. Compared with controls, upregulation for Tet1 was significant on day 1 while on day 2 only a trend to stimulation was observed (). Tet2 was significantly upregulated on day one and two (). No regulation was found for Tet1 and Tet2 until day 10 (). Similarly, Gadd45b was strongly upregulated only at day 1, with no significant regulation during the following culture time (). For Dnmt1 a downregulation was found after 1 d of treatment to 18% while on day 2 only a trend to downregulation was observed. No regulation was seen until day 10 (). DNMT1 protein expression was confirmed by immunoblotting ().
Figure 4. Time course for DMSO regulated expression of genes involved in active DNA demethylation. Tet1 was significantly upregulated on day 1 while on day 2 the upregulation showed only a tendency. No regulation was found until day 10 (A). Tet2 was significantly upregulated on the first both days but no regulation was found until day 10 (B). On first day, Gadd45b was significantly upregulated (C), while Dnmt1 was significantly downregulated (D). No regulation was found during the further culture time. Downregulation of DNMT1 was also found at the protein level (E). To analyze mRNA expressions, RNA was isolated and analyzed by qRT-PCR. Gene expressions were normalized to 18S rRNA. Treated probes are referred as fold change to untreated control (Co). Results are represented as mean +/− SD *p < 0.05, **p < 0.01, ***p < 0.001, n = 3. Significances were calculated by two-way ANOVA and Bonferroni post hoc test.
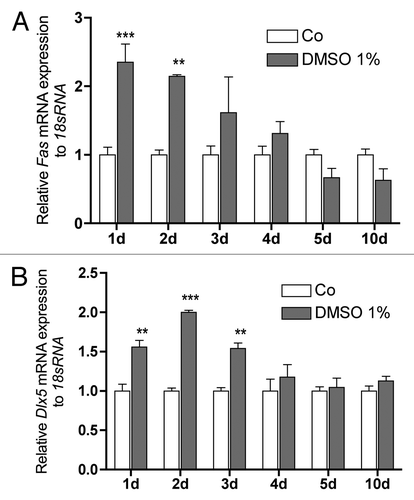
The pro-apoptotic gene Fas () and the early osteoblastic differentiation factor Dlx5 () were significantly upregulated during the first 3 d, however, while Dlx5 was still significantly increased on day 3, Fas lost significance at that time point. Both genes showed no difference in expression until day 10 ().
Figure 5. Time course for DMSO regulated expression of the proapoptotic Fas and the early osteoblastic cells transcription factor Dlx5. Both genes were significantly upregulated on the first both days. While on day 3 Dlx5 (B) was still significantly upregulated Fas (A) showed only a tendency. No regulation was found during the further culture time. To analyze mRNA expressions, RNA was isolated and analyzed by qRT-PCR. Gene expressions were normalized to 18S rRNA. Treated probes are referred as fold change to untreated control (Co). Results are represented as mean +/− SD **p < 0.01, ***p < 0.001, n = 3. Significances were calculated by two-way ANOVA and Bonferroni post hoc test.
Decreased promoter CpG methylation of Fas and Dlx5 is accompanied by increased DNA CpG hydroxymethylation after DMSO treatment
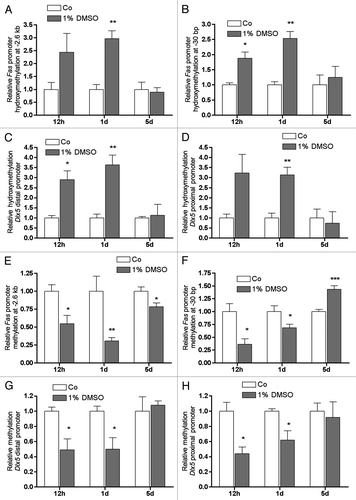
As Tet1 and Tet2 were upregulated and Dnmt1 expression was suppressed by DMSO, we examined DNA hydroxymethylation and DNA methylation on Fas and Dlx5 promoters after DMSO treatment. Already after 12 h of DMSO treatment, we measured a considerable increment of DNA 5-hydroxymethylation of CpGs of both Fas and Dlx5 promoters (, left bars). After 1 d, the effect increased slightly or remained in a comparable range as for the Dlx5 proximal promoter region (, middle bars). On day 5 no difference between treated and untreated cell were observed (, right bars). Inversely, to elevated hydroxymethylation, all fragments analyzed showed significantly decreased DNA methylation levels already after 12 h of DMSO treatment (, left bars). According to Fas and Dlx5 mRNA expressions (as shown in and , respectively), after 1 d of DMSO treatment all promoter-fragments analyzed showed still significant cytosine demethylation when compared with untreated control (, middle bars). A different methylation pattern was found after 5 d of DMSO-treatment: the Fas CpG island at -2.6 kb showed a slighter but still significant decrease in cytosine methylation by DMSO (), however, in correlation with Fas mRNA repression () at position -30 bp cytosine methylation was found to be significantly increased when compared with controls (, right bars). At this time no effect on cytosine methylation was measured for the Dlx5 promoter ().
Figure 6. In Fas as well as in Dlx5 promoters CpG hydroxymethylation and methylation were affected by DMSO treatment. Specific CpG hydroxymethylation (A-D) and CpG methylation (E-H) were measured in selected promoter regions of Fas and Dlx5 after treatment with 1% DMSO for the given periods. Already after 12 h of treatment, a strong increase in 5-hmC status and a concomitant decrease in CpG methylation was seen in both genes in all promoter fragments analyzed (A-H). After 1 d, the increase of 5-hmC status became significant for all fragments analyzed (A-D). Compared with 12 h, CpG demethylation decreased further in the CpG island of the Fas promoter at -2.6 kb from transcriptional start (E), remained unchanged in the Dlx5 distal promoter fragment (G) and slightly diminished in the Fas CpG island at -30 bp from the transcriptional start (F) and in the Dlx5 proximal promoter (H). After 5 d, the Fas promoter region at -2.6 kb still showed a significantly decreased CpG demethylation after DMSO treatment (E). However, the Fas promoter region at -30 bp even showed a highly significant increase in CpG methylation. No changes in CpG methylation status were observed for both Dlx5 promoter fragments after 5 d of treatment. Results are represented as mean +/− SD *p < 0.05, **p < 0.01, ***p < 0.001, for all n = 3, all significances were calculated by Student t-test.
DMSO increases global DNA hydroxymethylation and decreases global DNA methylation
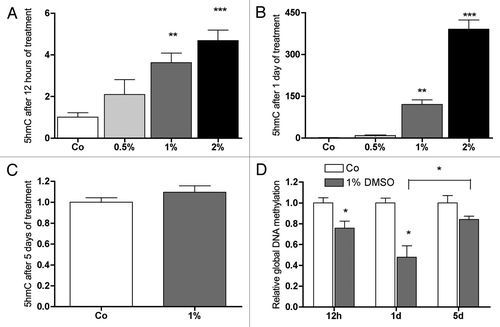
Hydroxymethylation was quantified with a multiwell plate reader by measuring fluorescence of 5-hmC-antibody stained preparations. As shown in , already after 12 h of treatment, DMSO significantly increased global DNA hydroxymethylation in a concentration dependent manner; after 1 d of treatment this effect was even more pronounced (), while on day 5 no significant difference was found (). As consequence of DNA hydroxymethylation, we evaluated if active DNA demethylation occurred by DMSO treatment. For this purpose, cells were synchronized by serum depletion and subsequently treated for 12 h with DMSO. Indeed, already after 12 h of DMSO treatment and thus before first cell replication starts, a significant global demethylation of DNA could be observed and this effect became more evident after 1 d of treatment (). Similar to Dnmt1 expression, the demethylating effect of DMSO was clearly attenuated after 5 d of treatment and significantly reduced when compared with day 1 ().
Figure 7. DMSO stimulates global 5-mC hydroxylation and decreases global DNA methylation in MC3T3-E1 cells. Already after 12 h, a concentration dependent increase in 5-hmC was seen reaching significance at 1% and 2% DMSO in culture medium (A). At the same time, at 1% DMSO, global DNA methylation decreased significantly (D). After 1 d, the effect on global hydroxylation of 5-mC as well as on global DNA methylation was stronger (B and D). After 5 d, when compared with control, at 1% DMSO in medium no significant effect on global DNA demethylation was measured. The recovery in global DNA methylation in the DMSO treated cells between day 1 and day 5 was significant (D). Results are represented as mean +/− SD *p < 0.05, **p < 0.01, ***p < 0.001. For (A and B) n = 6, for (C) n = 3. For (A and B) significances were calculated by one-way ANOVA, for (C) significances were assessed by Student t-test.
Nuclear localization of methyl-cytosine hydroxylation by DMSO in MC3T3-E1 cells
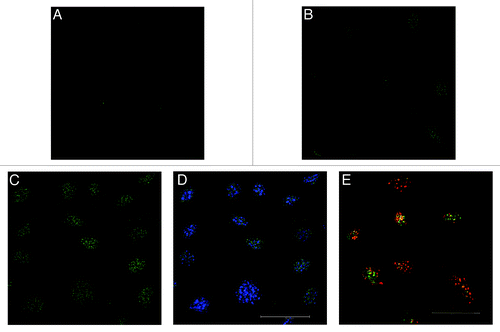
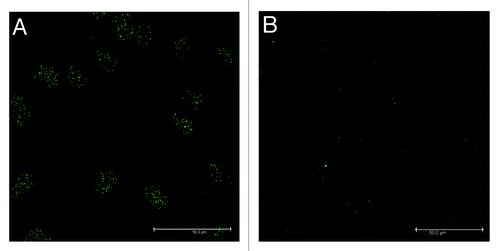
In , -hmC immunostaining after 12 h and 24 h of 1% DMSO treatment is shown. Compared with control (), already after 12 h of treatment signals of 5-hmC were observable () whereby the effect clearly increased after 1 d (). Co-staining with DAPI showed the localization of the nuclei and demonstrated the signals of 5-hmCs in the nuclei (). Nuclear staining with DAPI, a dye which preferentially labels heterochromatic regions on the chromosomes,Citation36,Citation37 revealed that most of the hydroxymethylated spots were found outside of these regions, suggesting that DMSO induced hydroxymethylation occurs primarily in the gene-rich euchromatic chromatin. Co-labeling of DMSO treated cells with antibodies against 5-hmC and 5-mC demonstrated areas where only 5-hmCs (green) or 5-mCs (red) were localized (). However, also double-labeled regions were found (yellow) suggesting the co-existence of both, modified and unmodified methyl-cytosines.
Figure 8. Nuclear localization of 5-hmC (green punctuation) after 1% DMSO treatment in MC3T3-E1 cells. The increase in 5-hmC was demonstrated and localized by immune-staining techniques. When compared with control (A), an increase in 5-hmC was already visible after 12 h of 1% DMSO treatment (B) and after 1 d (C) the effect was clearly more pronounced. Combined staining with DAPI demonstrated the signals of 5-hmCs in the nuclei and revealed that most of the hydroxymethylated spots were found outside of the heterochromatic regions (D). Co-labeling of DMSO treated cells with 5-mC (red spots) and 5-hmC (green spots) antibodies revealed areas where only 5-hmCs or 5-mCs are localized. However, also double-labeled regions were found (yellow spots, E). Scale bar for all images is 50 µm.
Tet1 and Tet2 are key players in DMSO dependent demethylation and upregulation of Fas and Dlx5
To assure the role of active DNA demethylation in DMSO induced Fas and Dlx5 upregulation, Tet1 and Tet2 mRNA expression was knocked-down by siRNA. In line with promoter methylation analysis (see ), already after 12 h of 1% DMSO treatment a significant upregulation of Fas mRNA expression could be detected. A similar increment was measured after 1 d of treatment. However, knockdown of Tet1 or Tet2 mRNA expression by siRNA abrogated the stimulatory effect at both times measured (). Similar effects were observed when Dlx5 mRNA expression was analyzed, although, stimulation of Dlx5 expression was significantly increased not until 1 d of treatment (). In , the efficacy of Tet1 and Tet2 knockdown by siRNA transfection after 1 d of 1% DMSO treatment is demonstrated. Finally, after 1 d of 1% DMSO exposure, the effect of Tet1 and Tet2 knockdown was also visible on global 5-hmC status. Repression of Tet1 and Tet2 provoked a great attenuation of global 5-hmC levels when compared with cells treated only with DMSO (). A diminution of 5-hmC labeled cells was also seen by immune-staining when 1% DMSO treated cells () were compared with 1% DMSO/Tet1-siRNA treated MC3T3-E1 cells (). When compared with untreated control cells (see ), the number of 5-hmC labeled cells was still higher in 1% DMSO/Tet1-siRNA treated cells.
Figure 9.Fas and Dlx5 expression and global 5-hmC status after Tet1 and Tet2 knock down by siRNA. mRNA expression of Fas (A) was already significantly increased after 12 h of 1% DMSO treatment whereby the Dlx5 expression (B) showed only a trend. After 1 d, 1% DMSO significantly increased the expressions of both genes. Upregulation of Fas (A) as well as of Dlx5 (B) mRNA expression by 1% DMSO was depleted at both times measured by siRNA knock down of Tet1 or Tet2 expression. Sole treatment of the cells with Tet1 or Tet2 siRNA had no effect on the expression of both genes. Efficiency of Tet1 mRNA depletion by Tet1 and Tet2 siRNA is shown in figure C and figure D, respectively. Effect of Tet1 or of Tet2 knock down was measurable on global 5-hmC level (E). When compared with 1% DMSO treated cells suppression of Tet1 or Tet2 expression clearly decreased 5-hmC levels (E). To analyze mRNA expressions, RNA was isolated and analyzed by qRT-PCR. Gene expressions were normalized to 18S rRNA. Treated probes are referred as fold change to untreated control (Co). Results are represented as mean +/− SD *or +, p < 0.05; ** or ++, p < 0.01; *** or +++, p < 0.001; n = 3. + refers to DMSO treated samples. Significances were calculated by Student t-test.
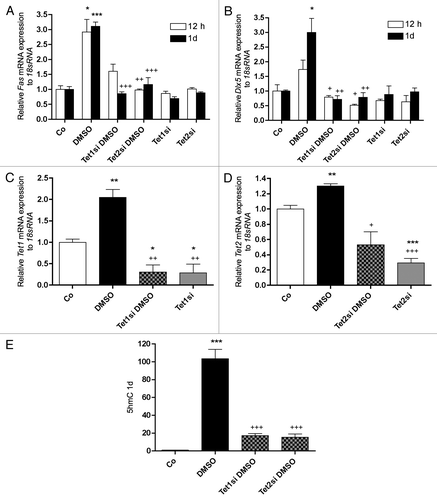
Figure 10. A diminution of 5-hmC labeled cells was also seen by immune-staining when 1% DMSO treated cells (A) were compared with 1% DMSO/Tet1-siRNA treated MC3T3-E1 cells (B). MC3T3-E1 cells were treated for 1 d either with 1% DMSO without or with Tet1 si-RNA. Thereafter cells were fixed and incubate with anti-5-hmC antibody, followed by incubation with a fluorescence labeled secondary antibody. Scale bar for all images is 50 µm.
DMSO affects cell multiplication and the activity of caspase 8 and caspase 3/7 in MC3T3-E1 pre-osteoblasts
As Fas expression was altered by DMSO, cell proliferation and caspase activities were measured. DMSO, dose () and time () dependently regulated cell multiplication of MC3T3-E1 cells. At the second day of treatment, at 0.5% DMSO in culture medium, cell multiplication was increased significantly whereby at 2% a significant attenuation was observed (). Cell multiplication was more pronounced after 5 d of treatment and significantly decreased by both 1% and 2% of DMSO ().
Figure 11. Effect of DMSO on cell multiplication and caspases 3/7 and caspase 8 activities after DMSO treatment. After 2 d of treatment with 0.5% DMSO in medium, cell multiplication was slightly but significantly increased while at 2% DMSO a significant decrease in cell multiplication was measured (A). Cell multiplication was significantly attenuated after 5 d of treatment for both 1% and 2% of DMSO in medium (B). After 1 d, caspase 3/7 (C) as well as caspase 8 (D) activities were significantly upregulated at 1% as well as at 2% DMSO in culture medium when compared with untreated control (Co). After 5 d treatment the activity of caspase 8 did not change significantly (F). Caspases 3/7 were still increased at 2% DMSO while at 1% no significant difference was found (E) when compared with untreated control (Co). Relative cell multiplication is expressed as µg DNA/well. Caspases activities were measured by substrate cleavage and the generated luminescent signal was captured with a luminometer. Bars represent mean +/− SD *p < 0.05, **p < 0.01, ***p < 0.001. For (A and B) n = 8, for all other graphs n = 5. Significances were calculated by one-way ANOVA.
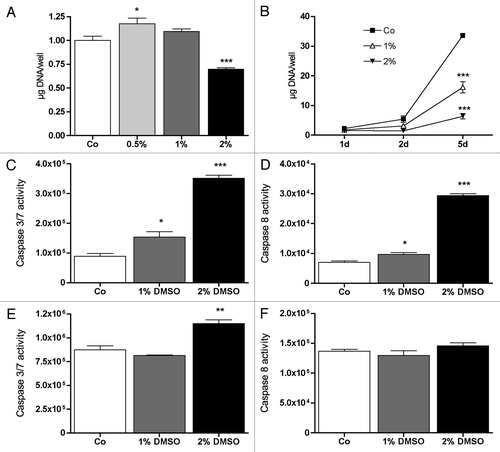
FAS directly activates caspase 8 and indirectly caspase 3 and 7.Citation38,Citation39 To verify the role of apoptosis in DMSO dependent attenuation of cell multiplication, caspase 8 and caspase 3/7 activities were measured after 1 d and after 5 d of DMSO treatment. In line with Fas expression (), after 1 d both DMSO concentrations significantly increased caspase 3/7 () and caspase 8 () activities when compared with untreated controls. Furthermore, after 5 d of treatment the DMSO effect was clearly attenuated (). Only at 2% DMSO in the culture medium a slight but significant increase of caspase 3/7 activity was still measured ().
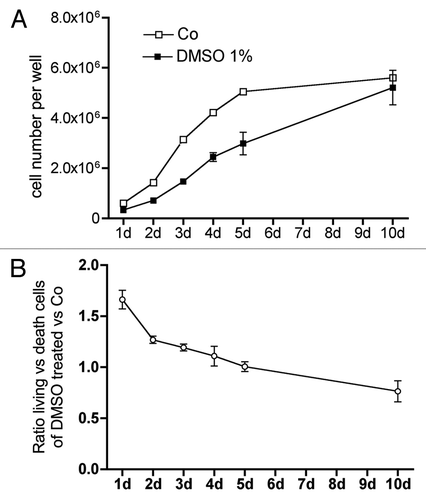
shows the time course of cell multiplication during 10 d of culture () and compares the ratio between living and dead cells (). At the beginning of the culture, the difference in cell number increases indicating increased apoptosis in DMSO treated cells; the higher ratio of dead to living cells () on culture start supports this assumption. With culture time, the difference between untreated and DMSO treated cells increased until day 5. Then the differenced disappeared and the ratio of dead cells to living cells went below 1 in DMSO treated cells, which indicates a higher survival/dead rate after 10 d in the treated cells when compared with control cells. This results support the findings of Fas expression and caspase activities ( and ).
Figure 12. DMSO significantly attenuated cell multiplication of MC3T3-E1 cells and changed the ratio of living vs. dead cells. Cells were treated for 1 to 10 d with 1% DMSO. At the respective time point cells were liberated by pronase treatment and an aliquot was counted (A). The ratio between living and dead cells changed with culture time (B). Except on day 1 and 10 the differences between untreated and DMSO treated cells were significantly different.
DMSO stimulates the expression of genes involved in ECM synthesis
Dlx5 is expressed at early stages during osteoblastic differentiation where ECM synthesis is induced. As shown in gene array data analysis shows that DMSO upregulated the mRNA expression of both genes collagen type I, Col1a1 and Col1a2, after five days of treatment. Furthermore, Col5a1 and Col5a2 were considerably expressed and strongly upregulated by DMSO at both days measured. Of the enzymes involved in post-translational collagen modifications, two of three known lysyl hydroxylases were expressed and upregulated by DMSO, especially Plod2 (procollagen lysine, 2-oxoglutarate 5-dioxygenase 2), which had been demonstrated to be essential in bone collagen fibril formation.Citation40 The gene coding for Lox, a protein, which cross-links extracellularly the collagen I chains, is highly expressed and also upregulated by DMSO (). Furthermore, Mmp13, the most important osteoblastic metalloproteinase was upregulated at day 1 and strongly downregulated at day 5.
Table 1. Expression of genes involved in osteoblastic extra-cellular matrix synthesis by genome wide expression analysis
Discussion
DMSO, a polar aprotic solvent widely used in biological and medical applications, was found to regulate epigenetic mechanisms altering CpG methylation patterns in diverse cells and tissuesCitation15,Citation41,Citation42 thus having an impact on their development and differentiation.Citation17 Here, we show that in pre-osteoblastic MC3T3-E1 cells DMSO significantly affects the expression of genes related to DNA hydroxymethylation and DNA methylation. This has consequences on the expression of Fas and Dlx5.
Expression of TET and GADD45 gene family members were significantly upregulated and genes involved in DNA methylation were significantly downregulated after 1 d of treatment with 1% DMSO. Furthermore, at this time the expression of the pro-apoptotic gene Fas and of the early osteoblastic differentiation factor Dlx5 was also increased by DMSO treatment. It has been demonstrated that epigenetic regulation of Fas expression via DNA methylation plays an important role in tumor developmentCitation43-Citation46 as well as in avoiding anoikis of osteoblasts.Citation34 In regard to regulation of Dlx5 expression, Gadd45a dependent active demethylation has recently been demonstrated.Citation35
Recently, an active DNA-demethylation process has been shown by oxidative modification of 5-mCs to 5-hmCs by members of the TET gene family with further involvement of the GADD45 gene family, which is responsible for nucleotide and base excision repair (for a review see refs. Citation1,Citation10,Citation47-Citation49). This mechanism was suggested for active DNA demethylation in Xenopus laevis oocytesCitation7 and in embryos of zebrafish.Citation8 In adult neuronal tissue (cortex, hippocampus) activation and demethylation of promoters of specific neuronal genes with concomitant upregulation of Gadd45b and Gadd45c has been demonstrated.Citation50
Promoter DNA methylation is achieved by DNMTs, a highly conserved gene family. Dnmt1 is related to maintenance of CpG methylation patterns during mitosis while Dnmt3a and Dnmt3b play a role in de novo DNA-methylation.Citation51 HELLS was shown to act as DNA methylation supporter by recruiting DNMT1 and DNMT3B to promoters.Citation52 Moreover, Hells has been shown to play an essential role in bone development.Citation53 Downregulation of these proteins results in passive DNA-demethylation leading to activation of gene transcription. DMSO strongly downregulated the expression of Dnmt1, Dnmt3b, and Hells after one day of treatment. Therefore, passive DNA demethylation of Fas and Dlx5 promoters is feasible. However, after seeding, MC3T3-E1 cells need at least 24–30 h for doubling and Fas as well as Dlx5 expression were already increased 12 h after seeding with concomitant DMSO treatment. Thus the data suggested an alternative mechanism for Fas and Dlx5 upregulation. Indeed, already after 12 h of treatment increased 5-hmC and decreased in 5-mC levels were measured on both, Fas and Dlx5 promoters and global 5-hmC levels were also significantly increased at this time suggesting active DNA demethylation. Furthermore, cell synchronization by serum depletion confirmed loss of DNA methylation by DMSO treatment before first cell replication cycle. A further argument for active DNA demethylation is that by DMSO induced global hydroxymethylation and Fas and Dlx5 upregulation could be prevented by Tet1-siRNA or Tet2-siRNA knockdown proving Tet1 and Tet2 involvement in this process. In our experiments, downregulation of either Tet1 or Tet2 was sufficient to attenuate upregulated Dlx5 and Fas and to prevent global hydroxymethylation. This suggests that in this case both gene products are a prerequisite for the demethylation process. This is in contrast to recent reports, which have been performed in embryonic stem cells that have demonstrated rather an additive effect of both genes on 5-hmC formations.Citation54 However, in myeloid malignancies it has been demonstrated that despite an expression of wild type TET1 and TET3, an inactivating mutation of TET2 is sufficient to block active demethylation and thus to induce these diseases.Citation55-Citation57 This suggests that TET1 or TET3 cannot replace the function of TET2.
In embryonic stem cells TET1 protein and 5-hmCs are enriched at regions with high density of CpGs around the TSSsCitation54,Citation58,Citation59 and requirement of Tet1 for active DNA demethylation in the adult mouse brain in vivo has been reported recently. There, after deamination of 5-hmC by the Aicda (AID, activation-induced deaminase)/Apobec (apolipoprotein B mRNA-editing enzyme complex) gene family, 5hmUs are removed by base excision repair by Smug1 (single-strand-selective monofunctional uracil-DNA glycosylase 1) and Tdg (thymine-DNA glycosylase).Citation60 However, as found by genome wide expression analysis, in MC3T3-E1 cells these genes were either only weakly expressed or were downregulated by DMSO (Table S1), in contrast to genes of the GADD45-family. Additionally, most members of the ERCC-family (excision repair cross-complementing rodent repair deficiency, complementation group), especially Ercc3, Ercc4 and Ercc5 (Xpg), were expressed and upregulated by DMSO (Table S1). These data suggest that instead of base excision repair, nucleotide excision repair is possibly responsible for continuing demethylation after hydroxymethylation in DMSO treated MC3T3-E1 cells.
In a very recent study, it has been shown that during osteoblastic differentiation of adipose-derived mesenchymal stem cells, GADD45A was upregulated and responsible for active demethylation of osteogenic genes with support of members of the ERCC gene family via nucleotide excision repair.Citation35 Here we show that expression of Gadd45a was continuously upregulated during culture time and stimulated by DMSO suggesting that a comparable demethylation process could occur driving further differentiation. Because this demethylation process proceeds via excision of methylated nucleotides (ERCC-driven), no hydroxymethylation will be found. Both genes are discussed for their role in nucleotide excision repair, the former by an ERCC-family mediated process, the latter by a TET-family mediated oxidative demethylation.Citation35,Citation47
However, DMSO also upregulated Gadd45b already at day one, but downregulated on day 5. This can be explained by the fact that respective cells have already undergone apoptosis as a consequence of promoter demethylation in the first 2 d of incubation.
Taken together, these findings suggest that DMSO, after Tet1 and/or Tet2 induced hydroxymethylation, finalizes active demethylation of Fas and Dlx5 promoters by nucleotide excision repair involving GADD45B. A second process of active demethylation for osteoblastic cells differentiation runs in parallel via ERCC-family and GADD45A.
In line with a very recent reportCitation13 we show that 5-hmCs were found solely in euchromatic regions of the chromatin suggesting that hydroxymethylation occurs mainly in euchromatin for the purpose of gene activation as shown for Dlx5 and Fas. Moreover, these findings indicate that either hydroxymethylation is specific for euchromatin or at least that DMSO regulates demethylation solely in transcribed chromatic areas. It has to be taken into account that 5-hmC levels were assessed by immune-staining techniques and the considerable difference measured between DMSO treated and control cells may be overestimated by the almost total absence of 5-hmCs labels in untreated cells.
The effect of DMSO on the expression of Fas provoked attenuation of cell multiplication and induction of apoptosis as shown by the initially increased caspases 3/7 and caspase 8 activities. In parallel DMSO upregulated the early osteoblastic transcription factor Dlx5 suggesting stimulation of the early osteoblastic differentiation stage.Citation23-Citation27 In vivo, osteoblasts differentiate either to bone lining cells or to osteocytes; about two-thirds undergo apoptosis.Citation61 After 5 d of DMSO treatment Fas was downregulated and the effect on Dlx5 expression disappeared. However, at this time genes involved in synthesis of extra cellular matrix like Col1a1, Lox or Plod2 were upregulated. The heterogeneity of the pre-osteoblastic MC3T3-E1 cell line was previously shown.Citation32,Citation62 Considering these data, we interpret that DMSO initially induces a sub-population of MC3T3-E1 to apoptose. The surviving cells, possibly triggered by Dlx5, express genes related ECM synthesis that would generate greater amounts of collagenous ECM, which by a feedback mechanism supports osteoblastic survivalCitation34 and constitutes the basis for an appropriate ECM mineralization. This suggestion fits with the recently published work by Stephens et al.,Citation33 where it was demonstrated that after long time exposure to DMSO (15 d), mineralization substantially increases in MC3T3-E1 cells. Interestingly, for this increased mineralization process, DMSO treatments during the first three days were crucial and sufficient, then the cultures lose their DMSO sensitivity (between day 3 and 6).Citation33 This unambiguously indicates that during the first culture period, future development of the cells is determined. Here we demonstrate that for this early culture period, the DMSO induced demethylation is limited in time. Timely coincidence strongly suggests that this DMSO induced demethylation is the trigger for the latter found increased mineralization of the culture, likely by increased collagen synthesis. Increased collagen synthesis could also be responsible for the convergence of the cell multiplication at day 10 and downregulation of Fas. ECM increases Cyclin A2 (Ccna2) expression and downregulates Fas by epigenetic promoter methylationCitation34 and takes over the regulation for the further differentiation of osteoblasts.Citation63 Reduced apoptosis and increased cell proliferation is also suggested by the decrease in the dead/live ratio at day 10.
As already mentioned above, on day 5 an increased methylation of Fas was found. This was found in parallel to a DMSO induced, although insignificant upregulation of Dnmt3a. This gene is obligatory for proper methylation during hematopoiesisCitation64 und has been found upregulated by DMSO in mouse embryoid body.Citation15 Furthermore, an enzymatic stimulation of Dnmt3a at higher concentrations was found in an in-vitro assay.Citation21 One might speculate that an upregulation of Dnmt3a or a stimulation of the enzymatic activity could be responsible for Fas de novo methylation.
Furthermore, as Tet1 was shown to be required for ESC cell maintenance,Citation14 here it may be responsible for the presumed retention of an early ECM producing osteoblastic phenotype via Dlx5 by DMSO. However, a novel feature of this study is provided from data indicating that apoptosis can be regulated by active DNA demethylation, thus revealing a new approach for the understanding of cell death regulation. The role of DNA hydroxymethylation in osteoblastic differentiation has still to be elucidated.
In summary, the results presented assign new aspects to DMSO as epigenetic active drug. We show for the first time a chemical compound capable to induce methyl-cytosine hydroxylation, which results in active demethylation of Fas and Dlx5 promoters. This offers a role for DMSO as source for the development of compounds able to induce specific active demethylation of promoters, as in the past for the development of defined histone deacetylase inhibitors.Citation17 This could gain clinical importance for the therapy of diseases or/and for tumor treatment and help to understand physiological and pathophysiological mechanisms.
Materials and Methods
Cell Culture
MC3T3-E1 cells, a clonal pre-osteoblastic cell line derived from newborn mouse calvaria (kindly donated by Dr. Kumegawa, Meikai University, Department of Oral Anatomy), were cultured in humidified air under 5% CO2 at 37°C in α-minimum essential medium (α-MEM; Biochrom) supplemented with 5% fetal calf serum (Biochrom), 50 μg/mL ascorbic acid (Sigma), and 10 μg/mL gentamycin (Sigma). For propagation, cells were subcultured twice a week using 0.001% pronase E (Roche) and 0.02% EDTA in Ca2+- and Mg2+-free phosphate-buffered saline (PBS) before achieving confluence. To prevent a potential phenotypic drift during repeated sub-cultures the cells were not used more than 4 weeks after thawing.
For experiments, the cells were seeded in culture dishes at a density of 5,000/cm2 and cultured for 12 h, 1, 2 and 5 d untreated as controls or in the presence of 0.5%, 1% or 2% of DMSO in culture medium. Cell synchronization was performed by serum starvation for 24 h. All cell experiments were performed in time-independent triplicates, data are shown as mean of the three experiments.
Isolation of nucleic acids and expression analysis by qRT-PCR
DNA and RNA were extracted using a DNA/RNA Isolation Kit (Qiagen) following manufacturer’s instructions. cDNA was synthesized from 0.5 µg RNA using the 1st Strand cDNA Synthesis Kit (Roche) as described by the supplier. The obtained cDNA was subjected to PCR amplification with a real-time cycler using FastStart SYBR-Green Master Mix (Roche) for the genes Dlx5, Fas, Tet1, Tet2, Tet3, Gadd45a, Gadd45b, Gadd45 g, Dnmt1, Dnmt3a, Dnmt3b and Hells (primers are shown in ). The qRT-PCR was performed with 45 cycles composed of 30 sec denaturation at 95°C, 30 sec annealing at the indicated temperature () and 30 sec extension at 72°C after 10 min of initial denaturation at 95°C. For normalization of the expression we used the 18S RNA TaqMan probe (4319413E, Applied Biosystems). Expression was quantified using the comparative quantization method.Citation65
Table 2. Primers for qRT-PCR Sybr Green assays (A) and primers for the assessment of the Fas and Dlx5 promoter CpG hydroxymethylation and methylation (B)
Affymetrix GeneChip analysis
Total RNA was isolated using a RNA Isolation Kit (Qiagen). Quality control of the RNA's as well as labeling, hybridization, and scanning of the hybridized arrays was performed by the “Kompetenzzentrum fuer Fluoreszente Bioanalytik (KFB)” using the mouse 430 2.0 chip (Affymetrix). Genes that were up- or downregulated beyond 1.2-fold are listed in the Supplemental Data.
Specific promoter methylation and hydroxymethylation
To analyze the Fas and Dlx5 promoters DNA for 5-mC or 5-hmC, appropriate fragments of the targeted promoter regions were generated by digestion of 1 µg or of 7 µg of genomic DNA respectively with 70 U of the CpG methylation insensitive restriction enzyme MboII (Promega) for 1 h at 37°C from cells cultured for 12 h for 1 d or for 5 d with diverse concentrations of DMSO in the medium. Subsequently, the enzyme was heat inactivated at 65°C for 20 min. Two regions of the Fas promoter were selected. One CpG-rich region is localized at 2.6 kb and the second one at 30 bp upstream from the Fas transcriptional start site (TSS).Citation1,Citation4,Citation34 As shown in , of the Dlx5 promoter region, a fragment was selected with an overall CpG content of 51%. It starts at 1049 bp upstream from the TSS and extends to 60 bp of the first exon. MboII digestion subdivided the selected promoter into two fragments: the distal region showed a CpG content of 47%, the proximal region of 55% (, NM_198854.1). After MboII digestion, DNA was purified using a commercially available PCR clean-up Kit following the supplier’s instructions. In the next step methylated or hydroxymethylated DNA fragments were captured using the “MethylMiner Methylated DNA Enrichment Kit” (Invitrogen). In brief, methylated or hydroxymethylated DNA was captured by methyl-CpG binding domain protein 2 (MBD2) or by a specific hydroxymethyl-cytosine antibody (Abgent,) respectively, coupled to magnetic beads to separate the unmodified from the non-modified DNA fractions. DNA was eluted from the magnetic beads with 200 µl of 2 M NaCl solution as single fraction independent from the CpG methylation density and concentrated by ethanol precipitation. Finally, the mean methylation or hydroxymethylation status of the fragments was determined by amplifying the fragments by quantitative real-time PCR. Amplification ratios of the bound (methylated/hydroxymethylated) DNA fraction to unbound (unmethylated/non hydroxymethylated) DNA fraction were calculated (for primer design see ).
Figure 13.Dlx5 genomic structure with 5′flanking region (1100 bp, black line), the non translated region (182 bp, light gray box), whose left border indicates the transcription start site, the □rst exon (355 bp, dark gray box) and a part of the □rst intron. The vertical bars above the horizontal line of the gene indicate the CpGs and the vertical lines labeled with M indicate the MboII restriction sites. Two fragments indicated by light gray arrows and labeled as distal and proximal fragments are used for the “MethylMiner” assay.
For assessment of the specificity of the 5-hmC antibody, either 40 ng of non methylated, fully methylated or fully hydroxymethylated DNA standards (Zymo Research) were captured with the “MethylMiner Methylated DNA Enrichment Kit” in combination with the methyl-CpG binding domain protein 2 (MBD2) or with the hydroxymethyl-cytosine antibody (Abgent) as described above and eluted DNA fractions were amplified by real-time PCR using the supplied PCR Primer. (Fig. S1).
Global DNA methylation
MC3T3-E1 cells were cultured either as described above or were synchronized by serum depletion for 1 d, to exclude DNA replication as cause for DNA demethylation. Subsequently the cells were treated with DMSO for 12 h. Thereafter cells were washed twice with PBS, detached with 0.02% Pronase in PBS and collected by centrifugation (1400 rpm). Subsequently, DNA and RNA were isolated from about 5x10⁵ cells with a DNA/RNA isolation Kit (Qiagen). Global methylation was addressed by digestion of DNA with the 5-methyl-cytosine sensitive restriction enzyme HpaII and compared with a restriction with the insensitive enzyme MspI.Citation66 100 ng DNA were digested in multi core buffer (Promega) with 5 U MspI or HpaII or incubated without enzyme (blank) for 3 h at 37°C in a total volume of 30 µl. Sticky ends of the DNA were filled up by adding 20 µl of a mixture containing 0.1 µM Biotin-11-dCTP and 0.1 µM Biotin-11-dGTP (Perkin Elmer) and 0.5 U Klenow-fragment of DNA-polymerase III (Promega) in 500 mM TRIS-HCl, pH 7.2, 100 mM MgSO4 and 1 mM dithiothreitol and incubated at room temperature for half an hour. Thereafter, the reaction was transferred into multi-well plates (Optiplate, Beckman) and 100 µl of Reacti-BindTM DNA Coating Solution (Pierce) was added to each well and incubated over night at room temperature. On the next day, the wells were washed once with TBS (10 mM Tris-HCL pH 8.0, 150 mM NaCl). After a blocking step with 1% blocking solution (Roche) in TBS for one hour, a solution of 50 ng/µl streptavidin-horse radish peroxidase conjugate (Promega) in TBS was added and incubated for one further hour at room temperature. Thereafter, the wells were washed 3 times with TBS containing 0.5% Tween-20 and 2 times with water. 100 µl of the chemo-luminescence substrate (Promega) was added to each well and the light emission was measured in an illuminometer (Promega).
Assessment of global cytosine 5-hydroxymethylation
After incubation with increasing DMSO concentrations for 12 h, 1 d or 5 d, MC3T3-E1 cells were fixed by methanol-acetone (7:3) for 10 min at -20°C. Thereafter cell layers were blocked for 20 min with 10% blocking reagent (Roche) and incubated for one further hour with 0.5 µg/ml anti-5-hmC antibody (Abgent). Afterwards, the cells were washed thrice with PBS and incubated for one further hour with an Alexa488 labeled secondary antibody (Invitrogen) diluted 1:300 in blocking buffer. Finally nuclei were stained with Hoechst 33258 dye (Polysciences). The fluorescence of both signals was measured with a multiwell plate reader (Tecan). The amount of DNA (nuclei signal) was estimated using a standard curve prepared from calf thymus DNA (Roche). The signal of the fluorescence of the 5-hmC staining was normalized to the amount of DNA. No signals were found when only the Alexa488 labeled secondary antibody (Invitrogen) was used.
Tet1 and Tet2 siRNA transfections
For Tet1 and Tet2 depletion by siRNA, MC3T3-E1 cells were seeded at 20,000 cells/cm2 in six multi-well plates. Six hours after seeding, cells were transfected with 40 pmol of Tet1 or Tet2 siRNA (Sigma) using X-tremeGENE siRNA Transfection Reagent (Roche) as described by the supplier. One day after transfection, medium change was performed and one part of the cells was treated with medium containing 1% of DMSO while the other part was left unchanged. After an incubation time of 12 h and 1 d, nucleic acids were isolated as described above and subjected to qRT-PCR.
Immunostaining of 5-hydroxymethyl-cytosine and 5-methyl-cytosine
After incubation with increasing DMSO concentrations for 12 h or 1 d, MC3T3-E1 cells were fixed by methanol-acetone (7:3) for 10 min at -20°C. For 5-hmC and 5-mC co-staining, cells were additionally incubated with 4N HCl for 5 min at room temperature. After blocking, the cells for 20 min with 10% blocking reagent (Roche), cells were incubated for 1 h at room temperature with anti-5-hmC antibody (Abgent) or contemporaneously with anti-5-mC antibody (Eurogentec) both diluted 1:500 in blocking buffer. Afterwards, the cells were washed thrice with PBS and incubated for one further hour with Alexa488 or Alexa633 labeled secondary antibodies (Invitrogen) diluted 1:300 in blocking buffer. Finally nuclei were stained with Hoechst 33258 dye (Polysciences). The cell layers were washed several times with PBS and finally with water. Slides were mounted with Vectashield mounting media and immunofluorescence was visualized on a Leica laser-scanning microscope.
No signal was found by using only the Alexa488 or the Alexa633 labeled secondary antibody (Invitrogen).
Cell multiplication
MC3T3-E1 cells were seeded in culture dishes at a density of 5,000/cm2 and were either left untreated (controls) or treated with 0.5%, 1% and 2% of DMSO in medium for 1, 2 and 5 d. For determination of the cell number (using DNA concentration as surrogate), cell layers were washed with PBS and frozen with 1 mM TRIS-HCl buffer (pH 8.0) containing 0.1 mM EDTA. During thawing, Hoechst 33258 dye (Polysciences) was added to a concentration of 1 μg/mL and, after an incubation time of 15 min at room temperature, the fluorescence was measured (excitation 360, emission 465 nm).Citation67 The amount of DNA was estimated using a standard curve prepared from calf thymus DNA (Roche).
Time course of cell multiplication was also measured by cell counting. For this purpose cells were seeded at a density of 5,000/cm2 in 24-well culture plates and were either left untreated (controls) or treated with 1% of DMSO in medium for 1, 2, 3, 4, 5 and 10 d. After the respective culture time cells were detached by means of 1 ml 0.001% pronase E (Roche) and 0.02% EDTA in Ca2+- and Mg2+- free phosphate-buffered saline (PBS) and aliquots were counted with a cell counter (Casy).
Protein isolation and immunoblotting
For protein extraction, cell layers were washed two times with PBS and scraped in SDS sample buffer (2% SDS, 100 mM β-mercaptoethanol, 125 mM TRIS-HCl, pH 6.8) and heated at 95°C for 5 min. Thirty µg of protein extracts were fractionated on 8% SDS-polyacrylamide gels. Following SDS-gel electrophoresis, the proteins were transferred to nitrocellulose filters (Millipore) and blocked overnight with 10% blocking reagent (Roche Applied Science) in TN Buffer (50 mM Tris, 125 mM NaCl, pH 8). Subsequently, the filters were incubated for 1 h at room temperature with antibodies against DNMT1 (K-18, Santa Cruz Biotechnology) diluted 1:200 in blocking buffer. Afterward, all filters were washed three times with immune-blot wash buffer (TN buffer containing 0.01% Tween) and incubated for 1 h with an anti-goat IgG HRP-labeled secondary antibody (Sigma) diluted 1:160,000 in blocking buffer. Finally, the blots were washed again three times with immune-blot washing buffer before detection of light emission with the BM chemiluminescence Immune-blotting kit (Roche Applied Science) as described by the supplier. Chemiluminescence was measured with an image acquisition system (Vilber Lourmat).
Measurement of caspase activity
Caspase 3/7 and caspase 8 activities were measured by using the Caspase-Glo 3/7 and Caspase-Glo 8 assay Kit (Promega) following manufacturers instructions. Briefly, after treatment with 1% or 2% DMSO for 1 and 5 d, cells were lysed and substrate cleavage by caspases was measured by the generated luminescent signal with a 96 multiwell luminometer (Glomax, Promega).
Statistical analysis
Statistical analyses were performed using either ANOVA or Student t-test using Prism 4.03 (GraphPad Software) while p ≤ 0.05 was considered as significant. For each experiment, the triplicate results of the qRT-PCR were averaged and this mean value was treated as a single statistical unit. The data of the triplicate experiments are presented as means ± standard deviation (SD).
Additional material
Download Zip (463.6 KB)Acknowledgments
This study was supported by the Fonds zur Förderung der wissenschaftlichen Forschung (FWF; The Austrian Science Fund) Project P20646-B11, the WGKK (Social Health Insurance Vienna), and the AUVA (Austrian Social Insurance for Occupational Risks).
Disclosure of Potential Conflicts of Interest
No author contributing to this study has to declare a conflict of interest regarding sponsoring of this work by any companies.
References
- Varga F, Karlic H, Thaler R, Klaushofer K. Functional aspects of CpG dinucleotides and their locations in genes. BioMolecular Concepts 2011; 286:5578 - 88
- Razin A, Webb C, Szyf M, Yisraeli J, Rosenthal A, Naveh-Many T, et al. Variations in DNA methylation during mouse cell differentiation in vivo and in vitro. Proc Natl Acad Sci U S A 1984; 81:2275 - 9; http://dx.doi.org/10.1073/pnas.81.8.2275; PMID: 6585800
- Bird AP. CpG-rich islands and the function of DNA methylation. Nature 1986; 321:209 - 13; http://dx.doi.org/10.1038/321209a0; PMID: 2423876
- Gazin C, Wajapeyee N, Gobeil S, Virbasius CM, Green MR. An elaborate pathway required for Ras-mediated epigenetic silencing. Nature 2007; 449:1073 - 7; http://dx.doi.org/10.1038/nature06251; PMID: 17960246
- Bestor TH. The DNA methyltransferases of mammals. Hum Mol Genet 2000; 9:2395 - 402; http://dx.doi.org/10.1093/hmg/9.16.2395; PMID: 11005794
- Bhattacharya SK, Ramchandani S, Cervoni N, Szyf M. A mammalian protein with specific demethylase activity for mCpG DNA. Nature 1999; 397:579 - 83; http://dx.doi.org/10.1038/17533; PMID: 10050851
- Barreto G, Schäfer A, Marhold J, Stach D, Swaminathan SK, Handa V, et al. Gadd45a promotes epigenetic gene activation by repair-mediated DNA demethylation. Nature 2007; 445:671 - 5; http://dx.doi.org/10.1038/nature05515; PMID: 17268471
- Rai K, Huggins IJ, James SR, Karpf AR, Jones DA, Cairns BR. DNA demethylation in zebrafish involves the coupling of a deaminase, a glycosylase, and gadd45. Cell 2008; 135:1201 - 12; http://dx.doi.org/10.1016/j.cell.2008.11.042; PMID: 19109892
- Guo JU, Su Y, Zhong C, Ming GL, Song H. Hydroxylation of 5-methylcytosine by TET1 promotes active DNA demethylation in the adult brain. Cell 2011; 145:423 - 34; http://dx.doi.org/10.1016/j.cell.2011.03.022; PMID: 21496894
- Ito S, D’Alessio AC, Taranova OV, Hong K, Sowers LC, Zhang Y. Role of Tet proteins in 5mC to 5hmC conversion, ES-cell self-renewal and inner cell mass specification. Nature 2010; 466:1129 - 33; http://dx.doi.org/10.1038/nature09303; PMID: 20639862
- Wu H, Zhang Y. Tet1 and 5-hydroxymethylation: a genome-wide view in mouse embryonic stem cells. Cell Cycle 2011; 10:2428 - 36; http://dx.doi.org/10.4161/cc.10.15.16930; PMID: 21750410
- Ma DK, Guo JU, Ming GL, Song H. DNA excision repair proteins and Gadd45 as molecular players for active DNA demethylation. Cell Cycle 2009; 8:1526 - 31; http://dx.doi.org/10.4161/cc.8.10.8500; PMID: 19377292
- Ficz G, Branco MR, Seisenberger S, Santos F, Krueger F, Hore TA, et al. Dynamic regulation of 5-hydroxymethylcytosine in mouse ES cells and during differentiation. Nature 2011; 473:398 - 402; http://dx.doi.org/10.1038/nature10008; PMID: 21460836
- Wu H, D’Alessio AC, Ito S, Xia K, Wang Z, Cui K, et al. Dual functions of Tet1 in transcriptional regulation in mouse embryonic stem cells. Nature 2011; 473:389 - 93; http://dx.doi.org/10.1038/nature09934; PMID: 21451524
- Iwatani M, Ikegami K, Kremenska Y, Hattori N, Tanaka S, Yagi S, et al. Dimethyl sulfoxide has an impact on epigenetic profile in mouse embryoid body. Stem Cells 2006; 24:2549 - 56; http://dx.doi.org/10.1634/stemcells.2005-0427; PMID: 16840553
- Friend C, Scher W, Holland JG, Sato T. Hemoglobin synthesis in murine virus-induced leukemic cells in vitro: stimulation of erythroid differentiation by dimethyl sulfoxide. Proc Natl Acad Sci U S A 1971; 68:378 - 82; PMID: 5277089
- Marks PA, Breslow R. Dimethyl sulfoxide to vorinostat: development of this histone deacetylase inhibitor as an anticancer drug. Nat Biotechnol 2007; 25:84 - 90; http://dx.doi.org/10.1038/nbt1272; PMID: 17211407
- Pruitt SC. Discrete endogenous signals mediate neural competence and induction in P19 embryonal carcinoma stem cells. Development 1994; 120:3301 - 12; PMID: 7536654
- Dinsmore J, Ratliff J, Deacon T, Pakzaban P, Jacoby D, Galpern W, et al. Embryonic stem cells differentiated in vitro as a novel source of cells for transplantation. Cell Transplant 1996; 5:131 - 43; http://dx.doi.org/10.1016/0963-6897(95)02040-3; PMID: 8689027
- Bonser RW, Siegel MI, McConnell RT, Cuatrecasas P. The appearance of phospholipase and cyclo-oxygenase activities in the human promyelocytic leukemia cell line HL60 during dimethyl sulfoxide-induced differentiation. Biochem Biophys Res Commun 1981; 98:614 - 20; http://dx.doi.org/10.1016/0006-291X(81)91158-X; PMID: 6261745
- Yokochi T, Robertson KD. Dimethyl sulfoxide stimulates the catalytic activity of de novo DNA methyltransferase 3a (Dnmt3a) in vitro. Bioorg Chem 2004; 32:234 - 43; http://dx.doi.org/10.1016/j.bioorg.2004.04.005; PMID: 15210338
- Pittenger MF, Mackay AM, Beck SC, Jaiswal RK, Douglas R, Mosca JD, et al. Multilineage potential of adult human mesenchymal stem cells. Science 1999; 284:143 - 7; http://dx.doi.org/10.1126/science.284.5411.143; PMID: 10102814
- Kim YJ, Kim BG, Lee SJ, Lee HK, Lee SH, Ryoo HM, et al. The suppressive effect of myeloid Elf-1-like factor (MEF) in osteogenic differentiation. J Cell Physiol 2007; 211:253 - 60; http://dx.doi.org/10.1002/jcp.20933; PMID: 17167770
- Komori T. Regulation of osteoblast differentiation by transcription factors. J Cell Biochem 2006; 99:1233 - 9; http://dx.doi.org/10.1002/jcb.20958; PMID: 16795049
- Lee MH, Kim YJ, Kim HJ, Park HD, Kang AR, Kyung HM, et al. BMP-2-induced Runx2 expression is mediated by Dlx5, and TGF-beta 1 opposes the BMP-2-induced osteoblast differentiation by suppression of Dlx5 expression. J Biol Chem 2003; 278:34387 - 94; http://dx.doi.org/10.1074/jbc.M211386200; PMID: 12815054
- Lian JB, Stein GS, Javed A, van Wijnen AJ, Stein JL, Montecino M, et al. Networks and hubs for the transcriptional control of osteoblastogenesis. Rev Endocr Metab Disord 2006; 7:1 - 16; http://dx.doi.org/10.1007/s11154-006-9001-5; PMID: 17051438
- Ryoo HM, Lee MH, Kim YJ. Critical molecular switches involved in BMP-2-induced osteogenic differentiation of mesenchymal cells. Gene 2006; 366:51 - 7; http://dx.doi.org/10.1016/j.gene.2005.10.011; PMID: 16314053
- Sudo H, Kodama HA, Amagai Y, Yamamoto S, Kasai S. In vitro differentiation and calcification in a new clonal osteogenic cell line derived from newborn mouse calvaria. J Cell Biol 1983; 96:191 - 8; http://dx.doi.org/10.1083/jcb.96.1.191; PMID: 6826647
- Luegmayr E, Varga F, Frank T, Roschger P, Klaushofer K. Effects of triiodothyronine on morphology, growth behavior, and the actin cytoskeleton in mouse osteoblastic cells (MC3T3-E1). Bone 1996; 18:591 - 9; http://dx.doi.org/10.1016/8756-3282(96)00068-3; PMID: 8806001
- Sudo H, Kodama HA, Amagai Y, Yamamoto S, Kasai S. In vitro differentiation and calcification in a new clonal osteogenic cell line derived from newborn mouse calvaria. J Cell Biol 1983; 96:191 - 8; http://dx.doi.org/10.1083/jcb.96.1.191; PMID: 6826647
- Fratzl-Zelman N, Fratzl P, Hörandner H, Grabner B, Varga F, Ellinger A, et al. Matrix mineralization in MC3T3-E1 cell cultures initiated by beta-glycerophosphate pulse. Bone 1998; 23:511 - 20; http://dx.doi.org/10.1016/S8756-3282(98)00139-2; PMID: 9855459
- Fratzl-Zelman N, Hörandner H, Luegmayr E, Varga F, Ellinger A, Erlee MP, et al. Effects of triiodothyronine on the morphology of cells and matrix, the localization of alkaline phosphatase, and the frequency of apoptosis in long-term cultures of MC3T3-E1 cells. Bone 1997; 20:225 - 36; http://dx.doi.org/10.1016/S8756-3282(96)00367-5; PMID: 9071473
- Stephens AS, Stephens SR, Hobbs C, Hutmacher DW, Bacic-Welsh D, Woodruff MA, et al. Myocyte enhancer factor 2c, an osteoblast transcription factor identified by dimethyl sulfoxide (DMSO)-enhanced mineralization. J Biol Chem 2011; 286:30071 - 86; http://dx.doi.org/10.1074/jbc.M111.253518; PMID: 21652706
- Thaler R, Karlic H, Spitzer S, Klaushofer K, Varga F. Extra-cellular matrix suppresses expression of the apoptosis mediator Fas by epigenetic DNA methylation. Apoptosis 2010; 15:728 - 37; http://dx.doi.org/10.1007/s10495-010-0462-3; PMID: 20428952
- Zhang RP, Shao JZ, Xiang LX. GADD45A protein plays an essential role in active DNA demethylation during terminal osteogenic differentiation of adipose-derived mesenchymal stem cells. J Biol Chem 2011; 286:41083 - 94; http://dx.doi.org/10.1074/jbc.M111.258715; PMID: 21917922
- Schweizer D. Counterstain-enhanced chromosome banding. Hum Genet 1981; 57:1 - 14; PMID: 6167505
- Schwarzacher-Robinson T, Cram LS, Meyne J, Moyzis RK. Characterization of human heterochromatin by in situ hybridization with satellite DNA clones. Cytogenet Cell Genet 1988; 47:192 - 6; http://dx.doi.org/10.1159/000132547; PMID: 3416653
- Scaffidi C, Fulda S, Srinivasan A, Friesen C, Li F, Tomaselli KJ, et al. Two CD95 (APO-1/Fas) signaling pathways. EMBO J 1998; 17:1675 - 87; http://dx.doi.org/10.1093/emboj/17.6.1675; PMID: 9501089
- Movassagh M, Foo RS. Simplified apoptotic cascades. Heart Fail Rev 2008; 13:111 - 9; http://dx.doi.org/10.1007/s10741-007-9070-x; PMID: 18080749
- van der Slot AJ, Zuurmond AM, Bardoel AF, Wijmenga C, Pruijs HE, Sillence DO, et al. Identification of PLOD2 as telopeptide lysyl hydroxylase, an important enzyme in fibrosis. J Biol Chem 2003; 278:40967 - 72; http://dx.doi.org/10.1074/jbc.M307380200; PMID: 12881513
- Cheung WM, Ng WW, Kung AW. Dimethyl sulfoxide as an inducer of differentiation in preosteoblast MC3T3-E1 cells. FEBS Lett 2006; 580:121 - 6; http://dx.doi.org/10.1016/j.febslet.2005.11.062; PMID: 16360153
- Marks PA, Breslow R. Dimethyl sulfoxide to vorinostat: development of this histone deacetylase inhibitor as an anticancer drug. Nat Biotechnol 2007; 25:84 - 90; http://dx.doi.org/10.1038/nbt1272; PMID: 17211407
- Jones CL, Wain EM, Chu CC, Tosi I, Foster R, McKenzie RC, et al. Downregulation of Fas gene expression in Sézary syndrome is associated with promoter hypermethylation. J Invest Dermatol 2010; 130:1116 - 25; http://dx.doi.org/10.1038/jid.2009.301; PMID: 19759548
- Karabulut B, Karaca B, Atmaca H, Kisim A, Uzunoglu S, Sezgin C, et al. Regulation of apoptosis-related molecules by synergistic combination of all-trans retinoic acid and zoledronic acid in hormone-refractory prostate cancer cell lines. Mol Biol Rep 2011; 38:249 - 59; http://dx.doi.org/10.1007/s11033-010-0102-6; PMID: 20349282
- Patra SK, Szyf M. DNA methylation-mediated nucleosome dynamics and oncogenic Ras signaling: insights from FAS, FAS ligand and RASSF1A. FEBS J 2008; 275:5217 - 35; http://dx.doi.org/10.1111/j.1742-4658.2008.06658.x; PMID: 18803665
- Petak I, Danam RP, Tillman DM, Vernes R, Howell SR, Berczi L, et al. Hypermethylation of the gene promoter and enhancer region can regulate Fas expression and sensitivity in colon carcinoma. Cell Death Differ 2003; 10:211 - 7; http://dx.doi.org/10.1038/sj.cdd.4401132; PMID: 12700649
- Wu SC, Zhang Y. Active DNA demethylation: many roads lead to Rome. Nat Rev Mol Cell Biol 2010; 11:607 - 20; http://dx.doi.org/10.1038/nrm2950; PMID: 20683471
- Kriaucionis S, Heintz N. The nuclear DNA base 5-hydroxymethylcytosine is present in Purkinje neurons and the brain. Science 2009; 324:929 - 30; http://dx.doi.org/10.1126/science.1169786; PMID: 19372393
- Tahiliani M, Koh KP, Shen Y, Pastor WA, Bandukwala H, Brudno Y, et al. Conversion of 5-methylcytosine to 5-hydroxymethylcytosine in mammalian DNA by MLL partner TET1. Science 2009; 324:930 - 5; http://dx.doi.org/10.1126/science.1170116; PMID: 19372391
- Matrisciano F, Dong E, Gavin DP, Nicoletti F, Guidotti A. Activation of group II metabotropic glutamate receptors promotes DNA demethylation in the mouse brain. Mol Pharmacol 2011; 80:174 - 82; http://dx.doi.org/10.1124/mol.110.070896; PMID: 21505039
- Bestor TH. The DNA methyltransferases of mammals. Hum Mol Genet 2000; 9:2395 - 402; http://dx.doi.org/10.1093/hmg/9.16.2395; PMID: 11005794
- Myant K, Stancheva I. LSH cooperates with DNA methyltransferases to repress transcription. Mol Cell Biol 2008; 28:215 - 26; http://dx.doi.org/10.1128/MCB.01073-07; PMID: 17967891
- Sun LQ, Lee DW, Zhang Q, Xiao W, Raabe EH, Meeker A, et al. Growth retardation and premature aging phenotypes in mice with disruption of the SNF2-like gene, PASG. Genes Dev 2004; 18:1035 - 46; http://dx.doi.org/10.1101/gad.1176104; PMID: 15105378
- Koh KP, Yabuuchi A, Rao S, Huang Y, Cunniff K, Nardone J, et al. Tet1 and Tet2 regulate 5-hydroxymethylcytosine production and cell lineage specification in mouse embryonic stem cells. Cell Stem Cell 2011; 8:200 - 13; http://dx.doi.org/10.1016/j.stem.2011.01.008; PMID: 21295276
- Abdel-Wahab O, Mullally A, Hedvat C, Garcia-Manero G, Patel J, Wadleigh M, et al. Genetic characterization of TET1, TET2, and TET3 alterations in myeloid malignancies. Blood 2009; 114:144 - 7; http://dx.doi.org/10.1182/blood-2009-03-210039; PMID: 19420352
- Alderton GK. Leukaemia and lymphoma: The expansive reach of TET2. Nat Rev Cancer 2011; 11:535; http://dx.doi.org/10.1038/nrc3115; PMID: 21779006
- Moran-Crusio K, Reavie L, Shih A, Abdel-Wahab O, Ndiaye-Lobry D, Lobry C, et al. Tet2 loss leads to increased hematopoietic stem cell self-renewal and myeloid transformation. Cancer Cell 2011; 20:11 - 24; http://dx.doi.org/10.1016/j.ccr.2011.06.001; PMID: 21723200
- Williams K, Christensen J, Pedersen MT, Johansen JV, Cloos PA, Rappsilber J, et al. TET1 and hydroxymethylcytosine in transcription and DNA methylation fidelity. Nature 2011; 473:343 - 8; http://dx.doi.org/10.1038/nature10066; PMID: 21490601
- Pastor WA, Pape UJ, Huang Y, Henderson HR, Lister R, Ko M, et al. Genome-wide mapping of 5-hydroxymethylcytosine in embryonic stem cells. Nature 2011; 473:394 - 7; http://dx.doi.org/10.1038/nature10102; PMID: 21552279
- Guo JU, Su Y, Zhong C, Ming GL, Song H. Hydroxylation of 5-methylcytosine by TET1 promotes active DNA demethylation in the adult brain. Cell 2011; 145:423 - 34; http://dx.doi.org/10.1016/j.cell.2011.03.022; PMID: 21496894
- Manolagas SC. Birth and death of bone cells: basic regulatory mechanisms and implications for the pathogenesis and treatment of osteoporosis. Endocr Rev 2000; 21:115 - 37; http://dx.doi.org/10.1210/er.21.2.115; PMID: 10782361
- Wang D, Christensen K, Chawla K, Xiao G, Krebsbach PH, Franceschi RT. Isolation and characterization of MC3T3-E1 preosteoblast subclones with distinct in vitro and in vivo differentiation/mineralization potential. J Bone Miner Res 1999; 14:893 - 903; http://dx.doi.org/10.1359/jbmr.1999.14.6.893; PMID: 10352097
- Tamura Y, Takeuchi Y, Suzawa M, Fukumoto S, Kato M, Miyazono K, et al. Focal adhesion kinase activity is required for bone morphogenetic protein--Smad1 signaling and osteoblastic differentiation in murine MC3T3-E1 cells. J Bone Miner Res 2001; 16:1772 - 9; http://dx.doi.org/10.1359/jbmr.2001.16.10.1772; PMID: 11585340
- Guryanova O, Levine R. DNMT3A and stem cell function: new insights into old pathways. Haematologica 2012; 97:324; http://dx.doi.org/10.3324/haematol.2012.064410; PMID: 22383741
- Pfaffl MW. A new mathematical model for relative quantification in real-time RT-PCR. Nucleic Acids Res 2001; 29:e45; http://dx.doi.org/10.1093/nar/29.9.e45; PMID: 11328886
- Anisowicz A, Huang H, Braunschweiger KI, Liu Z, Giese H, Wang H, et al. A high-throughput and sensitive method to measure global DNA methylation: application in lung cancer. BMC Cancer 2008; 8:222; http://dx.doi.org/10.1186/1471-2407-8-222; PMID: 18673580
- Varga F, Rumpler M, Luegmayr E, Fratzl-Zelman N, Glantschnig H, Klaushofer K. Triiodothyronine, a regulator of osteoblastic differentiation: depression of histone H4, attenuation of c-fos/c-jun, and induction of osteocalcin expression. Calcif Tissue Int 1997; 61:404 - 11; http://dx.doi.org/10.1007/s002239900356; PMID: 9351883