Abstract
We assessed DNA methylation and copy number status of 27,000 CpGs in 149 urothelial carcinomas and integrated the findings with gene expression and mutation data. Methylation was associated with gene expression for 1,332 CpGs, of which 26% showed positive correlation with expression, i.e., high methylation and high gene expression levels. These positively correlated CpGs were part of specific transcription factor binding sites, such as sites for MYC and CREBP1, or located in gene bodies. Furthermore, we found genes with copy number gains, low expression and high methylation levels, revealing an association between methylation and copy number levels. This phenomenon was typically observed for developmental genes, such as HOX genes, and tumor suppressor genes. In contrast, we also identified genes with copy number gains, high expression and low methylation levels. This was for instance observed for some keratin genes. Tumor cases could be grouped into four subgroups, termed epitypes, by their DNA methylation profiles. One epitype was influenced by the presence of infiltrating immune cells, two epitypes were mainly composed of non-muscle invasive tumors, and the remaining epitype of muscle invasive tumors. The polycomb complex protein EZH2 that blocks differentiation in embryonic stem cells showed increased expression both at the mRNA and protein levels in the muscle invasive epitype, together with methylation of polycomb target genes and HOX genes. Our data highlights HOX gene silencing and EZH2 expression as mechanisms to promote a more undifferentiated and aggressive state in UC.
Introduction
Urothelial carcinoma (UC) of the bladder is one of the most common cancer forms in the Western world and has one of the highest lifetime costs per patient.Citation1 The major clinical distinction is between the non-muscle invasive Ta and T1 and the muscle invasive (MI) ≥ T2 tumors. A significant effort to characterize bladder cancer at the molecular level has been undertaken during recent years. Mutations in FGFR3, PIK3CA and TP53 are frequently observedCitation2 and several recurrent copy number aberrations have been identified including frequent losses of chromosome arms 2q, 8p, 9p and 9q, as well as gains of 1q and 6p.Citation3 In addition, gene expression profiling has greatly contributed to our understanding of bladder tumor biologyCitation4-Citation6 and gene expression analysis in combination with array-CGH and gene mutation analyses has revealed the presence of two distinct molecular subtypes of urothelial carcinoma.Citation7 Epigenetic changes by DNA methylation at CG dinucleotide sites (CpGs) are frequent events in tumor development.Citation8,Citation9 Initially, DNA methylation studies were limited to 5′ promoter regions of a small number of genes.Citation10 Microarray technology has recently allowed investigating the cancer methylome at a larger scale and made it possible to study DNA methylation from a genomic perspective.Citation11 Apart from revealing specific epigenetic tumor subtypes with distinct DNA methylation signatures in, e.g., breast cancer,Citation12-Citation14 colon cancerCitation15 and hematological neoplasms,Citation16 DNA methylation has also been shown to exhibit recurring local topologies.Citation17,Citation18 High-throughput DNA methylation analyses have also made it possible to identify promising epigenetic biomarkers.Citation10,Citation19-Citation21 So far, most differential DNA methylation has been attributed to genes that are essential for developmental processes, often Polycomb Repressive Complex 2 (PRC2) regulated genes.Citation22 The present study aims to identify stable tumor subgroups based on DNA methylation, and to refine our understanding of bladder cancer by integrating the findings with gene mutations, copy number alterations, and gene expression data.
Results
DNA methylation in bladder cancer
Characteristics of DNA methylation in UC
We measured the methylation status of individual CpGs of 149 tumors using β-values that range from 0 (unmethylated) to 1 (fully methylated). In tumors, CpG-Island CpGs (Island CpGs) showed significantly lower methylation (β-values) levels than non-CpG-Island CpGs (non-Island CpGs). Non-Island CpGs showed high β-value variation across the data (Fig. S1) and several regions with hyper-variable DNA methylation, including the HOXA, HOXB and HOXD gene clusters, as well as CDH8 and CDH11, were identified (Fig. S2). Hyper-variable regions were enriched for membrane-related genes, e.g., the GO term ‘integral to plasma membrane’ (fdr = 0.01) when excluding HOX genes from the analysis.
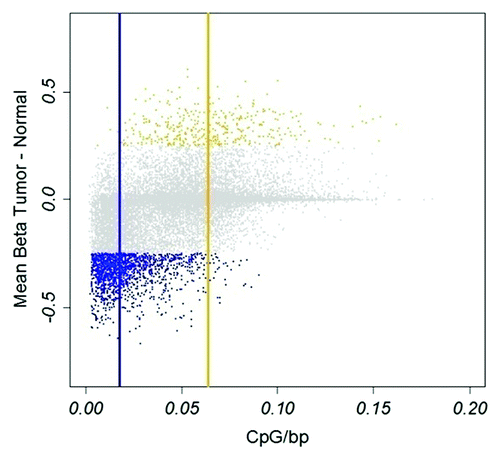
For comparison between tumor and normal samples (n = 6) we used an average difference in β-value ∆β ≥ 0.25 and ∆β ≤ -0.25 as thresholds. A larger fraction was found to be hypomethylated than hypermethylated in tumors, 1,567 and 386 CpGs, respectively (Table S1). Of 1,567 hypomethylated CpGs, 1,161 (75%) were non-Island CpGs and of 386 hypermethylated CpGs, 367 (95%) were Island CpGs, a significant enrichment (p < 2x10⁻¹⁶, Fisher test) in the respective class of methylation states. Hence, CpGs hypomethylated in tumors were preferentially located in CpG poor regions, whereas hypermethylated CpGs were preferentially located in CpG rich regions (). The differentially methylated genes identified in the comparison showed a large overlap with previously published data using the same platform.Citation21 Hypomethylated CpGs were enriched for immune-related genes (GO term analysis, fdr < 10−7); hypermethylated CpGs showed strong enrichment for developmental process (fdr < 10−11) and homeobox-containing genes (INTERPRO, fdr < 10−12).
Figure 1. Hypo- and hypermethylated CpGs in tumors. Hypomethylation, blue; hypermethylation, yellow. Vertical blue and yellow lines indicate median CpG density of hypo- and hypermethylated CpGs, respectively. X-axis, CpG density defined as fraction of CpGs in a 1600 bp window. Y-axis, difference in β-value between tumor and normal tissue.
DNA methylation and gene expression
Positively correlated CpGs show enrichment of specific transcription factor motifs
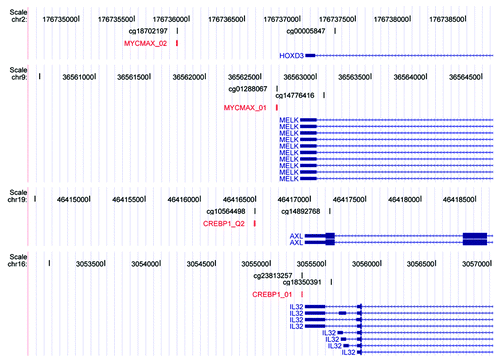
A total of 1,332 CpGs (8.4%) showed significant correlation between methylation and gene expression (fdr < 0.05, Spearman correlation) (Table S1). Of the 1,332 CpGs, 45% were non-Island CpGs, a significant overrepresentation of non-Island CpGs (p < 1x10⁻¹⁶) considering the proportions in the assessed CpGs. Among the CpGs correlated with gene expression, methylation was associated with reduced gene expression for 981/1,332 CpGs (74%). Genes with a strong negative association included members of the HOX genes and cytokeratins, such as HOXB2 (r = -0.70), KRT20 (r = -0.71) and KRT13 (r = -0.69). Notably, a substantial number of CpGs show positive correlation between methylation and gene expression. This group of 351 CpGs was enriched for genes located to the extracellular region (fdr = 3x10⁻¹⁰), e.g., COL18A1 (r = 0.52) and COL8A2 (r = 0.51), and involved in defense response (fdr = 4x10⁻⁷), e.g., CCL2 (r = 0.51) and LILRB3 (r = 0.51). CpGs associated with increased expression showed a trend (p < 0.025, Fisher exact test) to be located in non-Island CpGs when compared with negatively associated CpGs. To investigate whether the observed CpGs were located within a specific sequence context, we performed a search for motives overlapping the CpG using the MEME algorithm. This analysis identified a highly enriched motif with E = 2x10⁻²⁰, compared with E = 10−4 obtained in a random sample of the same size, with the consensus sequence ACGTGATA (Fig. S3). Further analyses revealed significant enrichment for several specific transcription factor binding sites covering the methylated CpGs (), most of which were located in promoter regions (). Binding sites for E2F (E2F1) were, on the other hand, significantly under-represented (fdr < 6 × 10⁻⁵). By re-annotating all CpGs on the platform into promoter and gene body CpGs we observed a significant enrichment (p < 10−8) for CpGs located within gene bodies among the positively correlated CpGs. No transcription factor binding site enrichment was observed among the CpGs showing negative association with methylation. Hence, methylation of CpGs located within both gene bodies and transcription factor binding sites is associated with increased gene expression.
Table 1. Enriched TF motifs covering CpGs with positive correlation to gene expression
Figure 2. Transcription factor binding motifs contain CpGs that show a positive association between methylation and gene expression levels. UCSC genome browser view of MYCMAX_01/02 and CREBP1_01/Q2 transcription factor motifs. Each panel contains the following tracks from top to bottom: Coordinates of human hg18 genome. CpGs present on Illumina’s 27K platform. Transcription factor motifs, red. RefSeq genes, blue.
DNA methylation and copy number alterations
We sought to investigate the correlation between gene copy changes and methylation status for individual CpGs. We developed a method to obtain copy number information from the Illumina Methylation27K BeadChip array (see Methods and Supplemental Material). We validated the obtained copy number profiles using array CGH data, which was available for 68 of the 149 cases. Copy number data derived from the Illumina platform was highly similar to array CGH data (Supplemental Material).
DNA methylation levels are associated with copy number changes
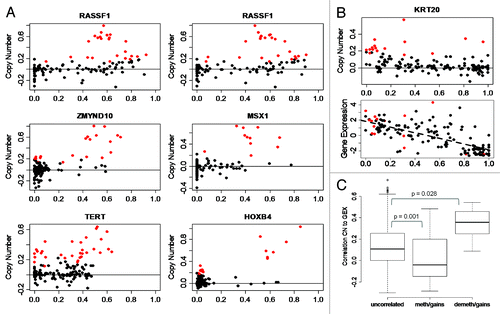
With concurrent information of DNA methylation and copy number for each CpG the relationship between methylation and copy number levels could be analyzed in detail. To find robust associations we limited the investigation to CpGs that show variation in methylation levels (variance > 0.02; standard deviation > 0.14). The CpGs were divided into frequently deleted and frequently gained sites. The observed correlations were then compared with correlations obtained by reshuffling of the genomic positions. For deleted CpGs no significant correlations were observed whereas 103 gained CpGs showed significant correlation between methylation and gene copy status: 77 positively correlated and 26 negatively correlated (Table S1). The positively correlated events were seen in tumor suppressor genes, e.g., RASSF1 and MLH1, and developmental genes, e.g., HOX and MSX1. Almost all positively correlated CpGs were located in CpG Islands (73/77, p < 10−16, Fisher’s exact test). Typically, CpGs with positive correlation were unmethylated when present in normal copy numbers and showed increased methylation in tumors with gains, as demonstrated by, e.g., RASSF1 and HOXB4 (). The negatively correlated events were enriched for keratin genes (fdr = 0.003), with no preference regarding Island or non-Island CpGs (p = 0.56). We then set out to determine if the correlated CpGs have an impact on gene expression. As seen in , cases with concomitant gain and demethylation of KRT20 are among the high expressers, demonstrating a combined effect of copy number gain and demethylation on gene expression. Compared with gained sites not associated with methylation, the correlation of copy number with gene expression was statistically higher for genes that showed demethylation and gains (p = 0.028, t-test). The correlation with gene expression was lower for genes showing methylation and gains compared with non-associated sites (p = 0.001, t-test; ), i.e., the expression of genes with this methylation pattern is associated to gene copy numbers to a lesser extent.
Figure 3. Methylation of CpG sites is associated to copy number levels. (A) Methylation in cases with gains. RASSF1 (two CpGs), ZMYND10, MSX1, TERT, and HOXB4 CpG sites show methylation in samples with gains. X-axis, DNA methylation as β-values. Y-axis, log-ratio of copy number. Solid horizontal line, copy number = 2; red points, cases with gains; black points, cases with normal copy number or losses. (B) Demethylation in cases with gains at KRT20 site. Lower plot, expression is increased in cases that show demethylation and gains; dashed line shows correlation of expression and methylation levels. (C) Effect of copy number on gene expression stratified by CpGs that are uncorrelated in cases with gains, methylated in cases with gains, and de-methylated in cases with gains. Y-axis, correlation of copy number and gene expression. P value from t-test.
Copy number changes have a larger impact on gene expression than DNA methylation levels
In contrast to the low fraction of genes influenced by CpG methylation (8.4%), 44% of the same genes showed significant correlation between copy numbers and gene expression using the same criteria for significance. The association was positive in > 99% of cases, i.e., upregulation was seen when genes were gained and downregulation when deleted. Thus, our data indicate that the tumor phenotype (i.e., the gene expression profile) is to a larger extent affected by gene copy numbers than by gene promoter CpG methylation.
Epigenetic subtypes of bladder cancer
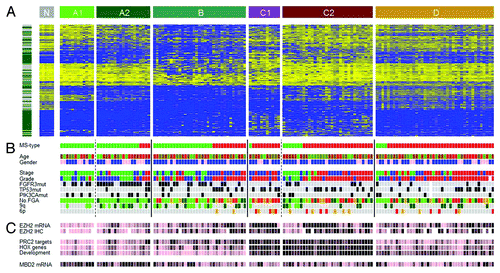
We used hierarchical clustering analyses (HCA) of bootstrapped data sets based on the CpGs that showed highest variation in DNA methylation levels (Supplemental Material) to identify four major subtypes of bladder cancer: Epitypes A, B, C, and D (; Supplemental Material). The available data indicated a possible further division of Epitypes A and C, A1 and A2, and C1 and C2. We tested the robustness of the results by repeating the procedure with and without background-correction, using the 15% top varying CpGs, resulting in highly similar epitypes. The robustness was further confirmed using M-values, i.e., converted β-values.Citation23
Figure 4. Epitypes in their genomic and histopathologcial context. (A) Heat map of 25% most varying CpGs. Left bar, green, Island CpGs; gray, non-Island CpGs. Heat map color code, blue, low methylation levels to yellow, high methylation levels. Epitypes as noted in the upper bar. Tumors within an Epitype are ordered by molecular subtype (MS types). N, normal urothelium. (B) Patient information and molecular annotations. MS types, green, MS1; red, MS2. Age is colored from young age, green to old age, red. Gender, pink, female; blue, male. Histological stage, green, Ta; blue, T1; red, T2 or higher. Histological grade, green, Grade1; blue, Grade2; red, Grade3. FGFR3, TP53, and PIK3CA mutations, gray, not mutated; black, mutated. No. FGA (Number of focal genomic amplifications) is the number of continuous stretches with more than 5 gained CpGs, light green, 0–4 gains; dark green, 5–8 gains; orange, 9–12 gains; red, more than 12 gains. 9q losses of more than 1x SAT are indicated in dark green and of more than 2.5xSAT in light green. The 6p amplicon ranges from E2F3 to SOX4; with gains more than 1xSAT in orange and more than 2.5xSAT in red. (C) EZH2 mRNA and protein expression (IHC), MBD2 mRNA expression, as well as mean methylation levels of PRC2 target genes, HOX genes and genes with GO term ‘Developmental processes’. Data has been partitioned in ten quantiles and color is in ten colors from pink, low expression/methylation to black, high expression/methylation.
Biological context of epitypes
Non-Island CpGs were overrepresented among the CpGs that defined epitypes (). However, some epitype splits were dependent on Island/non-Island categories (Table S2), e.g., the splits between A1 and A2, and C1 and C2. Gene Ontology analysis assigned biological processes to all epitypes, supporting their biological relevance (Table S2). Both gene expression data and pathological evaluation showed that Epitype D is infiltrated by immune cells. The average tumor cell content of Epitype D is low (66%) compared with Epitypes A/B/C (81%, p = 4 × 10⁻⁶), which is mainly attributed to the presence of cells positively stained for CD3 (T-cells), CD68 (myeloid cells), and α smooth muscle actin (fibroblasts) (Table S3). In particular, the CD3 data indicates a stronger presence of T-cells in Epitype D (p = 2x10⁻⁷). Furthermore, a multidimensional scaling analysis of various tissue types revealed Epitype D to show high similarity to blood leukocytes (Fig. S4A). A common methylation pattern among cell types from external studies, such as B-cells, T-cells, monocytes, mesenchymal cells and embryonic stem cells, can be observed (Fig. S5). This pattern is to some extent evident in Epitype D, but not in Epitypes A/B/C (Fig. S5). Epitype D shows demethylation of immune gene CpGs. Notably, the age-related methylation signature defined in blood cellsCitation24 only shows correlation with age within Epitype D (r = 0.4, p = 0.008, Fig. S4B). This further suggests that Epitype D is infiltrated by hematological cells.
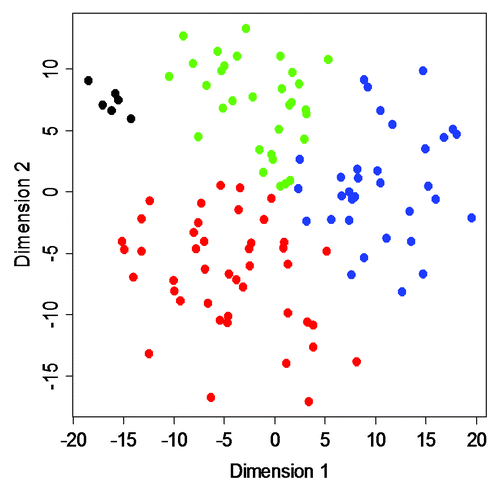
A subsequent MDS analysis revealed Epitype B to differ the most from normal urothelial samples (). The epitypes differ with respect to stage, with Epitypes A and B dominated by non-muscle invasive (NMI) tumors and C and D by muscle-invasive (MI) tumors (p = 2 × 10⁻⁴). With respect to pathological grade, A and B were of lower grade (G1 and G2) and C and D of higher grade (p = 2 × 10⁻⁵) (). Epitypes also differ in disease specific survival as determined by Kaplan-Meier analysis (p = 0.035, logrank test), with Epitype A having good prognosis, B intermediate, and C poor prognosis (Fig. S6). Epitype D was left out from the analysis as the tumor-infiltrating leukocytes/lymphocytes dominated the epitype. At the genomic level, FGFR3 mutations were more frequent in Epitypes A and B (p = 2 × 10⁻⁷). Loss of 9q was enriched in Epitypes A and B (p = 5 × 10⁻⁴) whereas amplification of 6p and the number of focal genomic amplifications (FGA), an indicator of genomic instability, were more frequent in Epitype C (p = 2 × 10⁻³ and p = 3 × 10⁻⁷, respectively) (). TP53 and PIK3CA mutation frequencies did not differ significantly between epitypes. Epitypes A and B were strongly associated to molecular subtype 1 (MS1), and Epitype C and D to molecular subtype 2 (MS2) (p < 10−13), as defined by Lindgren et al.Citation7 (). Hence, the identified UC epitypes are associated with specific genomic and gene alterations, as well as gene expression subtypes, known to be important for UC classification and development.
Figure 5. MDS analysis. A two-dimensional MDS representation of the similarities among tumors. Green, Epitype A samples; blue, Epitype B samples; red, Epitype C samples; black, normal urothelium. Epitype D samples were omitted from the analysis.
EZH2 expression and HOX gene methylation in aggressive tumors
Expression of the Polycomb gene EZH2, the catalytic subunit of the PRC2 complex that keeps embryonic stem cells in an undifferentiated state,Citation25 was assessed both by gene expression and by IHC (Supplemental Material). High EZH2 expression was observed in Epitype C and associated with methylation of PRC2 target genes identified in embryonic stem cellsCitation25 (r = 0.43, p = 5 × 10⁻⁸) (; Fig. S7). EZH2 expression was also correlated with methylation of the remaining genes not targeted by PRC2 (r = 0.37, p = 4 × 10⁻⁶); however, PRC2 target methylation showed additional association with EZH2 expression in a multivariate analysis (p = 0.004). PRC2 target methylation overlaps with methylation of HOX gene family members and with genes defined by the GO term ‘developmental processes’, all of them methylated in Epitype C (). These findings suggest that developmental processes are repressed by DNA methylation in Epitype C, partly regulated by EZH2. In contrast, MBD2, a gene involved in maintaining an unmethylated state, is expressed at higher levels in Epitype A (p = 0.002) (), in line with the observation that Epitype A shows lower levels of methylation and Epitype C shows higher levels of methylation.
Discussion
We performed DNA methylation profiling of urothelial carcinomas with the major aim to detect DNA methylation subtypes, i.e., UC epitypes. The cases were selected from a larger cohort for which gene expression and mutation data, as well as array CGH data for a subset, were available. As array CGH was not available for the whole set we devised a method to obtain relative CpG copy numbers from Illumina’s Methylation27K BeadChip platform. We further observed that copy number alterations modified the β-values by shifting the proportion of true signal to background signal (Supplemental Material). This produces β-value changes and spurious correlations of the β-value to copy number and, consequently, to gene expression, as there is a general correlation between gene copy number and gene expression.Citation26 We corrected for this by subtracting the background signal for each individual probe. In uncorrected data, 13.1% of CpGs were correlated with expression. Background correction resulted in a reduction of associated CpGs to 8.4%. Hence, not properly corrected β-values in data obtained from tumors with genomic alterations may result in overoptimistic correlations.
After correction, we observed biologically meaningful associations between gene copy numbers and methylation states for specific CpGs. In genomic regions frequently gained in UC, we detected CpGs preferentially demethylated or methylated. The biological outcome of these two processes is that gene expression of developmental genes is less sensitive to copy number gains, whereas DNA demethylation for some keratin genes results in increased correlation between gene copy numbers and expression. The extent of these associations may be underestimated in the present data as the applied platform only contains a limited number of CpGs for each gene. Further studies are needed to determine whether the methylation change occurs at the gained allele and whether the change in DNA methylation or the gain in copy number occurs first. Irrespectively, the findings emphasize the dynamic character of DNA methylation and point to a process in which parts of the methylome may interact with changes in the cancer genome.
As expected, when significant association between CpG methylation and expression was seen, the associations were negative, i.e., gene downregulation when methylated, in the majority of the cases. However, for a substantial fraction of the cases CpG methylation was coupled with increased gene expression. Positively associated CpGs were predominantly located in CpG-poor promoters as well as in gene bodies. The association of gene body methylation with transcription is consistent with previous reports.Citation27 In addition, the positively associated CpGs were enriched for being part of specific transcription factor binding sites, of which MYC/MAX/EBOX-related, USF, and CREBBP1 binding sites were among the most prominent. Specific CpG methylation has been found to affect the binding of the cognate transcriptions factors, e.g., MYC/MAX and MAD/MAX,Citation28 NMYC,Citation29 USF,Citation30,Citation31 CREBCitation32 and HIF1.Citation33 How this may induce increased expression is far from clear. The simplest mechanism would be that motif methylation inhibits the binding of a transcriptional repressor.Citation10 In this context, it is notable that MYC may act as a transcriptional repressor by recruiting DNA methyltransferases as co-repressors.Citation34 It is thus conceivable that inactivation of MYC binding could prevent promoter methylation and gene silencing for a subset of genes. In case of the CREB-binding site, it has been shown that the methylated version is bound by C/EBPα whereas the unmethylated version is bound by the CREB protein, resulting in tissue specific gene expression programs.Citation32 Hence, the positive association between CpG methylation and gene expression may be the outcome of several different mechanisms, of which modification of transcription factor binding sites is one. The scale of this effect, in terms of number of affected genes, may at present not be fully appreciated.
We used a bootstrap approach to arrive at four robust Epitypes: A, B, C, and D. Non-Island CpGs were enriched among the epitype-discriminating CpGs, reminiscent of what is seen for human normal tissues that are predominantly discriminated by CpGs on CpG Island shores.Citation35 Epitype D tumors showed a methylation pattern similar to immune cells and were infiltrated by immune cells. On the other hand, non-tumoral cell content is of minor relevance for Epitypes A/B/C. Consequently, Epitype D was not considered a true epitype of UC cells. The epitypes adhere to the two major molecular subtypes of UC.Citation7 Apart from showing distinct methylation patterns, the epitypes differed at the genomic level for alterations common in UC: Epitypes A and B showed frequent FGFR3 mutations and losses of 9q whereas Epitype C showed signs of genomic instability and frequent 6p amplifications. The expression of EZH2, a regulator of polycomb targets and a major inhibitor of differentiation, showed increased expression in Epitype C, as determined both by mRNA and protein expression. EZH2 expression was strongly associated with DNA methylation of polycomb target genes, PRC2 targets, and with genes described by the GO term “development.” This suggests that an epigenetic program has been activated, or preserved, that promotes a more undifferentiated state in Epitype C cells. This is line with the finding that Epitype C is associated with bad prognosis.
The presence of possible urothelial cancer epitypes has been suggested in previous investigations. Wolff et al. associated specific DNA methylation profiles to bladder cancer tumor stage.Citation19 On the same platform Wilhelm-Bernartzi et al. could delineate four DNA methylation subtypes, of which two were associated with invasive cases.Citation20 However, these investigations were limited to a small number of CpG positions by the use of the Illumina Golden Gate platform. Also, the results of Kandimalla et al., using a CpG Island based platform, point to the possible presence of several DNA methylation subtypes.Citation36 Our investigation differs from the previous ones in that: first, we used a more comprehensive CpG platform that includes both Island and non-Island CpGs; second, we set out to define DNA methylation subtypes, epitypes, independent of pathological classification and; third, we integrate the epigenetic data with gene expression and gene copy number data. Both Wolff et al. and Kandimalla et al. show that genes methylated in tumor samples compared with normal samples are predominantly polycomb target genes. We were able to expand these results and show that, in fact, polycomb target methylation is a feature of the most aggressive epitype.
The importance of DNA methylation for HOX gene regulation became obvious from several of the analyses performed. The HOXA, -B, and –D clusters were among the hyper-variable regions detected in our data. The same regions have been described by Vallot et al.Citation18 as regions with coordinated gene expression in absence of genomic alterations, regulated by chromatin modification. The distinct behavior of the three HOX gene families emphasizes their importance in bladder cancer development. The link between Epitype C and cellular differentiation was also seen in the behavior of several HOX genes that showed increased methylation associated with decreased gene expression. Furthermore, members from these HOX gene clusters showed an on-state in Epitypes A and B, and an off-state in Epitype C. The downregulation of HOX genes in Epitype C implies that HOX gene expression may suppress aggressive growth. HOXB2 has, in line with this, been reported to be hypermethylated in aggressive UC tumors.Citation37 A similar association between HOX gene methylation inactivation and aggressive growth has been reported for breast cancer,Citation38 ovarian cancerCitation39 and leukemias.Citation40 A further indication of the suggested tumor suppressor like activity of the HOX genes was the observed methylation of HOXB4, -B5 and -B8 genes when gained. Notably, HOX genes are repressed in pluripotent cells and activated upon differentiation.Citation41 Repression of HOX genes in Epitype C may thus facilitate tumor evolution toward a more stem cell-like behavior. Taken together, our findings highlight HOX gene silencing and EZH2 expression as important mechanisms to maintain UC in an undifferentiated and more aggressive state.
In conclusion, we have highlighted two aspects of DNA methylation. First, the association between gene copy numbers and DNA methylation and, second, the possible activation of genes through site specific methylation of transcription factor bindings sites. These findings emphasize the dynamic behavior of the cancer methylome. In addition, we show that UC consists of distinct DNA methylation subtypes, epitypes, that are related to pathological staging and grading as well as molecular subtypes.Citation7 We believe that detailed understanding of the UC methylome dynamics and epitypes combined with data on the transcriptomic and genomic levels will enable the precise classification of UC into tumor subtypes of importance for clinical behavior and treatment response.
Materials and Methods
Samples
We assayed 149 tumors from 149 patients, 53 Ta, 45 T1 and 51 MI tumors, for genome-wide methylation analysis using the Illumina Infinium HumanMethylation27K BeadChip. As controls, we used 3 technical replicates of one tumor sample and 6 samples from normal bladder urothelium without bladder cancer history. Informed consent was obtained from all patients; the study has been approved by the local ethics committee. Tumor cell content for 133 of 149 samples was obtained from adjacent 1mm tissue microarray cores. The proportion of tumor cells for Epitypes A, B, C and D is on average 85%, 85%, 76% and 66% respectively (Table S3). For details on sample preparation and hybridization see Supplemental Material. Raw intensities for methylated and unmethylated probes of each CpG site were extracted from Illumina’s GenomeStudio, available at the Gene Expression Omnibus (GSE33510). Genome wide expression data were available for all samples (GSE32894). Array CGH data were available for 68 tumor samples (GSE32549).
Preprocessing of methylation data
In line with a previous report, we find β-values of low-varying CpGs to be influenced by copy numbers (Supplemental Material).Citation42 This is, however, caused by probe-specific background rather than Illumina’s constant offset of 100 as suggested previously,Citation42 and has an impact on β-values on a large scale. Consequently, we aimed to subtract the probe-specific background. Probe-specific background was estimated using the unmethylated channel from hybridizations of SssI methylated control DNAs, and then subtracted from the data to obtain M' (methylated) and U' (unmethylated) signals (Supplemental Material). Values below zero were set to zero and 2,524 sites with (mean (M'+U') < 3,000 were removed from the data. Beta values were calculated as β = M'/(M'+U'), not using Illumina’s offset. Missing values were imputed using k-nearest neighbor imputation (k = 10).Citation43 Batch effects induced by bisulfite-treatment were adjusted (Supplemental Material). CpGs located in chromosomes X and Y were removed from the subsequent analyses to obtain the final β-value matrix. For the definition of epitypes, the top 25% CpGs in β-value variation across tumors were used, and for integration with copy number data, CpGs with β-value variance > 0.02 were considered. Chromosome X and Y CpGs were included for copy number analysis.
Copy number data from Methylation27K BeadChip
The overall intensity for each CpG site reflects the copy number level described by I = U+M. To account for dye specific signal intensity the data was quantile-normalized with respect to the dye-channels.Citation44 The sites were calibrated using samples with normal copy numbers (Supplemental Material) and then adjusted for batch effects (Supplemental Material). For each sample the data was segmented using the CBS algorithm,Citation45 and a sample-adaptive threshold (SAT) was calculated to obtain a sample-specific cut-off for calling of amplifications and deletions.Citation46
Definition of CpG Islands, hyper-variable regions and epitypes
We used Illumina’s CpG Island definition that is based on NCBIs relaxed Island definition.Citation47 For identification of hyper-variable regions only the CpG with highest β-value variation for each gene was included. To call significant hyper-variable regions, we calculated the 0.995 and 0.005 quantiles for each chromosome, obtained from smoothing values of 500 data sets with reshuffled genome positions; i.e., values above and below these quantiles are of p value < 0.01. The epitypes were identified using hierarchical clustering analyses (HCA) of 2000 bootstrapped data sets as previously described by Lindgren et al.Citation7 (Supplemental Material).
Gene signatures
CpGs with age-related methylation changes were obtained from Teschendorff et al.Citation24 PRC2 target gene signature was obtained from Lee et al.Citation25 Genes with GO term “developmental processes” were retrievedCitation48 and genes with the GO term “cell cycle” removed prior to analysis.
Identification of transcription factor binding sites
Correlation analysis of methylation to gene expression levels was compared with permuted data sets to obtain false discovery rates (Supplemental Material). We used MEME for motif discovery in positively correlated CpGs, with the respective CpG sites +/− 5 bp as input (MEME settings 4 to 8 bp motif).Citation49 To further characterize the genomic CpG context we re-annotated the CpGs in respect to promoters (transcription start site -1,500 to +500) and gene bodies (transcriptions start site +501 to transcription termination site -500). We used the SMART algorithm to characterize transcription factor binding sites overlapping the CpGs.Citation50 We extracted the flanking genomic sequence (+/−25 bp) for each CpG and analyzed both strands for the presence of high scoring transcription factor (TF) binding motifs in at least one strand (SMART settings CSS = 1.0, MSS ≥ 0.9). We filtered the hits in order to identify core motifs overlapping the Illumina CpG-site by at least one base. In this analysis no distinctions were made between different position weight matrices for the same transcription factor, e.g., MYC_01, MYC_02, and MYC_03. As background list for binding site enrichment analysis we employed the genes used for correlation analysis between methylation and expression levels.
| Abbreviations: | ||
| CpG | = | CG-dinucleotide |
| CGI | = | CpG-Island |
| fdr | = | false discovery rate |
| FGA | = | focal genomic amplifications |
| GO | = | Gene Ontology |
| HCA | = | hierarchical cluster analysis |
| IHC | = | immunohistochemistry |
| MI | = | muscle-invasive |
| MS | = | molecular subtype |
| NMI | = | non-muscle invasive, PRC2, Polycomb Repressive Complex 2 |
| SAT | = | sample adaptive threshold |
| TF | = | transcription factor |
| UC | = | urothelial carcinoma |
Additional material
Download Zip (4.9 MB)Acknowledgments
MH would like to thank participants in the Epigenetics – medical, nutritional, social, legal and ethical consequences theme organized by the Pufendorf Institute for Advanced Studies in Lund for valuable discussions before conducting this investigation. This work was supported by The Swedish Research Council, The Swedish Cancer Foundation, The Gunnar Nilsson foundation, BioCARE, and The Maja and Hjalmar Leanders foundation.
Disclosure of Potential Conflicts of Interest
No potential conflicts of interest are disclosed.
Related Research Data
References
- Avritscher EBC, Cooksley CD, Grossman HB, Sabichi AL, Hamblin L, Dinney CP, et al. Clinical model of lifetime cost of treating bladder cancer and associated complications. Urology 2006; 68:549 - 53; http://dx.doi.org/10.1016/j.urology.2006.03.062; PMID: 16979735
- Sjödahl G, Lauss M, Gudjonsson S, Liedberg F, Halldén C, Chebil G, et al. A systematic study of gene mutations in urothelial carcinoma; inactivating mutations in TSC2 and PIK3R1. PLoS One 2011; 6:e18583; http://dx.doi.org/10.1371/journal.pone.0018583; PMID: 21533174
- Blaveri E, Brewer JL, Roydasgupta R, Fridlyand J, DeVries S, Koppie T, et al. Bladder cancer stage and outcome by array-based comparative genomic hybridization. Clin Cancer Res 2005; 11:7012 - 22; http://dx.doi.org/10.1158/1078-0432.CCR-05-0177; PMID: 16203795
- Blaveri E, Simko JP, Korkola JE, Brewer JL, Baehner F, Mehta K, et al. Bladder cancer outcome and subtype classification by gene expression. Clin Cancer Res 2005; 11:4044 - 55; http://dx.doi.org/10.1158/1078-0432.CCR-04-2409; PMID: 15930339
- Sanchez-Carbayo M, Socci ND, Lozano J, Saint F, Cordon-Cardo C. Defining molecular profiles of poor outcome in patients with invasive bladder cancer using oligonucleotide microarrays. J Clin Oncol 2006; 24:778 - 89; http://dx.doi.org/10.1200/JCO.2005.03.2375; PMID: 16432078
- Dyrskjøt L, Zieger K, Real FX, Malats N, Carrato A, Hurst C, et al. Gene expression signatures predict outcome in non-muscle-invasive bladder carcinoma: a multicenter validation study. Clin Cancer Res 2007; 13:3545 - 51; http://dx.doi.org/10.1158/1078-0432.CCR-06-2940; PMID: 17575217
- Lindgren D, Frigyesi A, Gudjonsson S, Sjödahl G, Hallden C, Chebil G, et al. Combined gene expression and genomic profiling define two intrinsic molecular subtypes of urothelial carcinoma and gene signatures for molecular grading and outcome. Cancer Res 2010; 70:3463 - 72; http://dx.doi.org/10.1158/0008-5472.CAN-09-4213; PMID: 20406976
- Esteller M. Epigenetic gene silencing in cancer: the DNA hypermethylome. Hum Mol Genet 2007; 16:Spec No 1 R50 - 9; http://dx.doi.org/10.1093/hmg/ddm018; PMID: 17613547
- Hansen KD, Timp W, Bravo HC, Sabunciyan S, Langmead B, McDonald OG, et al. Increased methylation variation in epigenetic domains across cancer types. Nat Genet 2011; 43:768 - 75; http://dx.doi.org/10.1038/ng.865; PMID: 21706001
- Veerla S, Panagopoulos I, Jin Y, Lindgren D, Höglund M. Promoter analysis of epigenetically controlled genes in bladder cancer. Genes Chromosomes Cancer 2008; 47:368 - 78; http://dx.doi.org/10.1002/gcc.20542; PMID: 18196590
- Weber M, Hellmann I, Stadler MB, Ramos L, Pääbo S, Rebhan M, et al. Distribution, silencing potential and evolutionary impact of promoter DNA methylation in the human genome. Nat Genet 2007; 39:457 - 66; http://dx.doi.org/10.1038/ng1990; PMID: 17334365
- Holm K, Hegardt C, Staaf J, Vallon-Christersson J, Jönsson G, Olsson H, et al. Molecular subtypes of breast cancer are associated with characteristic DNA methylation patterns. Breast Cancer Res 2010; 12:R36; http://dx.doi.org/10.1186/bcr2590; PMID: 20565864
- Van der Auwera I, Yu W, Suo L, Van Neste L, van Dam P, Van Marck EA, et al. Array-based DNA methylation profiling for breast cancer subtype discrimination. PLoS One 2010; 5:e12616; http://dx.doi.org/10.1371/journal.pone.0012616; PMID: 20830311
- Fang F, Turcan S, Rimner A, Kaufman A, Giri D, Morris LGT, et al. Breast cancer methylomes establish an epigenomic foundation for metastasis. Sci Transl Med 2011; 3:75ra25; http://dx.doi.org/10.1126/scitranslmed.3001875; PMID: 21430268
- Hinoue T, Weisenberger DJ, Lange CPE, Shen H, Byun H-M, Van Den Berg D, et al. Genome-scale analysis of aberrant DNA methylation in colorectal cancer. Genome Res 2012; 22:271 - 82; http://dx.doi.org/10.1101/gr.117523.110; PMID: 21659424
- Martin-Subero JI, Ammerpohl O, Bibikova M, Wickham-Garcia E, Agirre X, Alvarez S, et al. A comprehensive microarray-based DNA methylation study of 367 hematological neoplasms. PLoS One 2009; 4:e6986; http://dx.doi.org/10.1371/journal.pone.0006986; PMID: 19750229
- Stransky N, Vallot C, Reyal F, Bernard-Pierrot I, de Medina SGD, Segraves R, et al. Regional copy number-independent deregulation of transcription in cancer. Nat Genet 2006; 38:1386 - 96; http://dx.doi.org/10.1038/ng1923; PMID: 17099711
- Vallot C, Stransky N, Bernard-Pierrot I, Hérault A, Zucman-Rossi J, Chapeaublanc E, et al. A novel epigenetic phenotype associated with the most aggressive pathway of bladder tumor progression. J Natl Cancer Inst 2011; 103:47 - 60; http://dx.doi.org/10.1093/jnci/djq470; PMID: 21173382
- Wolff EM, Chihara Y, Pan F, Weisenberger DJ, Siegmund KD, Sugano K, et al. Unique DNA methylation patterns distinguish noninvasive and invasive urothelial cancers and establish an epigenetic field defect in premalignant tissue. Cancer Res 2010; 70:8169 - 78; http://dx.doi.org/10.1158/0008-5472.CAN-10-1335; PMID: 20841482
- Wilhelm-Benartzi CS, Koestler DC, Houseman EA, Christensen BC, Wiencke JK, Schned AR, et al. DNA methylation profiles delineate etiologic heterogeneity and clinically important subgroups of bladder cancer. Carcinogenesis 2010; 31:1972 - 6; http://dx.doi.org/10.1093/carcin/bgq178; PMID: 20802236
- Reinert T, Modin C, Castano FM, Lamy P, Wojdacz TK, Hansen LL, et al. Comprehensive genome methylation analysis in bladder cancer: identification and validation of novel methylated genes and application of these as urinary tumor markers. Clin Cancer Res 2011; 17:5582 - 92; http://dx.doi.org/10.1158/1078-0432.CCR-10-2659; PMID: 21788354
- Schlesinger Y, Straussman R, Keshet I, Farkash S, Hecht M, Zimmerman J, et al. Polycomb-mediated methylation on Lys27 of histone H3 pre-marks genes for de novo methylation in cancer. Nat Genet 2007; 39:232 - 6; http://dx.doi.org/10.1038/ng1950; PMID: 17200670
- Du P, Zhang X, Huang C-C, Jafari N, Kibbe WA, Hou L, et al. Comparison of Beta-value and M-value methods for quantifying methylation levels by microarray analysis. BMC Bioinformatics 2010; 11:587; http://dx.doi.org/10.1186/1471-2105-11-587; PMID: 21118553
- Teschendorff AE, Menon U, Gentry-Maharaj A, Ramus SJ, Weisenberger DJ, Shen H, et al. Age-dependent DNA methylation of genes that are suppressed in stem cells is a hallmark of cancer. Genome Res 2010; 20:440 - 6; http://dx.doi.org/10.1101/gr.103606.109; PMID: 20219944
- Lee TI, Jenner RG, Boyer LA, Guenther MG, Levine SS, Kumar RM, et al. Control of developmental regulators by Polycomb in human embryonic stem cells. Cell 2006; 125:301 - 13; http://dx.doi.org/10.1016/j.cell.2006.02.043; PMID: 16630818
- Heidenblad M, Lindgren D, Jonson T, Liedberg F, Veerla S, Chebil G, et al. Tiling resolution array CGH and high density expression profiling of urothelial carcinomas delineate genomic amplicons and candidate target genes specific for advanced tumors. BMC Med Genomics 2008; 1:3; http://dx.doi.org/10.1186/1755-8794-1-3; PMID: 18237450
- Ball MP, Li JB, Gao Y, Lee J-H, LeProust EM, Park I-H, et al. Targeted and genome-scale strategies reveal gene-body methylation signatures in human cells. Nat Biotechnol 2009; 27:361 - 8; http://dx.doi.org/10.1038/nbt.1533; PMID: 19329998
- James L, Eisenman RN. Myc and Mad bHLHZ domains possess identical DNA-binding specificities but only partially overlapping functions in vivo. Proc Natl Acad Sci U S A 2002; 99:10429 - 34; http://dx.doi.org/10.1073/pnas.162369299; PMID: 12149476
- Perini G, Diolaiti D, Porro A, Della Valle G. In vivo transcriptional regulation of N-Myc target genes is controlled by E-box methylation. Proc Natl Acad Sci U S A 2005; 102:12117 - 22; http://dx.doi.org/10.1073/pnas.0409097102; PMID: 16093321
- Fujii G, Nakamura Y, Tsukamoto D, Ito M, Shiba T, Takamatsu N. CpG methylation at the USF-binding site is important for the liver-specific transcription of the chipmunk HP-27 gene. Biochem J 2006; 395:203 - 9; http://dx.doi.org/10.1042/BJ20051802; PMID: 16396632
- Qiao H, May JM. CpG methylation at the USF-binding site mediates cell-specific transcription of human ascorbate transporter SVCT2 exon 1a. Biochem J 2011; 440:73 - 84; http://dx.doi.org/10.1042/BJ20110392; PMID: 21770893
- Rishi V, Bhattacharya P, Chatterjee R, Rozenberg J, Zhao J, Glass K, et al. CpG methylation of half-CRE sequences creates C/EBPalpha binding sites that activate some tissue-specific genes. Proc Natl Acad Sci U S A 2010; 107:20311 - 6; http://dx.doi.org/10.1073/pnas.1008688107; PMID: 21059933
- Rössler J, Stolze I, Frede S, Freitag P, Schweigerer L, Havers W, et al. Hypoxia-induced erythropoietin expression in human neuroblastoma requires a methylation free HIF-1 binding site. J Cell Biochem 2004; 93:153 - 61; http://dx.doi.org/10.1002/jcb.20133; PMID: 15352172
- Brenner C, Deplus R, Didelot C, Loriot A, Viré E, De Smet C, et al. Myc represses transcription through recruitment of DNA methyltransferase corepressor. EMBO J 2005; 24:336 - 46; http://dx.doi.org/10.1038/sj.emboj.7600509; PMID: 15616584
- Irizarry RA, Ladd-Acosta C, Wen B, Wu Z, Montano C, Onyango P, et al. The human colon cancer methylome shows similar hypo- and hypermethylation at conserved tissue-specific CpG island shores. Nat Genet 2009; 41:178 - 86; http://dx.doi.org/10.1038/ng.298; PMID: 19151715
- Kandimalla R, van Tilborg AAG, Kompier LC, Stumpel DJPM, Stam RW, Bangma CH, et al. Genome-wide Analysis of CpG Island Methylation in Bladder Cancer Identified TBX2, TBX3, GATA2, and ZIC4 as pTa-Specific Prognostic Markers. Eur Urol 2012; 61:1245 - 56; http://dx.doi.org/10.1016/j.eururo.2012.01.011; PMID: 22284968
- Marsit CJ, Houseman EA, Christensen BC, Gagne L, Wrensch MR, Nelson HH, et al. Identification of methylated genes associated with aggressive bladder cancer. PLoS One 2010; 5:e12334; http://dx.doi.org/10.1371/journal.pone.0012334; PMID: 20808801
- Fackler MJ, Umbricht CB, Williams D, Argani P, Cruz L-A, Merino VF, et al. Genome-wide methylation analysis identifies genes specific to breast cancer hormone receptor status and risk of recurrence. Cancer Res 2011; 71:6195 - 207; http://dx.doi.org/10.1158/0008-5472.CAN-11-1630; PMID: 21825015
- Fiegl H, Windbichler G, Mueller-Holzner E, Goebel G, Lechner M, Jacobs IJ, et al. HOXA11 DNA methylation--a novel prognostic biomarker in ovarian cancer. Int J Cancer 2008; 123:725 - 9; http://dx.doi.org/10.1002/ijc.23563; PMID: 18478570
- Strathdee G, Holyoake TL, Sim A, Parker A, Oscier DG, Melo JV, et al. Inactivation of HOXA genes by hypermethylation in myeloid and lymphoid malignancy is frequent and associated with poor prognosis. Clin Cancer Res 2007; 13:5048 - 55; http://dx.doi.org/10.1158/1078-0432.CCR-07-0919; PMID: 17785556
- Atkinson SP, Koch CM, Clelland GK, Willcox S, Fowler JC, Stewart R, et al. Epigenetic marking prepares the human HOXA cluster for activation during differentiation of pluripotent cells. Stem Cells 2008; 26:1174 - 85; http://dx.doi.org/10.1634/stemcells.2007-0497; PMID: 18292213
- Houseman EA, Christensen BC, Karagas MR, Wrensch MR, Nelson HH, Wiemels JL, et al. Copy number variation has little impact on bead-array-based measures of DNA methylation. Bioinformatics 2009; 25:1999 - 2005; http://dx.doi.org/10.1093/bioinformatics/btp364; PMID: 19542153
- Troyanskaya O, Cantor M, Sherlock G, Brown P, Hastie T, Tibshirani R, et al. Missing value estimation methods for DNA microarrays. Bioinformatics 2001; 17:520 - 5; http://dx.doi.org/10.1093/bioinformatics/17.6.520; PMID: 11395428
- Smyth GK Linear models and empirical bayes methods for assessing differential expression in microarray experiments. Stat Appl Genet Mol Biol 2004; 3:Article3.
- Venkatraman ES, Olshen AB. A faster circular binary segmentation algorithm for the analysis of array CGH data. Bioinformatics 2007; 23:657 - 63; http://dx.doi.org/10.1093/bioinformatics/btl646; PMID: 17234643
- Staaf J, Jönsson G, Ringnér M, Vallon-Christersson J. Normalization of array-CGH data: influence of copy number imbalances. BMC Genomics 2007; 8:382; http://dx.doi.org/10.1186/1471-2164-8-382; PMID: 17953745
- Bibikova M, Le J, Barnes B, Saedinia-Melnyk S, Zhou L, Shen R, et al. Genome-wide DNA methylation profiling using Infinium® assay. Epigenomics 2009; 1:177 - 200; http://dx.doi.org/10.2217/epi.09.14; PMID: 22122642
- Ashburner M, Ball CA, Blake JA, Botstein D, Butler H, Cherry JM, et al, The Gene Ontology Consortium. Gene ontology: tool for the unification of biology. Nat Genet 2000; 25:25 - 9; http://dx.doi.org/10.1038/75556; PMID: 10802651
- Bailey TL, Boden M, Buske FA, Frith M, Grant CE, Clementi L, et al. MEME SUITE: tools for motif discovery and searching. Nucleic Acids Res 2009; 37:Web Server issue W202-8; http://dx.doi.org/10.1093/nar/gkp335; PMID: 19458158
- Veerla S, Ringnér M, Höglund M. Genome-wide transcription factor binding site/promoter databases for the analysis of gene sets and co-occurrence of transcription factor binding motifs. BMC Genomics 2010; 11:145; http://dx.doi.org/10.1186/1471-2164-11-145; PMID: 20193056