Abstract
LBH589 is one of the many histone deacetylase inhibitors (HDACi) that are currently in clinical trial. Despite their wide-spread use, there is little literature available describing the typical levels of histone acetylation in untreated peripheral blood, the treatment and storage of samples to retain optimal measurement of histone acetylation nor methods by which histone acetylation analysis may be monitored and measured during the course of a patient’s treatment. In this study, we have used cord or peripheral blood as a source of human leukocytes, performed a comparative analysis of sample processing methods and developed a flow cytometric method suitable for monitoring histone acetylation in isolated lymphocytes and liquid tumors. Western blotting and immunohistochemistry techniques have also been addressed. We have tested these methods on blood samples collected from four patients treated with LBH589 as part of an Australian Children’s Cancer Clinical Trial (CLBH589AAU03T) and show comparable results when comparing in vitro and in vivo data. This paper does not seek to correlate histone acetylation levels in peripheral blood with clinical outcome but describes methods of analysis that will be of interest to clinicians and scientists monitoring the effects of HDACi on histone acetylation in blood samples in clinical trials or in related research studies.
Introduction
Only 2–15% of transcriptionally active genes are regulated by the histone acetylation state of their promoter and many of these genes are active in cell cycle control and apoptosis.Citation1 Modulating the cellular histone acetylation/deacetylation state using specific inhibitors to histone deacetylases represents a potential approach for cancer therapy. Inhibitors of histone deacetylases (HDACi) are anticancer agents with the potential to alter gene expression and induce cell death, differentiation and/or cell cycle arrest in tumor cells by inducing histone hyperacetylation. In vitro and in vivo studies have shown that HDACi, while relatively non-toxic to normal cells, have selective toxicity against tumor cell linesCitation2. Many of these compounds are derivatives of hydroxamic acid and inhibit HDAC activity by blocking the catalytic site.
Almost all HDACi can induce cell cycle arrest, differentiation or apoptosis in vitro, and many have potent anti-tumor activities in vivo, e.g., TSA, MS-27–275, Romidepsin, PXD101, PCI-24781, ITF2357, MGCD0103, MS-275, SAHA, valproic acid and LBH589.Citation3-Citation6 Additionally, many HDACi are active in the absence of wild type p53 expression.Citation7 Several HDACi are in Phase I and II clinical trials and some are in Phase III trials or already in therapeutic use for hematological malignancies (e.g., SAHACitation8 and RomidepsinCitation9). An important advantage of HDACi is their hydrophobic structure that allows them to pass the blood–brain barrier suggesting they may be valuable therapeutics for CNS malignancies.
Despite the increasingly wide-spread use of HDACi in clinical trials there is little literature available describing the methods by which histone acetylation analysis may be monitored and measured during the course of a patient’s treatment, how samples should be treated and stored to retain optimal measurement of histone acetylation, nor any detailed information on typical levels of histone acetylation in untreated peripheral blood. Although the therapeutic actions of HDACi are directed at tumors, these are not always available for direct or continuous assessment, whereas blood is more easily accessible to monitor a patient’s dose response to an HDACi. Furthermore, methods of analysis in peripheral blood are also likely to be applicable to liquid tumors including the leukemias, myelodysplastic syndromes and disseminated solid tumors.
We have used cord or peripheral blood as a source of human leukocytes, and have performed a comparative analysis of blood sample processing methods and their impact on histone acetylation as well as developing a flow cytometric method for the analysis of histone acetylation in isolated leukocytes. We have extended our analyses on the in vitro effects of LBH589 on histone acetylation and describe data for histone acetylation in blood from four patients treated with a single infusion of LBH589 as part of an ongoing Phase 1 clinical trial examining the safety, pharmacokinetics and effectiveness of LBH589 against refractory solid tumors of childhood. This study will be of interest to clinicians and scientists monitoring the effects of HDACi in blood in clinical trials or in related research studies.
Results
Effect of sample processing on leukocyte acetylation and detection of histone acetylation by western blotting
In order to determine whether histone acetylation could be lost from leukocytes during processing, 2 x 10⁷ leukocytes, separated from their original blood source by either red cell lysis or Ficoll-Paque, were incubated with 100 nM LBH589 in RPMI for 24 h at 37°C in vitro to promote histone acetylation. Equivalent incubations were set up as controls in 0.1% DMSO in RPMI. Cells from each incubation, were counted and divided into equal parts comprising 1 x 10⁷ cells. One cell aliquot comprising 1 x 10⁷ cells was placed back into separated cord blood depleted of leukocytes by centrifugation, and processed immediately either by Ficoll-Paque or red cell lysis, and the cells collected. The paired control cells, comprising 1 x 10⁷ cells, were collected by centrifugation and stored at the same time. All cell pellets were stored at -80°C for up to nine weeks and then lysed for western blotting. This experiment was designed to both mimic the conditions a clinical blood sample might be exposed to in a patient treated with an HDACi, and to examine the effect of blood processing and storage on the retention of histone acetylation in leukocytes. All stored leukocyte cell pellets were lysed in protein lysis buffer and examined by western blotting (). Acetylated histone H3 was detected as a band at approximately 16 KDa and acetylated histone H4 at 12 KDa. The loading control was β−actin, migrating at 42 KDa. The leukemia cell line 697 treated with 100 nM LBH589 served as a positive control. For quantitative analysis of histone acetylation, western blot membranes were scanned and adjusted for concentration variations by normalization to the reference protein β−actin. The DMSO data were subtracted from the data generated from LBH589 treatments. The positive control sample from the 697 leukemia cell line was assigned a value of 1.0 and all other data adjusted relative to this value. The results are shown in .
Figure 1. Western blot showing histone H3 and H4 acetylation in leukocytes separated by (A) Ficoll-Paque PLUS, or (B) red cell lysis. 20µg of protein was loaded in each lane of 15% SDS-PAGE gels. Rabbit anti-acetyl histone H3 detected a protein band at approximately 16 KDa and rabbit anti-acetyl histone H4 detected a band at 12KDa; mouse anti-β actin (the loading control) recognized a protein band at 42 KDa. The secondary antibody anti-mouse Cy3 has red fluorescence and the anti-rabbit Cy5 has green fluorescence. Lane 1, size marker. Lane 2, pre-treatment leukocytes separated by Ficoll-Paque or red cell lysis. Lane 3, 0.1% DMSO treated for 24 h. Lane 4, 100 nM LBH589 treated for 24 h. Lane 5, DMSO treated post-separation from leukocyte-depleted blood. Lane 6, LBH589 treated post-separation from leukocyte-depleted blood. Lane 7; Control 697 cells incubated with 100 nM LBH589 for 24 h.
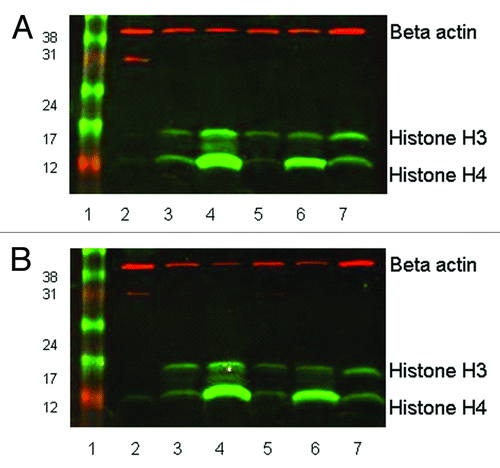
Figure 2. Quantitative analysis of acetylation from western blotting. Bands representing acetylated histone were adjusted for β-actin intensity and normalized to those of the positive control, LBH589-treated 697 leukemia cells. Data are shown for anti-acetylated histone H3 and H4 on cells extracted by (A) Ficoll-Paque PLUS and (B) red cell lysis. Day 0 indicates the pre-treatment sample. Lanes labeled as 1st extraction represent post-incubation leukocytes treated with 100 nM LBH589 for 24 h and 2nd extraction represent leukocytes treated with LBH589 for 24 h and then re-separated from leukocyte depleted blood
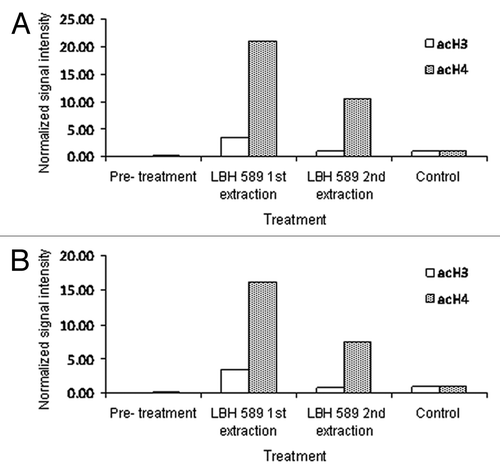
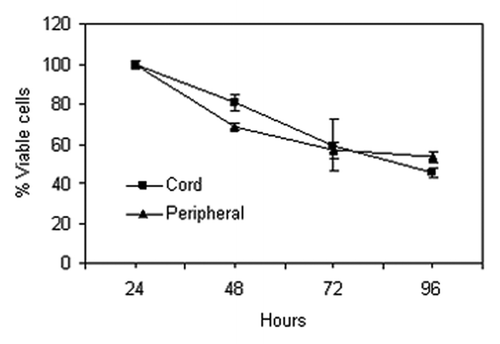
These data show, first, that while the levels of histone H3 and H4 acetylation in normal untreated blood are low, histone H4 acetylation levels are consistently higher than histone H3 acetylation and that post LBH589 treatment significant increases in both histone H3 and H4 acetylation are detectable by western blotting. Second, there are few differences in histone H3 and H4 acetylation between blood processed by either red cell lysis or Ficoll-Paque. This suggests that mononuclear cells (Ficoll-Paque PLUS) and leukocytes (red cell lysis) have similar levels of nuclear histone acetylation. Third, after storage of leukocyte and mononuclear cell pellets for eight weeks at -80°C, histone acetylation is still detectable. However, histone acetylation is reduced by the re-introduction of leukocytes into cord blood, independently of the processing method. This reduction in histone acetylation is unlikely to be due to loss of cell viability, as the cells re-introduced to blood prior to processing were stored with their paired unprocessed control sample for an equivalent period of time and under identical conditions. The differences may be due to the lability of histone acetylation in the blood milieu. In support of this, preliminary studies suggested that increased histone acetylation was not detectable in isolated leukocytes after the direct application of 100 nM LBH589 in vitro to cord or peripheral blood. This does not appear to be due to a loss of cell viability because preliminary studies on whole blood show that the majority of both cord and peripheral blood cells retain viability for at least 72 h (). It may be due to the fact that leukocytes, outside the body, in conditions under which they are no longer actively metabolizing, are unable to continue to acetylate histone and that in certain conditions histones may become deacetylated.
Figure 3. Percentage of live leukocytes in cord (squares) and peripheral blood (triangles) serially isolated over four days. Error bars represent the standard error from triplicate analyses.
Qualitative analysis of histone acetylation in leukocytes
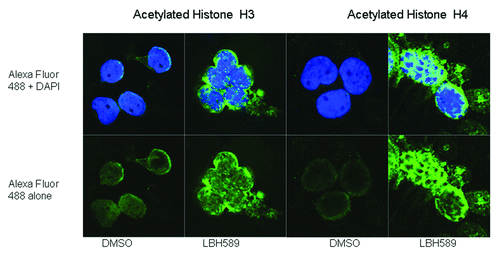
Mononuclear cells were separated from cord blood by Ficoll-Paque, incubated for 24 h with 100 nM LBH589 or 0.1% DMSO in RPMI, cyto-spun onto slides and acetylation detected using anti-acetylated histone H3 or anti-acetylated histone H4 antibodies. The cells were viewed using confocal microscopy and digitized images are shown in . Histone acetylation was readily detectable by this method; however, differences in the localization of acetylated histone H3 and histone H4 were noted. Histone H3 acetylation was more localized to the periphery of the nucleus and was quite diffuse within the body of the nucleus, whereas acetylated histone H4 was more concentrated within the nucleus. The qualitative differences in histone H3 and histone H4 acetylation detected by western blotting were also confirmed using this method.
Figure 4. Immunohistochemistry. Histone acetylation in leukocytes was detected with rabbit anti-acetylated histone H3 and histone H4 antibodies with anti-rabbit Alexa Fluor 488 as the secondary antibody. Cells were counterstained with the nuclear DNA intercalating dye, DAPI. The upper panel of cells shows the merge of the green Alexa Fluor 488 acetylated histone staining with the blue nuclear DAPI stain, and the lower panels, acetylated histone staining alone. Histone H3 acetylation is less intense and localized to the periphery of the nucleus whereas Histone H4 acetylation is more intense and concentrated within the nucleus.
Detection of histone acetylation by flow cytometry and effect of cell storage on histone acetylation
A flow cytometry method, extending that described in Ronzoni et al.,Citation10 was developed to monitor histone acetylation. Blood leukocytes in culture were treated with 100 nM LBH589 for 24 h and histone acetylation was then examined over a total period of 96 h to monitor any changes in histone acetylation occurring during the storage of un-fixed cells at 4°C. The procedure was repeated and cells stored at 20°C and 37°C to determine the effect of different temperature storage conditions on histone acetylation. Leukocytes were separated from 5 mL buffy coat blood by red cell lysis, and a sample of 8 x 10⁵ cells was fixed in 1% paraformaldehyde and stored at 4°C (pre-treatment sample). The remaining leukocytes were incubated in RPMI/10% FBS at a concentration of 107 cells/mL with either 100 nM LBH589, or 0.1% DMSO, for 24 h. After the 24 h treatment, the cells were washed in RPMI/10% FBS and aliquots of 8 x 10⁵ cells were fixed in 1% paraformaldehyde for analysis (0 h storage time point). The remaining cells were stored unfixed at 4°C, and at 20°C and 37°C in RPMI/10% FBS for up to 96 h. Aliquots of the cells kept at 4°C, 20°C or 37°C were then fixed for analysis at 24, 48, 72 and 96 h time points. The fixed cells were exposed to anti-acetylated histone antibodies, followed by incubation with the secondary antibody, donkey anti-rabbit IgG (H+L) Alexa Fluor 488. Data were collected using the BD FACSDiva software and analyzed using the software package FCS Express Research Edition. DMSO diluent data at each time point was histogram subtracted from 100 nM LBH589 data of peripheral blood leukocytes using the analysis program FCS Express. The results are presented in .
Figure 5. Analysis of histone acetylation by flow cytometry. Mean fluorescence values obtained from triplicate data sets of both median and mean fluorescence calculations for acetylated histone H3 or histone H4, obtained from flow cytometry. Standard error of the statistical mean is indicated by the error bars. The y-axis shows the relative fluorescence intensity. DMSO diluent data were histogram subtracted from that of cells incubated with 100 nM LBH589 and stored for the designated times. Cells were fixed post-separation of the buffy coat (pre-treatment), 24 h after DMSO or LBH589 incubation (0 time), and thereafter at 24, 48, 72 and 96 h storage at 4°C, 20°C or 37°C. The fixed cells were stained for histone H3 and histone H4 acetylation and analyzed by flow cytometry. 697 cells incubated with LBH589 for 24 h were included as controls. White bars represent histone acetylation data after incubation at 4°C, gray bars 20°C and black bars 37°C.
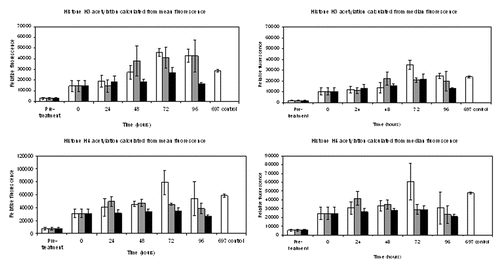
Both histone H3 and histone H4 acetylation were detected by this method and showed the same relative differences that were detected by both western blotting and immunohistochemistry after 24 h incubation with LBH589. Histone H3 and H4 acetylation was detectable over the entire 96 h incubation period at all temperatures. Increasing histone H3 and H4 acetylation was particularly noted during the 4°C and 20°C incubations (H3 only); however, this was not as evident at 37°C. After 96 h at 37°C, a significant drop in both histone H3 and H4 acetylation was observed. Both the mean and median values are shown in because, although the mean is the average value of the fluorescence intensity produced by the analysis, the distribution of flow cytometry data are often skewed and in these instances the median fluorescence is a better measure. These results suggest that at 4°C and 20°C histone acetylation may increase to levels greater than those initially encountered immediately following treatment, in particular for histone H3 acetylation.
Treated and control leukocytes were analyzed by flow cytometry at the same time, and all samples were stored post-fixation for up to one week prior to analysis. However, it was noted that with time, histone H3 and H4 acetylation was lost in fixed cells after prolonged storage at 4°C. Samples fixed and stored at 4°C for nine weeks were shown to have lost 25–50% of their base-line histone acetylation (data not shown).
In summary, flow cytometry is a good method for the quantitative detection of histone acetylation, and cells may be stored un-fixed at 4°C and 20°C for up to 72 h without a marked loss of histone acetylation. However, it is recommended that even if cells are fixed immediately post LBH589 treatment, that they be analyzed within a week of fixing, to ensure the optimal retention of acetylated histones. Furthermore, these results suggest that consistent sample storage conditions should be maintained both after blood sample collection, and after sample fixing prior to the analysis of histone acetylation, to ensure the reliable measurement of histone acetylation during a treatment time course, and to account for variations in histone acetylation that may occur in blood samples, post-collection.
Blood samples from four patients infused with LBH589 were then analyzed to examine the general applicability of these methods to the measurement of histone acetylation during a treatment time course. The methods used were in the same way as described for the cord and peripheral blood samples. Six milliliters of peripheral blood was collected into EDTA tubes pre-treatment, 6, 24 and 48 h post a single 30 min infusion of 15 mg/m2 LBH589 that we estimated as equivalent to a 1 µM in vitro dose. After collection, blood samples were transported to the laboratory at temperatures from 4°C-16°C within 24 h, after which leukocytes were immediately separated from the blood by red cell lysis, and fixed for flow cytometry or stored as frozen pellets for western blotting. Flow cytometry was performed between 8 and 11 d after fixing the cells, compared with 7 d in the in vitro study. Western blotting was performed after cell pellets had been stored for 13 weeks at -80°C, compared with a storage time of 9 weeks for the in vitro analyses. Flow cytometry data showing the average in vivo levels of histone acetylation in the blood from four patients is shown in . This data had similar fluorescence intensity values to the in vitro data in , with histone H4 acetylation higher than histone H3. However what is striking about the in vivo data are the kinetics of the histone acetylation with a rapid increase in the first 6 h after infusion followed by a decrease to 24 h followed by an increase to 48 h. Because histone acetylation was not examined after 6 h it is likely that this rapid increase was missed in the in vitro analysis; however, similar increases in histone acetylation between 24 and 48 h were observed for both in vivo and in vitro acetylation. Western blotting of in vivo acetylation in one patient, representative of the other patients, displayed very weak acetylated histone H3 and stronger histone H4 acetylation (). The β-actin band intensity was also significantly lower than in the in vitro treated leukocytes, although total protein loadings were comparable. Although the relative differences in histone H3 and histone H4 are readily detectable, the quantitative differences in acetylation throughout the time course are not as clear. In our hands, flow cytometry appears to be a superior method for monitoring histone acetylation in vivo.
Figure 6. Analysis of in vivo leukocyte histone acetylation by flow cytometry. Mean and median fluorescence values for histone H3 and histone H4 acetylation in four sets of leukocytes over a treatment course, obtained by flow cytometry. The standard error of the statistical mean is indicated by the error bars. The y-axis shows the relative fluorescence intensity. Pre-treatment patient data were histogram subtracted from that of cells collected 6, 24 and 48 h post a single 30 min infusion of 15 mg/m2 LBH589. Cells were fixed post-separation from blood by red cell lysis. The fixed cells were stained for histone H3 and histone H4 acetylation and analyzed by flow cytometry
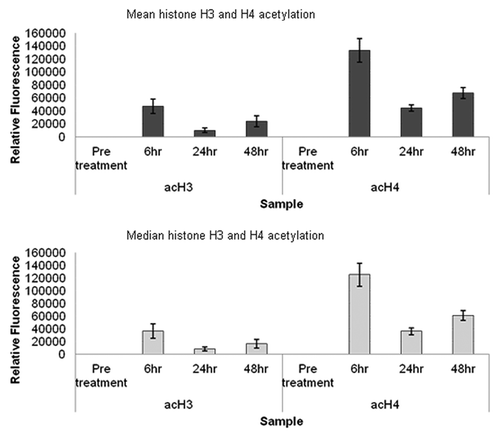
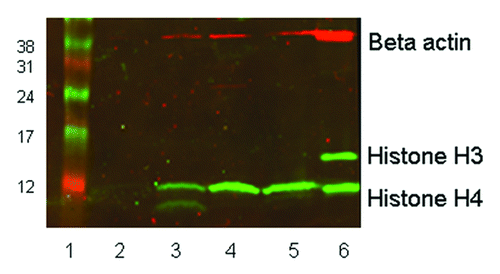
Figure 7. western blot showing histone H3 and H4 acetylation in vivo in leukocytes from a single patient. Twenty micrograms of protein was loaded in each lane of a 15% SDS-PAGE gel. Rabbit anti-acetyl histone H3 detected a protein band at approximately 16 KDa and rabbit anti-acetyl histone H4 detected a band at 12 KDa; mouse anti-β-actin (the loading control) recognized a protein band at 42 KDa. The secondary antibody anti-mouse Cy3 has red fluorescence and the anti-rabbit Cy5 has green fluorescence. Lane 1, size marker. Lane 2, pre-treatment leukocytes. Lane 3, 6 h post treatment. Lane 4, 24 h post treatment. Lane 5, 48 h post treatment. Lane 6, control 697 cells incubated with 100 nM LBH589 for 24 h.
Discussion
In this report we have described three methods for detecting acetylated histones in blood mononuclear cells, and compared two common blood processing methods for their impact on histone acetylation. For all methods, we have optimized the conditions required for detecting histone acetylation, so that they can be readily adopted by other laboratories. We have also shown results from patients treated in vivo with LBH589 indicating that these methods also work effectively on clinical blood samples. While the HDACi we have based our methods on is LBH589, we anticipate that the methods we describe will be widely applicable for the monitoring of histone acetylation in the blood in the setting of any HDACi treatment, and are also sufficiently sensitive to detect histone acetylation in non-exposed cells. It should be noted, however, that while these methods are useful for assessing how the blood cells of an individual patient are responding to HDACi they do not necessarily correlate with how their tumor may be responding, nor with the clinical outcome for an individual patient.
Our results suggest that leukocytes can be isolated from whole blood using either red blood cell lysis or density gradient separation with Ficoll-Paque, with little difference between the quantitative detection of histone H3 or H4 acetylation. For monitoring pediatric patients during treatment with HDACi, we suggest that processing blood by the red cell lysis method be the method of choice as there is no separation of the components of the leukocyte cell population (granulocytes, monocytes, lymphocytes) enabling smaller blood volumes to be processed. Some loss of histone acetylation was associated with blood processing and this appeared equivalent between the two methods. Whether this is an active process of histone deacetylases or a non-specific ‘decay’ has not as yet been determined.
Significantly, the analysis of histone acetylation by flow cytometry under a range of post-treatment incubation temperatures revealed differences in the levels of both histone H3 and H4 acetylation. The reduction in histone acetylation that predominantly affected leukocytes incubated at 37°C post LBH589 treatment for 96 h, may be explainable by loss of histone acetyl transferase (HAT) activity due to thermal instability, as previously reported.Citation11 The increased histone H3 acetylation observed at 48 and 72 h at 4°C and 20°C maybe due to effects of post-treatment acetylation occurring in the absence of the addition of more inhibitor, an effect previously documented for LBH589 in clinical trials on lymphoma where prolonged effects were noted after the cessation of treatment.Citation12 These effects are likely to be impacted by the relatively long half-life of LBH589Citation13 (approximately 14 h (range 6.5–17.2) as compared with the comparatively shorter half-lives of other HDAC inhibitors.Citation14-Citation16 The counterbalancing influences of loss of HAT activity and prolonged HDAC inhibition, may thus contribute to the increased variability in measurement of both histone H3 and H4 acetylation at later analysis time points.
It was also noted that although histone H3 and H4 acetylation was readily detectable in leukocytes for up to 96 h at 4°C, 20°C or 37°C, fixed cells could not be stored long-term at 4°C without significant losses in histone acetylation occurring. Deacetylation of fixed samples subsequently analyzed by flow cytometry has been noted previouslyCitation10 and HDACi have been added to preparation media to prevent deacetylation of samples for ChIP.Citation17 To preserve histone acetylation we recommend that blood samples are kept at 4°C for no longer than 48 h until leukocyte separation and analysis of histone acetylation by any method, that separated cell samples are kept on ice and cell pellets frozen at -80°C as soon as practicable, and that cells for the analysis of histone acetylation by flow cytometry are fixed, but not stored for more than a week before being analyzed.
Visualization of histone acetylation in cord blood leukocytes by immunohistochemistry showed cytoplasmic histone H4 acetylation in some instances consistent with the acetylation of mitochondrial histones previously described (results not shown).Citation18 The majority of histone H3 and H4 acetylation was nuclear. Although immunohistochemistry is not quantitative, it can yield qualitative data on histone acetylation. The nuclear acetylation was spatially different for H3 and H4 with the H3 acetylation appearing to be around the inside of the nuclear membrane and weakly dispersed through the nucleus whereas histone H4 staining was concentrated within the nucleus.
In their review, Kohler and HurtCitation19 indicated that chromatin is anchored, in both transcriptionally silent and active genes, to the nuclear pore complexes of the nuclear envelope with chromatin looping to the interior. They also noted that chromosome territories extend from the periphery to the interior of the nucleusCitation20-Citation22 with the regions of greater gene density located in the interior. Hyperacetylation of histone H4 lysine 5, lysine 12 and, less so, lysine 16, is associated with transcription and chromosome movement.Citation23 Histone H4 hyperacetylation has been suggestedCitation24 to cause a conformational change to the nucleosome that exposes the DNA to allow the binding of transcription factors, the most highly acetylated H4 being the most attractive to transcription factors.Citation25 Histone H3 acetylation has been shown to be important for the assembly of chromatin and for transcription,Citation24 with histone H3 monomethylated at K4 with K9/K14 acetylated as markers of active gene expression.Citation26 It would be interesting to build upon these results using individual antibodies for each acetylated lysine site. The qualitative visualization of the acetylation of histone H3 and H4 can give some insights into to the biological activity that may be occurring that are not apparent from flow cytometry and western blotting alone.
Materials and Methods
In this study we tested both umbilical cord and peripheral blood in vitro to monitor how processing and environmental conditions impact histone acetylation. Umbilical cord blood samples deemed unsuitable for transplantation were available from the institutional cord blood bank and ethics approval was granted for their use in this study (Ethics approval # HREC 29092A and HREC 30025A). Peripheral blood from four patients enrolled on a Phase 1 study to examine the therapeutic effectiveness of LBH589 in pediatric patients with refractory solid tumors (CLBH589AAU03T) was included in the study to ascertain concordance between in vitro and in vivo data.
LBH589
LBH589 (NVP-LBH589 CU-4) was provided by Novartis. LBH589 for intra venous use is supplied as a sterile, single use vial of 25 mg/5 ml solution containing lactic acid, mannitol and propylene glycol. For in vitro studies, a 25 mM stock solution was prepared in cell culture tested DMSO (Sigma) from which a 10 µM working stock in DMSO was prepared. Stocks were stored at -20°C.
Viable cell counts
Equal volumes of cell suspensions and trypan blue (Sigma) were mixed and loaded onto a hemocytometer. Cells excluding trypan blue were deemed viable.
Separation of leukocytes
Ficoll-Paque PLUS separation of mononuclear cells
An equal volume of PBS was added to 2 mL blood, mixed and overlaid onto 3 mL of Ficoll-Paque PLUS (GE Life Sciences). Following centrifugation for 30 min at 400 g without a break, the interface leukocyte layer was collected and transferred to a 15 mL tube containing 6 mL of PBS. The tubes were gently inverted then centrifuged at 350 g for 5 min, the cells resuspended in PBS and counted using a hemocytometer.
Red cell lysis
Ten volumes of sterile ice-cold red cell lysis buffer (155 mM NH4Cl, 10 mM KHCO3, 1 mM Na2EDTA, pH 7.2–7.4) were added to one volume of fresh whole cord blood, inverted and incubated on ice for 5–10 min until the solution became translucent, with intermittent mixing. The tubes were centrifuged at 350 g for 10 min at 4°C, the supernatant aspirated and the leukocyte pellet resuspended in 5 volumes of red cell lysis buffer. The sample was again centrifuged at 350 g for 5 min at 4°C, and the supernatant aspirated completely to leave a clean white cell pellet. Red cell contamination results in hemoglobin auto-fluorescence and interferes with histone detection in the fluorescent western blotting system. Cells were resuspended in PBS and counted using a hemocytometer. Peripheral blood erythrocytes have greater osmotic fragility than cord blood, and a 3:1 ratio of buffer to blood was used when processing peripheral blood.
HDACi treatment
1x10⁷ leukocytes per well were suspended in 2 mL of RPMI cell culture medium containing 10% fetal bovine serum (FBS) in a 6 well plate (Costar). Sample wells contained 100 nM LBH589 (Novartis) or 0.1% DMSO. The cells were incubated for 24 h at 37°C with 5% CO2 in air. Cells were then washed and processed according to the test required. For re-separation from blood, cells were resuspended in 1 mL PBS / 1% FBS and added to 1 mL of leukocyte depleted blood. The leukocytes were removed by repeated centrifugation and aspiration of the buffy coat. The 697 leukemia cell line (ATCC) was grown in RPMI containing 10% FBS. 107 cells per mL were incubated in 100nM LBH589 for 24 h at 37°C with 5% CO2. The cells were washed in PBS and processed for western blotting, flow cytometry or immunohistochemistry where they were used as acetylation controls.
Blood histone acetylation data from four patients are reported in this study. Patients were aged 9–14 y and were subjected to a single 30 min infusion of 15 mg/m2 of LBH589. Pre-treatment, 6, 24 and 48 h post treatment bloods were collected in EDTA tubes in accordance with the trial protocol and stored at 4°C for up to 24 h before processing.
Antibodies
For western blotting, flow cytometry and immunohistochemistry antibodies were used at the following indicated concentrations: Primary antibodies rabbit anti-Acetyl Histone H3 K9/K14 Millipore #06–599 (1:1500, 1:500, 1:200) rabbit anti-Acetyl Histone H4 Millipore Cat# 06–598 (1:1500, 1:500, 1:200) and mouse anti-β actin Sigma #A5316 (1:5000). Secondary antibodies: Goat anti-rabbit Cy5 GE Life Sciences #PA45012 and Goat anti-mouse Cy3 GE Life Sciences #PA43010 (both 1:3000) for western blotting and donkey anti-rabbit IgG (H+L) Alexa Fluor 488 (Invitrogen #A21206) for flow cytometry (1:1000) and immunohistochemistry (1:500).
Western blotting
1x10⁷ leukocytes (incubated with LBH589 or DMSO) were washed in ice-cold sterile PBS, centrifuged at 2000 g for 10 min at 4°C, the supernatant aspirated and the cells frozen at -80°C. The cell pellet was thawed on ice prior to the addition of 200 µL ice-cold mammalian lysis buffer (50 mM Tris pH 7.5, 375 mM sodium chloride, 1 mM disodium EDTA, 1%Triton X-100, protease inhibitor cocktail (Merck #539131) and the sample sonicated for 1 min. Samples were maintained on ice. 5x loading buffer (0.25M Tris pH6.8, 0.2% bromophenol blue, 10% sodium dodecyl sulfate, 50% Glycerol, 10% β mercaptoethanol) was added to 20 µg of the lysed sample, denatured at 96°C for 10 min, and then run on15% SDS-PAGE gels at 100 V. Hybond-LFP membrane (GE Life Sciences) was prepared according to the manufacturer’s instruction and protein transfer conducted at 40 V (maximum 400 mA) at 4°C for 2 to 2.5 h. The transferred membrane was rinsed briefly in methanol, PBS and then blocked in 5% non-fat dry milk (Fonterra) in PBS for 1 h at room temperature. The membrane was rinsed three times in phosphate buffered saline / 0.1% Tween 20 (PBST) and incubated 4°C overnight in the combined primary antibodies (rabbit anti-acetyl histone H3, rabbit anti-acetyl histone H4 and mouse anti-β-actin) in PBST. The membrane was washed twice for 5 min in PBST prior to incubation with the secondary antibodies (Goat anti-rabbit Cy5 and Goat anti-mouse Cy3) for 1 h at room temperature. Following antibody incubations, the membrane was rinsed in PBST and PBS before being read in the Typhoon Trio Variable Mode Imager Membranes were scanned on fluorescence, 100 micron setting, using Cy3 Emission filter 580BP30 and Cy5 Emission filter 670BP30.
Western blot analysis
Scanned membranes from western blots were analyzed using ImageQuant software (GE Life Sciences). The density of the bands detected by the Cy3 (β actin) and Cy5 (acetyl histone) antibodies were quantified on separate color channels and the data exported to Excel (Microsoft). Data for the acetyl-histones were adjusted for concentration relative to the Beta actin bands. The band density of the lysates from cells exposed to the control diluent DMSO was subtracted from that of cells exposed to LBH589. Data were then normalized to the control 697 cell sample.
Flow cytometry
Flow cytometry was based on the method of Ronzoni et al. 2005.Citation10 Briefly, 8x10⁵ leukocytes were resuspended in PBS containing 1% FBS, centrifuged, and resuspended in 200 µL 1% paraformaldehyde. The cells were incubated on ice for 15 min, washed in 2 mL ice-cold PBS, resuspended in 200 µL of PBS, and stored at 4°C for a maximum of one week. Immediately prior to use, the cells were washed with PBS containing 1% BSA and permeabilized with 200 µL of 0.1% Triton X-100 in PBS for 10 min at room temperature. After washing with PBS / 1% BSA, the samples were blocked in 500 µL of PBS/ 10% FBS for 20 min. Histone acetylation levels were detected by incubation with polyclonal rabbit anti-acetyl histone H3 or rabbit anti-acetyl histone H4 antibodies for 1 h and then washed and incubated with donkey anti-rabbit IgG AF488 for 1 h at room temperature in the dark. Cells were washed and resuspended in 200 µL PBS, and stored at 4°C overnight in the dark until analyzed.
Flow cytometry analysis
Flow cytometry was performed on a LSR II flow cytometer (Becton Dickinson), acquiring 10,000 events/sample. The instrument was equipped with a band-pass 530/30-nm optical filter for AF488 fluorescence detection with 488nm excitation wavelength, and a 440/40-nm optical filter in the DAPI channel detector. Data were collected using the BD FACSDiva software, and further analyzed using the software package FCS express. DMSO diluent data at each time point was histogram subtracted, channel by channel, from fluorescence data obtained from 100 nM LBH589 treatment of peripheral blood leukocytes. After control histogram subtraction, the mean and median fluorescence for each treatment time point was derived.
Immunohistochemistry
Leukocytes were resuspended at 5x10⁵/mL in cold PBS/0.1% FBS on ice and 200µL of cells were spun onto clean microscope slides in a SHANDON 2 Cytospin centrifuge at 500rpm for 3 min. Slides were air-dried for 30 min, encircled with hydrophic ‘ink’ (mini PAP pen Invitrogen #00–887) then fixed in 80 µL 1% paraformaldehyde in PBS for 5 min, washed twice in PBS and air-dried prior to storage at 4°C. Slides were warmed to room temperature before staining, permeabilized in 80 µL 0.1% Triton X-100 in PBS for 3 min, washed once in PBS for 15 min, then in PBST and blocked in 100 µL of 5% BSA (or serum of second antibody) in PBS for 60 min. Slides were washed twice for 5 min in PBST and then incubated in 50 µL α-acH3 or α-acH4 antibody in 1% BSA containing 0.3% Triton X-100 in PBST for 120 min at ambient temperature or overnight at 4°C in a humidified container. Slides were washed three times for 5 min with PBST prior to incubation in 50 µL anti-rabbit AF488 (1:500) in 1% BSA in PBST for 60 min at ambient temperature. Slides were washed in PBST then mounted in ProLong® Gold +DAPI (#P36935 Invitrogen) and left to cure for 24 h in the dark. Slides were stored overnight at room temperature in the dark until read.
Confocal microscopy
Slides were read and digital imaging was performed using a Leica DM IRE2 Confocal microscope, with an HCX PL APO CS 63x13mm IMM objective with glycerol immersion media and Leica Confocal Software. High power images were at 3–3.5x optical zoom, voxel size 80–90. LAS AF lite software was used to overlay the separate Alexa Fluor488 and DAPI images.
| Abbreviations: | ||
| ac | = | acetyl/acetylated |
| DMSO | = | dimethyl sulfoxide |
| H3 | = | histone 3 |
| H4 | = | histone 4 |
| HDAC | = | histone deacetylase |
| HDACi | = | histone deacetylase inhibitor |
| LBH589 | = | panobinostat |
| PBS | = | phosphate buffered saline |
Acknowledgments
This work was supported by a grant from Novartis (L.R.) and by funding from the Children’s Cancer Centre Foundation (E.A.) and the Steven Walter Foundation (A.M.). The MCRI is supported by the Victorian Government's Operational Infrastructure Support Program. We thank Matt Burton for assistance with flow cytometry.
Disclosure of Potential Conflicts of Interest
No potential conflicts of interest were disclosed.
Related Research Data
References
- Peart MJ, Smyth GK, van Laar RK, Bowtell DD, Richon VM, Marks PA, et al. Identification and functional significance of genes regulated by structurally different histone deacetylase inhibitors. Proc Natl Acad Sci U S A 2005; 102:3697 - 702; http://dx.doi.org/10.1073/pnas.0500369102; PMID: 15738394
- Lindemann RK, Gabrielli B, Johnstone RW. Histone-deacetylase inhibitors for the treatment of cancer. Cell Cycle 2004; 3:779 - 88; http://dx.doi.org/10.4161/cc.3.6.927; PMID: 15153801
- Vigushin DM, Ali S, Pace PE, Mirsaidi N, Ito K, Adcock I, et al. Trichostatin A is a histone deacetylase inhibitor with potent antitumor activity against breast cancer in vivo. Clin Cancer Res 2001; 7:971 - 6; PMID: 11309348
- Jaboin J, Wild J, Hamidi H, Khanna C, Kim CJ, Robey R, et al. MS-27-275, an inhibitor of histone deacetylase, has marked in vitro and in vivo antitumor activity against pediatric solid tumors. Cancer Res 2002; 62:6108 - 15; PMID: 12414635
- Tan J, Cang S, Ma Y, Petrillo RL, Liu D. Novel histone deacetylase inhibitors in clinical trials as anti-cancer agents. J Hematol Oncol 2010; 3:5; http://dx.doi.org/10.1186/1756-8722-3-5; PMID: 20132536
- Maiso P, Carvajal-Vergara X, Ocio EM, López-Pérez R, Mateo G, Gutiérrez N, et al. The histone deacetylase inhibitor LBH589 is a potent antimyeloma agent that overcomes drug resistance. Cancer Res 2006; 66:5781 - 9; http://dx.doi.org/10.1158/0008-5472.CAN-05-4186; PMID: 16740717
- Kim IA, Kim IH, Kim HJ, Chie EK, Kim JS. HDAC inhibitor-mediated radiosensitization in human carcinoma cells: a general phenomenon?. J Radiat Res 2010; 51:257 - 63; http://dx.doi.org/10.1269/jrr.09115; PMID: 20505264
- Mann BS, Johnson JR, Cohen MH, Justice R, Pazdur R. FDA approval summary: vorinostat for treatment of advanced primary cutaneous T-cell lymphoma. Oncologist 2007; 12:1247 - 52; http://dx.doi.org/10.1634/theoncologist.12-10-1247; PMID: 17962618
- Bertino EM, Otterson GA. Romidepsin: a novel histone deacetylase inhibitor for cancer. Expert Opin Investig Drugs 2011; 20:1151 - 8; http://dx.doi.org/10.1517/13543784.2011.594437; PMID: 21699444
- Ronzoni S, Faretta M, Ballarini M, Pelicci P, Minucci S. New method to detect histone acetylation levels by flow cytometry. Cytometry A 2005; 66:52 - 61; http://dx.doi.org/10.1002/cyto.a.20151; PMID: 15915507
- Wiktorowicz JE, Bonner J. Studies on histone acetyltransferase. Partial purification and basic properties. J Biol Chem 1982; 257:12893 - 900; PMID: 7130185
- Sureda. A, Younes A, Ben-Yehuda D, Ong T-C, Kaufman JL, Le Corre C et al. Final analysis: Phase II study of oral panobinostat in relapsed/refractory Hodgkin lymphoma patients following autologous hematopoietic stem cell transplant. 52nd ASH Annual Meeting and Exposition, 2010; Abstract 419.
- Hamberg P, Woo MM, Chen LC, Verweij J, Porro MG, Zhao L, et al. Effect of ketoconazole-mediated CYP3A4 inhibition on clinical pharmacokinetics of panobinostat (LBH589), an orally active histone deacetylase inhibitor. Cancer Chemother Pharmacol 2011; 68:805 - 13; http://dx.doi.org/10.1007/s00280-011-1693-x; PMID: 21706316
- Dashwood RH, Ho E. Dietary histone deacetylase inhibitors: from cells to mice to man. Semin Cancer Biol 2007; 17:363 - 9; http://dx.doi.org/10.1016/j.semcancer.2007.04.001; PMID: 17555985
- Kelly WK, O’Connor OA, Krug LM, Chiao JH, Heaney M, Curley T, et al. Phase I study of an oral histone deacetylase inhibitor, suberoylanilide hydroxamic acid, in patients with advanced cancer. J Clin Oncol 2005; 23:3923 - 31; http://dx.doi.org/10.1200/JCO.2005.14.167; PMID: 15897550
- Giles F, Fischer T, Cortes J, Garcia-Manero G, Beck J, Ravandi F, et al. A phase I study of intravenous LBH589, a novel cinnamic hydroxamic acid analogue histone deacetylase inhibitor, in patients with refractory hematologic malignancies. Clin Cancer Res 2006; 12:4628 - 35; http://dx.doi.org/10.1158/1078-0432.CCR-06-0511; PMID: 16899611
- Dahl JA, Collas P. Q2ChIP, a quick and quantitative chromatin immunoprecipitation assay, unravels epigenetic dynamics of developmentally regulated genes in human carcinoma cells. Stem Cells 2007; 25:1037 - 46; http://dx.doi.org/10.1634/stemcells.2006-0430; PMID: 17272500
- Johnson DT, Harris RA, French S, Blair PV, You J, Bemis KG, et al. Tissue heterogeneity of the mammalian mitochondrial proteome. Am J Physiol Cell Physiol 2007; 292:C689 - 97; http://dx.doi.org/10.1152/ajpcell.00108.2006; PMID: 16928776
- Köhler A, Hurt E. Gene regulation by nucleoporins and links to cancer. Mol Cell 2010; 38:6 - 15; http://dx.doi.org/10.1016/j.molcel.2010.01.040; PMID: 20385085
- Cremer M, von Hase J, Volm T, Brero A, Kreth G, Walter J, et al. Non-random radial higher-order chromatin arrangements in nuclei of diploid human cells. Chromosome Res 2001; 9:541 - 67; http://dx.doi.org/10.1023/A:1012495201697; PMID: 11721953
- Boyle S, Gilchrist S, Bridger JM, Mahy NL, Ellis JA, Bickmore WA. The spatial organization of human chromosomes within the nuclei of normal and emerin-mutant cells. Hum Mol Genet 2001; 10:211 - 9; http://dx.doi.org/10.1093/hmg/10.3.211; PMID: 11159939
- Croft JA, Bridger JM, Boyle S, Perry P, Teague P, Bickmore WA. Differences in the localization and morphology of chromosomes in the human nucleus. J Cell Biol 1999; 145:1119 - 31; http://dx.doi.org/10.1083/jcb.145.6.1119; PMID: 10366586
- Tumbar T, Sudlow G, Belmont AS. Large-scale chromatin unfolding and remodeling induced by VP16 acidic activation domain. J Cell Biol 1999; 145:1341 - 54; http://dx.doi.org/10.1083/jcb.145.7.1341; PMID: 10385516
- Shahbazian MD, Grunstein M. Functions of site-specific histone acetylation and deacetylation. Annu Rev Biochem 2007; 76:75 - 100; http://dx.doi.org/10.1146/annurev.biochem.76.052705.162114; PMID: 17362198
- Vettese-Dadey M, Grant PA, Hebbes TR, Crane- Robinson C, Allis CD, Workman JL. Acetylation of histone H4 plays a primary role in enhancing transcription factor binding to nucleosomal DNA in vitro. EMBO J 1996; 15:2508 - 18; PMID: 8665858
- Yan C, Boyd DD. Histone H3 acetylation and H3 K4 methylation define distinct chromatin regions permissive for transgene expression. Mol Cell Biol 2006; 26:6357 - 71; http://dx.doi.org/10.1128/MCB.00311-06; PMID: 16914722