 ?Mathematical formulae have been encoded as MathML and are displayed in this HTML version using MathJax in order to improve their display. Uncheck the box to turn MathJax off. This feature requires Javascript. Click on a formula to zoom.
Abstract
Genome wide analysis of DNA methylation provides important information in a variety of diseases, including cancer. Here, we describe a simple method, Digital Restriction Enzyme Analysis of Methylation (DREAM), based on next generation sequencing analysis of methylation-specific signatures created by sequential digestion of genomic DNA with SmaI and XmaI enzymes. DREAM provides information on 150,000 unique CpG sites, of which 39,000 are in CpG islands and 30,000 are at transcription start sites of 13,000 RefSeq genes. We analyzed DNA methylation in healthy white blood cells and found methylation patterns to be remarkably uniform. Inter individual differences > 30% were observed only at 227 of 28,331 (0.8%) of autosomal CpG sites. Similarly, > 30% differences were observed at only 59 sites when we comparing the cord and adult blood. These conserved methylation patterns contrasted with extensive changes affecting 18–40% of CpG sites in a patient with acute myeloid leukemia and in two leukemia cell lines. The method is cost effective, quantitative (r2 = 0.93 when compared with bisulfite pyrosequencing) and reproducible (r2 = 0.997). Using 100-fold coverage, DREAM can detect differences in methylation greater than 10% or 30% with a false positive rate below 0.05 or 0.001, respectively. DREAM can be useful in quantifying epigenetic effects of environment and nutrition, correlating developmental epigenetic variation with phenotypes, understanding epigenetics of cancer and chronic diseases, measuring the effects of drugs on DNA methylation or deriving new biological insights into mammalian genomes.
Introduction
Epigenetic mechanisms control the organization of chromatin and the expression potential of the genetic code. There are three major molecular players carrying epigenetic information: DNA methylation, histone posttranslational modifications and RNA interference.Citation1-Citation3 DNA methylation is a post-synthetic biochemical modification. In mammalian genomes, methylation specifically targets cytosine, mostly when followed by guanosine (CpG sites). This CpG methylation presents a memory mark for gene silencing.Citation4 There are approximately 30 million CpG sites in the human genome, and the majority of them are methylated. About 0.7% of DNA contains dense clusters of CpG dinucleotides called CpG islands. These are frequently associated with starting sites of gene transcription (TSS) and they are mostly unmethylated.Citation5 Cancer is associated with complex changes in DNA methylation. For the most part, these changes involve simultaneous global demethylation and de novo methylation at previously unmethylated CpG islands. Aberrant methylation is strongly correlated with gene silencing in neoplasia and has been proposed to serve as an alternate mechanism for inactivating tumor suppressor genes.Citation6
Genome-wide analysis is proving important to reveal the multiple biological functions of DNA methylation. It is becoming also clinically useful for exploration of epigenetic changes in a variety of diseases, including cancer. Current methods for this analysis rely on methylation differentiation via bisulfite treatment, affinity-based enrichment or restriction enzyme digestion coupled with ultra-deep sequencing.Citation7 The latter two methods employ separate enrichment and detection of methylated and unmethylated DNA, which limits the quantitative precision of the analysis. Bisulfite based methods analyze methylated and unmethylated DNA simultaneously. However, bisulfite treatment converts all unmethylated cytosines to uracils and can result in significant sequence differences between methylated and unmethylated alleles, particularly in CpG-rich areas of the genome. This has been shown to cause substantial PCR amplification bias,Citation8,Citation9 often limiting the accuracy of quantitation.
By necessity, much of the known biology of DNA methylation so far has relied on comparing samples with large differences. However, detecting relatively small differences could be important when studying subtle changes. These may include quantifying environmental or dietary effects on DNA methylation, correlating developmental epigenetic variation with phenotypes, measuring the effects of DNA methylation modifying drugs or deriving new biological insights into mammalian genomes. Here, we describe a simple and cost-effective genome-wide method for highly quantitative methylation measurement.
Results
Digital restriction enzyme analysis of methylation (DREAM) method
The presented method () relies on sequential digestion of genomic DNA with a pair of neoschizomeric restriction enzymes that recognize the same sequence, CCCGGG. The first enzyme, SmaI, is completely blocked by CG methylation. It cuts only unmethylated sites and leaves blunt ends starting with 5′-GGG. The second enzyme, XmaI, can cleave sites with methylated CGs. It leaves 5′-CCGG overhangs. We create methylation-dependent signatures by sequential digests. First, the SmaI endonuclease cuts all unmethylated sites at CCC/GGG, leaving blunt ended fragments starting at 5′ ends with a GGG trinucleotide. Methylated sites CCmeCGGG are not digested. Subsequently, the methylation-tolerant XmaI endonuclease cuts the remaining sites at C/CmeCGGG, leaving 5′-CmeCGG overhangs. Sequential restriction digests thus create distinct signatures for unmethylated sites (GGG) and methylated sites (CmeCGGG) at 5′ ends of restriction fragments. DNA polymerase fills in the 3′ recesses and adds 3′-A overhangs in the next step. Sequencing adapters are then ligated to the ends of restriction fragments and libraries for deep sequencing are made following standard procedures. Deep sequencing (e.g., on the Illumina Genome Analyzer II or HiSeq 2000) follows. The sequences are mapped to SmaI/XmaI sites in the genome and methylation status for each individual CCCGGG site is calculated as a proportion of methylated signatures to the sum of unmethylated and methylated signatures.
Figure 1. Digital Restriction Enzyme Analysis of Methylation (DREAM). (A) Schematic outline of the principle. SmaI restriction endonuclease can cut only unmethylated CCCGGG sites creating 5′-GGG signatures (u). Remaining methylated CCmeCGGG sites are then cut by XmaI restriction endonuclease creating 5′-CCGGG signatures (m). Sequencing adapters are ligated to SmaI/XmaI fragments and the libraries are subjected to next generation sequencing. Methylation levels at unique SmaI/XmaI sites are calculated based on the numbers of methylated and total signatures. (B) Numbers of unique CpG sites captured by DREAM in healthy human white blood cells based on the minimum sequencing depth. Black, 4 HiSeq lanes; red, single HiSeq lane, 4 samples; blue, ¼ of HiSeq lane, 4 samples. Solid lines show means; colored areas between broken lines show mean ± SEM (C) Good correlation between methylation levels at unique CpG sites (n = 29,574) covered by 100+ reads in DREAM libraries generated from 5 µg or 500 ng of gDNA from the same sample of healthy leukocytes. Pearson r2 = 0.9971. (D) False positive rate (FPR) calculation based on methylation differences between 93,420 replicate measurements of methylation at CCCGGG sites covered by 100+ reads. Horizontal broken lines show FPR of 1% and 5%. Sites with low methylation (0–20%) or high methylation (80–100%) showed the lowest FPR.
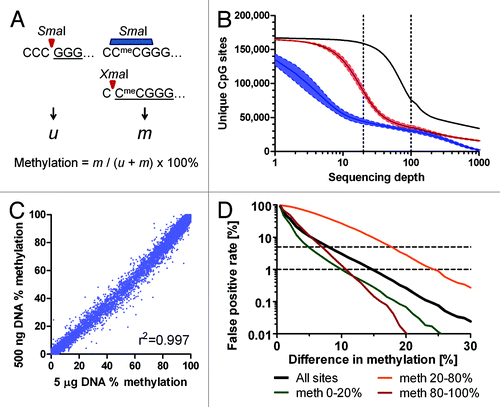
Accurate detection of unmethylated and methylated signatures depends on the efficiency of the SmaI and XmaI restriction enzymes to cut DNA. We created a set of artificial standards with defined levels of CG methylation to be used as calibrators spiked in the genomic DNA before the restriction digests. To make the standards, we made five different PCR amplicons based on non-mammalian DNA, each containing 2 CCCGGG sites 168–255 bases apart. We methylated CG sites in a portion of PCR amplicons using the M.SssI methylase. We mixed unmethylated and methylated amplicons in appropriate proportions to achieve defined methylation levels of 0%, 25%, 50%, 75% and 100%. We spiked these standards in the samples of genomic DNA before processing for the DREAM analysis. We compared methylation levels measured in the standards by the DREAM method with the expected values. By spiking in 10 pg of each standard into 5 µg of gDNA, we obtained 3,187–452,665 (median 107,349) sequencing reads for each standard. We observed a good correlation between the observed and expected methylation levels of spiked in standards (Pearson r2 = 0.911). The unmethylated standard showed methylation values 0.6–0.9%, implying that the method can reliably detect methylation levels as low as 1%. The fully methylated standard showed 99.0–99.5% methylation by DREAM, confirming correct detection of fully methylated CpG sites. We observed that methylation values detected in partially methylated standards were lower than expected by approximately 30–50%, suggesting that methylated CCmeCGGG sites were captured with a lower efficiency than unmethylated CCCGGG sites. In order to compensate for the partial inhibition of XmaI by CG methylation, we corrected methylation levels measured by DREAM based on the values obtained from the spiked in standards (Fig. S1).
To investigate the possibility that the efficiency of restriction digests is different for genomic DNA and spiked in methylated standards, we compared uncorrected and spike-corrected methylation levels at 159 CpG sites in CpG islands on the X chromosome that showed differential methylation in females compared with males. Expected methylation level at these sites is 0% in males and 50% in females. Average methylation in female DNA was 27–30% before correction and 42–43% after correction. Methylation in male DNA was ≤ 1% in all instances (Fig. S2).
NCBI36/hg18 annotation of the human genome provides coordinates for 374,165 CCCGGG sites. Of these, 39,084 sites are in CpG islands (CGI) and 103,450 sites are outside CpG islands (NCGI). We used the UCSC definition of CpG islands: GC content of 50% or greater, length > 200 bp, ratio greater than 0.6 of observed number of CG dinucleotides to the expected number on the basis of the number of Gs and Cs in the segment.Citation10 Repetitive elements contain 231,631 sites, while 142,534 sites are in non-repetitive regions, with 29,725 sites (21%) located within -1 kb to +1 kb from transcription start sites (TSS) of 13,256 RefSeq genes ().
Table 1. Target sites in the human genome
We analyzed four samples of normal white blood cells (WBC), two cord blood samples, one sample from a patient with acute myeloid leukemia and two myeloid leukemia cell lines, HEL and K562. From millions of 36 nucleotide-long reads obtained through next generation sequencing, we could uniquely map 40,000–146,000 CCCGGG sites with the minimum 20-fold coverage (Table S1). As the sequencing technique evolved, the yield from a single sequencing lane has increased dramatically from 3.5 million to 62 million reads mapped to unique CCCGGG sites. One sequencing lane in the Illumina HiSeq 2000 instrument routinely provides over 60 million reads mapped to unique SmaI sites in the human genome, giving the average coverage of over 300 reads per site. In experiments analyzing normal WBCs, approximately 155,000 unique SmaI sites (37,000 CGI and 118,000 NCGI sites) were covered by 5+ reads. About 90,000 sites (30,000 CGI and 60,000 NCGI) were covered by 20+ reads and 35,000 sites (19,000 CGI and 16,000 NCGI) were detected by 100+ reads (; Fig. S3).
Our method selects preferentially for fragments that have SmaI/XmaI sites at both ends. Due to technical requirements for Illumina sequencing, we created libraries from DNA fragments with ligated sequencing adapters of apparent sizes 250–500 bp. This resulted in approximately 40-fold enrichment for SmaI/XmaI sites with a neighboring site up to 400 bp apart. These 60,795 sites were covered on average by 745 reads. Remaining 107,645 uniquely mapped SmaI/XmaI sites with the nearest neighbor > 400 bp apart entered the sequencing libraries due to random DNA breakage near a SmaI/XmaI site and were covered on average by 18 reads (Fig. S4).
We analyzed the quality of libraries by cloning in the sequencing vector and Sanger sequencing of the inserts. SmaI/XmaI sites at both ends of DNA inserts were observed in 42–85%. SmaI/XmaI sites at a single end were seen in 11–46% fragments. Non-informative fragments lacking SmaI/XmaI sites at both ends were found in 4–38% sequenced clones. Informative ends were thus present in 56–91% sequencing reads (Table S2). Usage of high quality unbroken genomic DNA is important to minimize the amount of non-informative fragments lacking SmaI/XmaI site at their ends.
To reduce sequencing costs, we explored the strategy of bar coding and running multiple samples in one sequencing lane. We made four libraries with different bar coded adapters and ran them in a single sequencing lane. We obtained 12.6–20.5 million reads mapped to unique CpG sites for each library. Average numbers of reads per site were 80–175. Approximately 30,000 sites were covered by 100+ reads in individual libraries run in the ¼ of the sequencing lane (17,000 CGI and 13,000 NCGI sites). These numbers were close to those obtained from the full lane (; Fig. S5A), suggesting that sequencing costs could be reduced by bar coding at least 4-fold.
The amount of genomic DNA available for analysis is frequently a limiting factor in clinical samples. We compared sequencing libraries prepared from the same normal blood DNA sample using 5 µg and 500 nanograms of gDNA as the starting amount. The coverage of CCCGGG sites was comparable with an 80% overlap of sites covered by 100+ reads in both libraries (Fig. S5B). Median difference between methylation levels at individual sites in these libraries was 0.64%, correlation between the results was excellent (Pearson r2 = 0.997) (). We thus show that reliable methylation data can be obtained from 500 ng of gDNA.
To assess reproducibility of the method, we performed replicate analyses of three different DNA samples from normal WBCs. Library preparation and sequencing were performed on separate occasions for each replicate. There was a high concordance between replicates (Pearson correlation r2 = 0.997, Fig. S6). We observed smaller variability of replicates at low and high methylation values and larger variability at intermediate methylation levels. When we analyzed CpG sites covered by 100+ reads, methylation differences > 10%, > 15% and > 30% could be distinguished with false positive rate of 2.4%, 0.73% and 0.02%, respectively ().
We validated DREAM results by two independent methods: bisulfite sequencing and bisulfite pyrosequencing. We selected CpG islands near TSSs of 11 genes showing variable levels of methylation by DREAM for validation by bisulfite cloning/sequencing. We performed bisulfite PCR using 7 different DNA samples (4 normal WBCs, 1 AML, HEL and K562 leukemia cell lines). Primers for bisulfite PCR are shown in Table S3. Altogether, we analyzed 1,080 cloned PCR products (median 14 clones per sample) by Sanger sequencing (Beckman Coulter Genomics). Bisulfite PCR amplification products contained 8–49 CpG sites including 1–3 CCCGGG sites detected by DREAM. Linear regression analysis showed an excellent correlation between DREAM and bisulfite sequencing results both for CCCGGG sites (r2 = 0.847, p < 0.0001) () and also for neighboring CpG sites analyzed in bisulfite PCR products 200–500 bp long (r2 = 0.857, p < 0.0001) (Fig. S7).
Figure 2. Validation of DREAM results. (A) Bisulfite sequencing vs. DREAM. Methylation at CCCGGG sites. Linear regression r2 = 0.847, p < 0.0001. (B) Bisulfite pyrosequencing vs. DREAM. Linear regression r2 = 0.930, p < 0.0001. (C) Reduced representation bisulfite sequencing, K562 cell line vs. DREAM. Minimum coverage 50+ reads. Linear regression r2 = 0.953, p < 0.0001. Broken lines show linear regression. (D) Methyl 450K Bead Array, K562 cell line vs. DREAM. Minimum coverage 50+ reads. Linear regression r2 = 0.854, p < 0.0001.
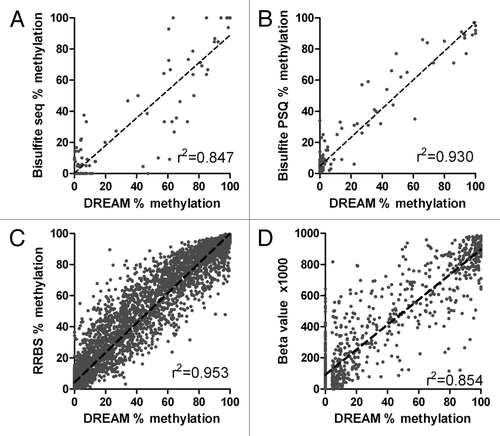
The quantitative nature of bisulfite sequencing is limited by the number of clones that are sequenced from each PCR product. In contrast, bisulfite pyrosequencing measures average methylation levels at individual CpG sites by simultaneous analysis of multiple DNA copies in the sequenced PCR product. Its accuracy is around 1%. Pyrosequencing thus provides more accurate quantitation than sequencing of cloned PCR products. We used bisulfite pyrosequencing assays targeting TSSs of 79 genes to validate results obtained by DREAM analysis. Pyrosequencing assays measured methylation at 2–8 CpG sites within 500 bases from CCCGGG sites analyzed by DREAM. We observed an excellent correlation between DREAM and bisulfite PSQ results (r2 = 0.930, p < 0.0001, ).
Finally, we compared methylation data obtained by DREAM with publicly available ENCODE projectCitation11 data generated in R.M. Myers Lab (HudsonAlpha Institute for Biotechnology) by two bisulfite-based methods: reduced representation bisulfite sequencing (RRBS)Citation12 and Illumina 450K DNA methylation array.Citation13 We used RRBS methylation data for normal blood leukocytes (GSM683876 and GSM683759) and for the leukemia cell line K562 (GSM683856 and GSM683780). We analyzed RRBS values at CpG sites located within 36 bases from CCCGGG sites (DREAM targets). We found an excellent correlation of DREAM and RRBS data for both normal WBCs and K562, with Pearson r2 0.959 and 0.953, respectively. Similarly to bisulfite sequencing and pyrosequencing, RRBS yielded slightly elevated methylation levels (2.9% for WBC and 4.0% for K562) at the sites showing zero methylation by DREAM (; Fig. S8). An overlap between the sites covered by RRBS and DREAM was relatively small, 16% for normal WBCs and 14% for K562 cells (Fig. S9). We detected by DREAM 12,055 and 17,370 sites in normal WBCs and K562 cells, respectively, that had zero coverage by RRBS. Approximately two thirds of these sites were not in CpG islands. DREAM can thus provide information on DNA methylation of CpG sites not captured by RRBS.
We next compared DREAM data on the leukemia cell line K562 to the data from the Methyl 450K Bead Arrays from ENCODE/HAIB (GSM999341). We found 6,103 SmaI/XmaI sites that were covered by 50+ reads by DREAM and were also inside the probes included in the 450K array. The correlation between the two assays was excellent with the linear regression r2 = 0.854. Interestingly, the Y intercept β1000 value of the 450K array for zero methylation by DREAM was 86.4, suggesting the 450K array has a background close to 10% methylation (). Similarly to DREAM vs. RRBS comparison, the data obtained by DREAM and the 450K array overlapped only partially. Beside 6,103 sites within the probes of the 450K array, additional 34,497 CpG sites were detected by DREAM by 50+ reads in K562.
DNA methylation patterns in healthy white blood cells
DREAM data showed that DNA methylation in normal WBCs was bimodally distributed; the main determinants were the location inside or outside CpG islands (CGI or NCGI sites) and the distance from gene transcription start sites (TSS). CGI sites were predominantly unmethylated. Methylation below 5% was observed in 86% of sites, methylation 5–20% in 4% of sites, methylation 20–80% in 3% of CGI sites, and methylation ≥ 80% in 7% of sites. NCGI methylation was also bimodal, but spread more broadly. Methylation below 5% was found in 16% of sites, methylation 5–20% in 4% of sites, methylation 20–80% in 14% of sites and methylation ≥ 80% in 66% of sites ().
Figure 3. DNA methylation in normal leukocytes. (A) CpG islands (CGI, green) are largely unmethylated. The majority of CpG sites outside of CpG islands (NCGI, orange) is methylated. (B) Methylation of CGI and NCGI sites drops at the vicinity of transcription start sites (TSS). (C) Small inter individual differences in DNA methylation in healthy leukocytes. (D) Small methylation differences between cord blood and adult blood. Grey, differences < 30%; green, CGI sites; orange NCGI sites.
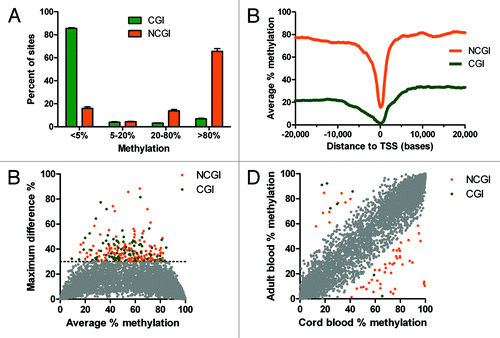
NCGI sites were thus predominantly methylated with average methylation over 70%. However, methylation levels dropped sharply in the close vicinity of transcription start sites (TSS). CGI sites showed much lower methylation with an average of 20% up to 10 kb upstream from TSS, then a gradual decrease to 2% at TSS and a steeper increase reaching 30% at 6 kb downstream from TSS ().
The X chromosome in males is active while one X chromosome in females is epigenetically inactivated. We covered 614 CCCGGG sites on the X chromosome with 100+ reads in normal WBC samples from 2 males and 2 females. We observed clear differences in methylation: female DNA samples showed intermediate methylation at CpG sites that were free from methylation in male DNA (Fig. 10A). We next analyzed methylation status of CGI sites within 1 kb from TSS of genes reported as (1) expressed or (2) silenced on inactive X chromosome.Citation14 CpG sites in genes escaping X inactivation were not methylated in either male or female DNA (Fig. S10B). In contrast, CpG sites at TSSs of X-inactivated genes were not methylated in male DNA, while showing intermediate methylation levels in female DNA (Fig. S10C).
Based on the fact that intermediate methylation in CpG islands is an exceptional phenomenon, our method can uncover genes with potential imprinting or monoallelic methylation. We have identified 376 CGI sites methylated at 20–80% in all 4 WBC samples (Table S5). Twenty-four of these sites were associated with 6 imprinted genes (GRB10, GNAS, KCNQ1OT1, KLF14, MESTIT1, TP73) and 11 sites with 7 genes predicted to be imprinted in human DNA (FASTK, FBRSL1, IFITM1, PPAP2C, SOX8, TMEM52, ZFP36L2).Citation15 Additionally, FANK1 gene (52% methylation) resides in a haploid differentially methylated region.Citation16,Citation17
One of the advantages of DREAM is quantitation, which allows accurate comparison of samples. We started by examining absolute inter individual differences. DNA methylation values were remarkably uniform when we compared white blood cells from 4 healthy individuals (Fig. S11). Analysis of 6 pairs of samples showed that methylation differences greater than 30% were observed only at 227 of 28,331 (0.8%) of autosomal CCCGGG sites covered by 100+ reads (). This suggests that 99% of CpG sites show nearly identical methylation patterns between healthy individuals. Of the 227 unique CCCGGG sites showing differences in methylation > 30% between pairs of samples; half of the sites displayed these differences in multiple pairs. The majority of sites with inter individual differences > 30% were partially methylated (average methylation 53%), were outside CpG islands (146 NCGI sites vs. 81 CGI sites) and were distant from TSS (median distance 17 kb). Inter individual variability was even smaller at promoter CpG sites. Of 13,386 CpG analyzed sites located within 1 kb from TSSs, only 21 CpG sites (0.16%) showed differences in methylation > 30%.
We next analyzed 2 samples of cord blood mononuclear cells and compared the results with adult blood samples. Methylation patterns of the cord blood and adult blood cells were almost identical. Only 59 (0.2%) of 28,331 autosomal CCCGGG sites covered by 100+ reads (7 sites in CGIs and 52 NCGI sites) showed differences between the cord blood and adult blood greater than 30% (). When we analyzed the sites with differences in methylation, adult blood showed more frequent hypomethylation in NCGI sites (43 sites had decreased methylation vs. 9 sites with increased methylation) and hypermethylation in CGI sites (5 sites increased vs. 2 sites decreased methylation) (p = 0.006, Fisher’s exact test). The sites affected by hyper or hypomethylation were mostly in regions distant from a TSS. Nine CpG sites were within 1 kb from a TSS. Interestingly, 4 of these differentially methylated sites mapped to non-coding RNA (MIR219–2, LOC150381, HAR1A). These small changes between the cord blood and adult blood cells may reflect early age-related epigenetic events.
Neoplastic cells
To characterize changes in neoplastic cells, we analyzed bone marrow cells from a patient with acute myeloid leukemia (AML) and two myeloid leukemia cell lines, HEL and K562. We compared methylation values in leukemia samples to the values in normal WBCs at individual CpG sites.
Bone marrow DNA from the AML patient showed methylation differences greater than 30% at 3,686 (14%) of 25,943 CpG sites covered by 100+ reads. Hypermethylation affected 2,898 sites (2,374 CGI, 524 NCGI). Hypomethylation was observed at 788 sites (73 CGI and 715 NCGI) (). Hypermethylated sites were frequently close to transcription start sites: median distance to TSS was 1 kb. Hypomethylation affected more distant CpG sites; median distance from TSSs was 21 kb. We tried to estimate the amount of methylation changes that may act as potential drivers of the leukemic process using the Cancer Gene Census list containing 487 genes with proven function in cancer.Citation18 When we compared the list of 1,810 genes associated with CpG sites differentially methylated in the AML patient, 54 genes were listed in the Cancer Gene Census (i.e., 3% of the differentially methylated genes and 11% of the Cancer Gene Census). We next searched for functional groups of genes affected by methylation changes using a functional annotation tool DAVID.Citation19,Citation20 Functional annotation revealed the following top categories: transcription factor activity (237 genes, 2.6-fold enrichment, FDR 7.7 × 10−45), sequence-specific DNA binding (176 genes, enrichment 3.1, FDR 5.5 × 10−43), developmental protein (193 genes, enrichment 2.9, FDR 5.9 × 10−40) and homeobox (100 genes, 4.8-fold enrichment, FDR 1.1 × 10−39).
Figure 4. Methylation changes in leukemia. (A) Acute myeloid leukemia bone marrow. (B) HEL erythroleukemia cell line. (C) K562 leukemia cell line. Hypermethylation of CpG islands (CGI, green), hypomethylation outside CpG islands (NCGI, orange). Grey, CpG sites with methylation changes vs healthy leukocytes < 30%. (D) Numbers of genes with CpG sites affected by methylation changes over 30% compared with normal leukocytes.
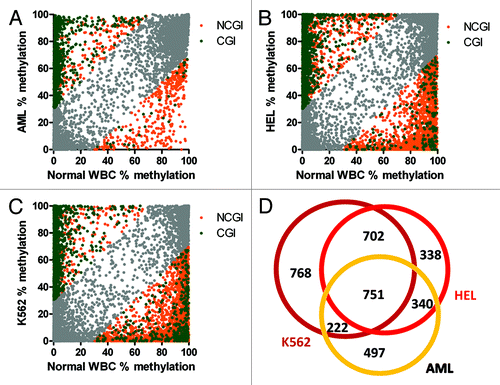
Changes in DNA methylation were further accentuated in leukemia cell lines. HEL human erythroleukemia cell line showed methylation differences greater than 30% compared with normal WBCs at 4,892 sites (28%) of 17,558 CpG sites covered by 100+ reads. Hypermethylation was observed at 1,698 CGI and 567 NCGI sites. Hypomethylation affected 207 CGI and 2,420 NCGI sites (). Methylation changes in the HEL leukemia cell line were associated with 2,131 genes. Top functional terms were neuron differentiation (128 genes, enrichment 2.8, FDR 8.0 × 10⁻²⁵), sequence-specific DNA binding (157 genes, enrichment 2.4, FDR 5.2 × 10⁻²⁴), developmental protein (177 genes, enrichment 2.2, FDR 2.810−22) and homeobox (84 genes, enrichment 3.4, FDR 1.8 × 10⁻²¹).
K562 myeloid leukemia cell line revealed methylation differences greater than 30% compared with normal WBCs at 5,964 sites (36%) of 16,694 CpG sites covered by 100+ reads. Hypermethylation was observed at 1,344 CGI and 295 NCGI sites. Large-scale hypomethylation was a dominant feature in K562, affecting 382 CGI and 3,943 NCGI sites (). Methylation changes were associated with 2,443 genes. Top functional terms were transcription factor activity (211 genes, enrichment 1.8, FDR 5.0 × 10⁻¹⁶), sequence-specific DNA binding (147 genes, enrichment 2.0, FDR 1.2 × 10⁻¹⁴), developmental protein (172 genes, enrichment 1.9, FDR 1.5 × 10⁻¹⁴), neuron differentiation (109 genes, enrichment 2.1, FDR 3.0 × 10⁻¹¹) and homeobox (72 genes, enrichment 2.6, FDR 5.4 × 10⁻¹¹).
We observed a significant overlap of 751 genes affected by methylation changes among the AML patient sample and the leukemia cell lines (). The genes with common methylation changes were enriched for the following functional terms: transcription factor activity (110 genes, enrichment 3.0, FDR 9.2 × 10⁻²³), sequence-specific DNA binding (82 genes, enrichment 3.6, FDR 6.5 × 10⁻²¹) and homeobox (48 genes, enrichment 5.6, FDR 9.8 × 10⁻¹⁹).
We next asked whether methylation changes in leukemia affect similar or different categories of genes based on the distance of CpG sites from TSSs. Altogether, 161 CpG sites located within 1 kb from TSSs had consistent methylation differences of more than 30% from normal WBCs in all 3 leukemia samples. These sites were associated with 129 genes, showing functional enrichment for sequence-specific DNA binding (16 genes, enrichment 4.1, FDR 0.008) and homeobox (10 genes, enrichment 6.8, FDR 0.021). There were also 159 sites distant more than 5 kb from a TSS showing > 30% methylation changes consistent in all 3 leukemia samples. These sites were associated with 123 genes. Median distance of differentially methylated CpG sites from TSS was 18 kb. Interestingly, these genes affected by distant methylation changes showed higher statistical significance for functional enrichment than the genes affected by methylation changes close to TSS. Top functional terms were DNA binding (43 genes, enrichment 2.8, FDR 7.0 × 10⁻⁸), regulation of transcription (45 genes, enrichment 2.5, FDR 7.4 × 10⁻⁷) and homeobox (11 genes, enrichment 7.3, FDR 0.003). Although there was practically no overlap between the genes associated with “close” vs. “distant” affected sites with the exception of ARRDC2 gene, functional gene categories were virtually identical.
Repetitive sequences
Uniquely mapped CpG sites represented approximately two thirds (65% ± 1%) of the total number of sequencing reads. One third (35 ± 1%) of reads (over 30 million per a HiSeq flow cell lane) could be mapped to multiple locations in the genome (Table S1). Of these, SINE repeats were the most frequent (20% or total reads), low complexity repeats, LTR and LINE repeats followed with 6%, 3% and 2% of total reads, respectively ().
Figure 5. Methylation of repetitive elements. (A) Proportions of uniquely mapped reads and reads mapped to repetitive elements. (B) Repetitive elements showing high levels of methylation in normal blood were hypomethylated in leukemia. (C) Repeats with low methylation levels in normal blood became hypermethylated in leukemia. CB, cord blood; WBC, adult blood white blood cells; AML, bone marrow from an acute myeloid leukemia patient; HEL, human erythroleukemia cell line; K562, human myeloid leukemia cell line.
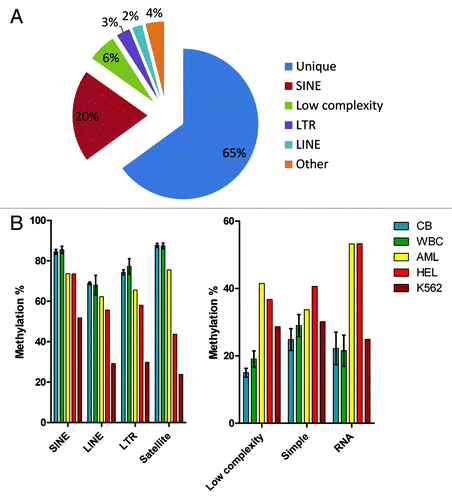
Methylation of repetitive sequences followed the pattern observed at uniquely mapped CCCGGG sites. We found no significant differences in methylation of different repeat classes between the cord blood samples and normal adult WBCs. Repetitive sequences with high levels of methylation in cord blood and normal WBCs (SINE, LINE, LTR and satellite repeats) showed significant hypomethylation (p < 0.05) in leukemia samples (the AML patient and 2 leukemia cell lines). The most profound hypomethylation was observed in the K562 cell line (). Conversely, repeats with low methylation in the cord blood and normal WBC (low complexity repeats, simple repeats, rRNA and tRNA repeats) revealed increased methylation in leukemia (). The differences in methylation of low complexity and RNA repeats between normal blood cells and leukemia were statistically significant (p < 0.05).
Discussion
We have described a novel method measuring DNA methylation based on methylation-specific signatures generated by sequential restriction digests of genomic DNA. Using next generation sequencing for reading of these signatures at individual restriction sites, our method provides highly quantitative information on methylation levels at approximately 150,000 unique CpG sites across the human genome. The method can detect methylation levels over 1%, is highly reproducible and can distinguish differences in methylation over 10% with a false positive rate below 0.05.
We have shown that CpG sites within 1 kb from gene transcription start sites are mostly unmethylated, while CpG sites distant from TSS are largely methylated. Relatively few genes showed intermediate methylation at TSS. These included genes located on the X chromosome in females, known or predicted imprinted genesCitation15 and haploid differentially methylated regions.Citation16 Methylation patterns were remarkably conserved between different healthy individuals. Inter individual differences in methylation greater than 30% were observed at 0.8% of interrogated CpG sites, mostly outside of CpG islands and distant from TSS. Comparison of healthy adult leukocytes and cord blood cells showed changes affecting only less than hundred CpG sites. Adult blood cells showed more CGI sites hypermethylated and more NCGI sites hypomethylated. Albeit small, these DNA methylation changes may be signs of epigenome aging.Citation21 Importantly, they show a similar pattern as the changes found in leukemia samples: hypermethylation of sites close to the TSS and within CpG islands plus hypomethylation of sites outside CpG islands and distant to the TSS. Our results are in a good agreement with previous studies documenting the unmethylated status of CpG islands, paucity of methylation near TSS and general methylated status of NCGI regions distant from TSS.Citation12,Citation22,Citation23 We have also shown the capacity of our method to map thousands of CpG sites affected by focal hypermethylation and global hypomethylation in leukemia.
Methods for mapping of DNA methylation rely on three main principles: (1) affinity capture of methylated DNA with an antibody against 5-methylcytosineCitation24 or methyl-binding proteins,Citation25,Citation26 (2) bisulfite conversion of unmethylated cytosines to uracilCitation27 and (3) distinction of methylated and unmethylated cytosines by methylation-sensitive restriction enzymes.Citation28,Citation29 All three principles of DNA methylation analysis have been applied to next generation sequencing.Citation12,Citation30-Citation33
Methods based on affinity enrichment of methylated DNACitation30,Citation33,Citation34 provide a good genome-wide detection of methylated regions, however, they do not give information on methylation status of individual CpG sites, they are affected by varying CpG density and thus difficult to quantify.Citation35
Bisulfite based methods are still regarded as the gold standard for detection of cytosine methylation status. Whole genome shotgun bisulfite sequencing (WGSBS) gives complete information on DNA methylome with a single base resolution.Citation16,Citation23,Citation36 However, high sequencing costs associated with shotgun sequencing of bisulfite-converted genome make this method impractical for studies of larger amounts of samples. Distribution of CpG dinucleotides in the human genome shows great heterogeneity, therefore the majority of reads from WGSBS do not carry any information on cytosine methylation. Focusing on regions with moderate to high CpG density carrying the most of epigenetic information brings considerable savings. Reduced representation bisulfite sequencing (RRBS)Citation12,Citation37 analyzes approximately 1% of the genome enriched for CpG sites by a restriction digest with a CpG methylation-insensitive enzyme MspI (C/CGG), selection of small fragments, bisulfite treatment and sequencing. DNA methylation status of individual CpG sites is determined from the sequence of bisulfite converted DNA. However, quantitative accuracy of RRBS may be affected by unequal efficiency of PCR amplification of unmethylated and methylated DNA due to different C content in the sequences and also by < 100% efficiency of bisulfite conversion.
Specific restriction enzymes can detect methylation with a high precision, since CpG methylation in the recognition sequence can completely block their activity. Most restriction enzyme based assays distinguish DNA methylation status by comparison of parallel samples digested with methylation-sensitive and methylation-insensitive enzymes. For example, HELP assayCitation28 analyzes methylation at CCGG sites. A library of unmethylated DNA fragments digested by HpaII is compared with a library of all fragments with CCGG recognition sites, created by digestion with CpG methylation-insensitive enzyme MspI. CpG methylation at a particular CCGG site is inferred from its absence in the HpaII library. Another approach for indirect estimation of methylation status was to compare libraries of unmethylated fragments created by three different enzymes cutting unmethylated DNA (MRE-seq) with a library enriched for methyl-cytosine-containing DNA fragments by an antibody against 5-methyl-cytosine (MeDIP).Citation32 In contrast with these indirect methods, DREAM reads methylation status directly from the sequence in a single library.
The advantage of our DREAM method is that nucleotides are unchanged, which simplifies mapping of sequencing reads. Additionally, potential SNPs at recognition CCCGGG sites do not result in false methylation readings unless the region is subject to mono-allelic methylation. The sites changed by a SNP are not recognized by the restriction enzymes and are thus not included in the analysis. The method is able to reliably detect very low levels of methylation (over 1%) and has thus a lower background than bisulfite pyrosequencing or methylation microarrays. Compared with the bisulfite-based approach, the method is technically very simple. Multiplexing of several libraries in a single sequencing lane makes the method affordable for studies using large number of samples.
Although simple, accurate and versatile, our proposed method has several limitations. It can measure DNA methylation only in a restricted subset of CpG sites that are within the CCCGGG recognition site. The human genome contains approximately 374,000 of these sites, which is only 1.3% of the total number of CpG sites. Methylation status is determined only at the edges of restriction fragments. In this sense, the method is similar to methylation microarrays where probes are designed for a few representative CpG sites for a gene promoter.Citation38 However, this approach is justified by the fact that methylation status of CpG sites in the neighborhood of several hundred bases is mostly concordant.Citation16,Citation39 Moreover, we have shown an excellent correlation of DREAM with methylation values of neighboring CpG sites obtained by bisulfite sequencing, bisulfite pyrosequencing and also with publicly available results of reduced representation bisulfite sequencing. Our method also cannot distinguish methyl-cytosine from hydroxymethyl-cytosine, a shortcoming common to all methods based on restriction enzymes and bisulfite conversion.
The quantitative nature and high sensitivity of our method make it suitable for studies of DNA methylation changes in cancer and of the effects of epigenetic therapies. The method can be used outside of the cancer field to measure DNA methylation changes in common diseases, aging and for dissecting the effects of environment or diet on the epigenome. The use of sequencing for reading methylation signatures makes the method more versatile than microarrays and suitable for gaining insights in mammalian epigenomes where the reference genome exists. We have shown the potential for mapping DNA methylation changes associated with the loss of Dnmt3a function in the mouse model.Citation40 Detecting relatively small differences in DNA methylation could be important when studying subtle changes. These may include quantifying environmental or dietary effects on DNA methylation, correlating developmental epigenetic variation with phenotypes, measuring the effects of DNA methylation modifying drugs or deriving new biological insights into mammalian genomes.
Material and Methods
DNA samples
We used genomic DNA isolated from white blood cells of 4 healthy individuals, 2 samples of cord blood mononuclear cells, bone marrow cells from a patient with acute myeloid leukemia (AML) and 2 myeloid leukemia cell lines. The Institutional Review Board at MD Anderson and Temple University approved all protocols, and all individuals gave informed consent for the collection of blood and residual tissues as per institutional guidelines and in accordance with the Declaration of Helsinki. The leukemia cell lines K562 (CCL-243) and HEL 92.1.7 (TIB-180) used in this study were obtained from the American Type Culture Collection.
Methylation standards
We created methylation standards to be spiked in genomic DNA before each analysis. The standards consist of five different PCR products based on DNA sequences of the lambda bacteriophage, luciferase, GFP and Taq polymerase. We used existing and created additional CCCGGG sites, so that each PCR product had 2 CCCGGG sites with a distance from 168 to 255 bp (Table S3). Portions of the PCR products were fully methylated at CG sites by the M.SssI methylase (New England Biolabs) and mixed with unmethylated PCR products to achieve methylation levels of 0, 25, 50, 75 and 100%. We spiked in 10 picograms of each standard into 5 µg of gDNA before further processing.
Digital restriction enzyme analysis of methylation (DREAM)
Five micrograms of genomic DNA spiked with 5 methylation standards with defined methylation levels of 0, 25, 50, 75 and 100% were digested with 100 units of SmaI endonuclease (NEB) for 3 h at 25°C. Subsequently, 100 units of XmaI endonuclease (NEB) were added and the digestion was continued for additional 16 h at 37°C. Digested DNA was purified using QIAquick PCR purification kit (Qiagen) and eluted in TRIS-HCl 10 mM pH 8.5 (EB). Eluted DNA was supplemented with NEB buffer #2, dCTP, dGTP and dATP (0.4 mM final concentration of each), 15 units of Klenow Fragment (3′→5′ exonuclease deficient) DNA polymerase (NEB) and incubated for 30 min at 37°C. This step filled in the recesses at 3′ DNA ends created by XmaI digestion and added 3′ dA tails to all fragments. Illumina paired endCitation41 or barcoded Truseq (Illumina) sequencing adapters were then ligated at 10:1 adaptor:fragment ratio using Rapid T4 DNA ligase (Enzymatics). The ligation mix was size selected by electrophoresis in 2% agarose. Two slices corresponding to 250–350 bp and 350–500 bp sizes based on a 100 bp DNA ladder (NEB) were cut out and DNA was extracted from agarose. DNA eluted from the slices was separately amplified with Illumina paired end PCR primersCitation41 using iProof high-fidelity DNA polymerase (Bio-Rad Laboratories) and 18 cycles of amplification. Resulting sequencing libraries were purified with AMPure magnetic beads (Agencourt). The libraries were sequenced by paired-end 36 nt sequencing on Illumina Genome Analyzer II or Illumina HiSeq 2000 at the MD Anderson Center for Cancer Epigenetics. We spiked in 10% of PhiX standard in each HiSeq lane to compensate for the lack of diversity in the first 5 bases of sequencing. Typically, about 20 million (Genome Analyzer II) or 100 million (HiSeq 2000) sequences representing individual DNA molecules were collected from each sequencing lane. Sequencing reads were mapped to SmaI sites in the human genome and signatures corresponding to methylated and unmethylated CpG were enumerated for each SmaI site. The coverage by sequencing reads (sequencing depth) and methylation frequencies for each individual SmaI sites were then calculated. The results were assembled for further analysis in the Microsoft Access relational database containing the full annotation of all SmaI sites in the human genome.
Mapping of sequencing reads
Mapping to SmaI sites can be performed by the standard aligners to reference genomes, such as BowtieCitation42 and BWA.Citation43 To improve the efficiency, the software places an upper limit on the number of allowed mismatches. At the beginning of the project, it could not align all the reads, since the sequencing quality was lower at that time. We therefore wrote a program in C++ that maps the reads to 374,165 SmaI sites in the human genome (NCBI36/hg18) allowing arbitrary number of mutations. We first selected only the reads that had passed Illumina purity filter. We then sorted the reads by their sequence so that we only mapped the repetitive sequences once. We then computed the Hamming distance between the reads and of all the SmaI fragments. Hamming distance is equal to the number of different nucleotides. We kept track of the best and second best matches. We empirically determined the thresholds: the best match was required to have a Hamming distance of less than or equal to nine. If the Hamming distance for the best match is close to the second best match, it means that reads can be mapped to more than one location. The threshold was determined empirically to be six from the histogram of the gap as the difference of Hamming distance between the best and second best matches.
Modeling methylation standards
Restriction enzymes are less than 100% efficient, which can distort the methylation estimate. The standards of known methylation ratio were designed to monitor and validate the measurement, making sure that the methylation ratio was accurate. They could also be used to correct any distortion in the methylation ratio. In practice, SmaI is close to 100% efficient. Thus we derived a formula assuming the efficiency of the XmaI enzyme for methylated DNA is s = ex, where 0 < ex ≤ 1. Let m and u be the number of molecules that are methylated and unmethylated for a particular SmaI site. After digestion with two restriction enzymes, we have u molecules with unmethylation signature and moleculest with methylated signature. Therefore the measured methylation ratio is
. The true methylation ratio is
, which is related to the measured methylation by
. It is also easy to show that when the efficiency of filling-in reaction is not 100%, the same formula holds true, but now s=exf, where f is the efficiency of filling-in reaction.
We corrected methylation levels measured by DREAM based on the values obtained from the spiked in standards. First, we calculated log ratios ln(m/u) and ln(sm/u) for each standard, where m/u is the expected ratio of methylated and unmethylated reads, while sm and u are observed numbers of methylated and unmethylated reads. Differences in the expected minus observed log ratios were calculated for each standard. Correction factor c was calculated as an antilog of the average log difference (expected – observed). Corrected methylation values were then computed as 100% × [c × sm/(c × sm+u)] for each CpG site.
Bisulfite sequencing and pyrosequencing
Genomic DNA was treated with bisulfite using Epitect kit (Qiagen). Bisulfite cloning/sequencing and pyrosequencing were performed as described previously.Citation40 Briefly, bisulfite PCR products were cloned in the TOPO-TA sequencing vector. Twelve to 24 clones were sequenced at Beckman Coulter Genomics. The sequences of individual clones were analyzed by the QUMA online tool.Citation44 We performed bisulfite pyrosequencing as described previously.Citation45,Citation46
Additional material
Download Zip (39 MB)Acknowledgments
The data discussed in this publication have been deposited in NCBI's Gene Expression OmnibusCitation47 and are accessible through GEO Series accession number GSE39787 (www.ncbi.nlm.nih.gov/geo/query/acc.cgi?acc=GSE39787). This work was supported by National Institutes of Health grants CA100632, CA121104, CA046939, CA123344, CA016672 and DE022015; a grant from the Stand Up to Cancer Foundations and a grant from the University of Texas MD Anderson Center for Cancer Epigenetics. J.P.I. is an American Cancer Society Clinical Research professor supported by a generous gift from the F. M. Kirby Foundation.
Disclosure of Potential Conflicts of Interest
No potential conflicts of interest were disclosed.
Supplemental Materials
Supplemental materials may be found here: www.landesbioscience.com/journals/epigenetics/article/22552
References
- Cedar H. DNA methylation and gene activity. Cell 1988; 53:3 - 4; http://dx.doi.org/10.1016/0092-8674(88)90479-5; PMID: 3280142
- Jenuwein T, Allis CD. Translating the histone code. Science 2001; 293:1074 - 80; http://dx.doi.org/10.1126/science.1063127; PMID: 11498575
- Zaratiegui M, Irvine DV, Martienssen RA. Noncoding RNAs and gene silencing. Cell 2007; 128:763 - 76; http://dx.doi.org/10.1016/j.cell.2007.02.016; PMID: 17320512
- Raynal NJ, Si J, Taby RF, Gharibyan V, Ahmed S, Jelinek J, et al. DNA methylation does not stably lock gene expression but instead serves as a molecular mark for gene silencing memory. Cancer Res 2012; 72:1170 - 81; http://dx.doi.org/10.1158/0008-5472.CAN-11-3248; PMID: 22219169
- Rollins RA, Haghighi F, Edwards JR, Das R, Zhang MQ, Ju J, et al. Large-scale structure of genomic methylation patterns. Genome Res 2006; 16:157 - 63; http://dx.doi.org/10.1101/gr.4362006; PMID: 16365381
- Jones PA, Baylin SB. The epigenomics of cancer. Cell 2007; 128:683 - 92; http://dx.doi.org/10.1016/j.cell.2007.01.029; PMID: 17320506
- Laird PW. Principles and challenges of genomewide DNA methylation analysis. Nat Rev Genet 2010; 11:191 - 203; http://dx.doi.org/10.1038/nrg2732; PMID: 20125086
- Warnecke PM, Stirzaker C, Melki JR, Millar DS, Paul CL, Clark SJ. Detection and measurement of PCR bias in quantitative methylation analysis of bisulphite-treated DNA. Nucleic Acids Res 1997; 25:4422 - 6; http://dx.doi.org/10.1093/nar/25.21.4422; PMID: 9336479
- Shen L, Guo Y, Chen X, Ahmed S, Issa JP. Optimizing annealing temperature overcomes bias in bisulfite PCR methylation analysis. Biotechniques 2007; 42:48 - , 50, 52 passim; http://dx.doi.org/10.2144/000112312; PMID: 17269485
- Gardiner-Garden M, Frommer M. CpG islands in vertebrate genomes. J Mol Biol 1987; 196:261 - 82; http://dx.doi.org/10.1016/0022-2836(87)90689-9; PMID: 3656447
- ENCODE Project Consortium. A user’s guide to the encyclopedia of DNA elements (ENCODE). PLoS Biol 2011; 9:e1001046; http://dx.doi.org/10.1371/journal.pbio.1001046; PMID: 21526222
- Meissner A, Mikkelsen TS, Gu H, Wernig M, Hanna J, Sivachenko A, et al. Genome-scale DNA methylation maps of pluripotent and differentiated cells. Nature 2008; 454:766 - 70; PMID: 18600261
- Bibikova M, Barnes B, Tsan C, Ho V, Klotzle B, Le JM, et al. High density DNA methylation array with single CpG site resolution. Genomics 2011; 98:288 - 95; http://dx.doi.org/10.1016/j.ygeno.2011.07.007; PMID: 21839163
- Carrel L, Willard HF. X-inactivation profile reveals extensive variability in X-linked gene expression in females. Nature 2005; 434:400 - 4; http://dx.doi.org/10.1038/nature03479; PMID: 15772666
- Luedi PP, Dietrich FS, Weidman JR, Bosko JM, Jirtle RL, Hartemink AJ. Computational and experimental identification of novel human imprinted genes. Genome Res 2007; 17:1723 - 30; http://dx.doi.org/10.1101/gr.6584707; PMID: 18055845
- Li Y, Zhu J, Tian G, Li N, Li Q, Ye M, et al. The DNA methylome of human peripheral blood mononuclear cells. PLoS Biol 2010; 8:e1000533; http://dx.doi.org/10.1371/journal.pbio.1000533; PMID: 21085693
- Harris RA, Wang T, Coarfa C, Nagarajan RP, Hong C, Downey SL, et al. Comparison of sequencing-based methods to profile DNA methylation and identification of monoallelic epigenetic modifications. Nat Biotechnol 2010; 28:1097 - 105; http://dx.doi.org/10.1038/nbt.1682; PMID: 20852635
- Futreal PA, Coin L, Marshall M, Down T, Hubbard T, Wooster R, et al. A census of human cancer genes. Nat Rev Cancer 2004; 4:177 - 83; http://dx.doi.org/10.1038/nrc1299; PMID: 14993899
- Huang W, Sherman BT, Lempicki RA. Systematic and integrative analysis of large gene lists using DAVID bioinformatics resources. Nat Protoc 2009; 4:44 - 57; http://dx.doi.org/10.1038/nprot.2008.211; PMID: 19131956
- Huang W, Sherman BT, Lempicki RA. Bioinformatics enrichment tools: paths toward the comprehensive functional analysis of large gene lists. Nucleic Acids Res 2009; 37:1 - 13; http://dx.doi.org/10.1093/nar/gkn923; PMID: 19033363
- Maegawa S, Hinkal G, Kim HS, Shen L, Zhang L, Zhang J, et al. Widespread and tissue specific age-related DNA methylation changes in mice. Genome Res 2010; 20:332 - 40; http://dx.doi.org/10.1101/gr.096826.109; PMID: 20107151
- Weber M, Hellmann I, Stadler MB, Ramos L, Pääbo S, Rebhan M, et al. Distribution, silencing potential and evolutionary impact of promoter DNA methylation in the human genome. Nat Genet 2007; 39:457 - 66; http://dx.doi.org/10.1038/ng1990; PMID: 17334365
- Lister R, Pelizzola M, Dowen RH, Hawkins RD, Hon G, Tonti-Filippini J, et al. Human DNA methylomes at base resolution show widespread epigenomic differences. Nature 2009; 462:315 - 22; http://dx.doi.org/10.1038/nature08514; PMID: 19829295
- Rougier N, Bourc’his D, Gomes DM, Niveleau A, Plachot M, Pàldi A, et al. Chromosome methylation patterns during mammalian preimplantation development. Genes Dev 1998; 12:2108 - 13; http://dx.doi.org/10.1101/gad.12.14.2108; PMID: 9679055
- Cross SH, Charlton JA, Nan X, Bird AP. Purification of CpG islands using a methylated DNA binding column. Nat Genet 1994; 6:236 - 44; http://dx.doi.org/10.1038/ng0394-236; PMID: 8012384
- Rauch T, Pfeifer GP. Methylated-CpG island recovery assay: a new technique for the rapid detection of methylated-CpG islands in cancer. Lab Invest 2005; 85:1172 - 80; http://dx.doi.org/10.1038/labinvest.3700311; PMID: 16025148
- Frommer M, McDonald LE, Millar DS, Collis CM, Watt F, Grigg GW, et al. A genomic sequencing protocol that yields a positive display of 5-methylcytosine residues in individual DNA strands. Proc Natl Acad Sci U S A 1992; 89:1827 - 31; http://dx.doi.org/10.1073/pnas.89.5.1827; PMID: 1542678
- Khulan B, Thompson RF, Ye K, Fazzari MJ, Suzuki M, Stasiek E, et al. Comparative isoschizomer profiling of cytosine methylation: the HELP assay. Genome Res 2006; 16:1046 - 55; http://dx.doi.org/10.1101/gr.5273806; PMID: 16809668
- Toyota M, Ho C, Ahuja N, Jair KW, Li Q, Ohe-Toyota M, et al. Identification of differentially methylated sequences in colorectal cancer by methylated CpG island amplification. Cancer Res 1999; 59:2307 - 12; PMID: 10344734
- Down TA, Rakyan VK, Turner DJ, Flicek P, Li H, Kulesha E, et al. A Bayesian deconvolution strategy for immunoprecipitation-based DNA methylome analysis. Nat Biotechnol 2008; 26:779 - 85; http://dx.doi.org/10.1038/nbt1414; PMID: 18612301
- Oda M, Glass JL, Thompson RF, Mo Y, Olivier EN, Figueroa ME, et al. High-resolution genome-wide cytosine methylation profiling with simultaneous copy number analysis and optimization for limited cell numbers. Nucleic Acids Res 2009; 37:3829 - 39; http://dx.doi.org/10.1093/nar/gkp260; PMID: 19386619
- Maunakea AK, Nagarajan RP, Bilenky M, Ballinger TJ, D’Souza C, Fouse SD, et al. Conserved role of intragenic DNA methylation in regulating alternative promoters. Nature 2010; 466:253 - 7; http://dx.doi.org/10.1038/nature09165; PMID: 20613842
- Serre D, Lee BH, Ting AH. MBD-isolated Genome Sequencing provides a high-throughput and comprehensive survey of DNA methylation in the human genome. Nucleic Acids Res 2010; 38:391 - 9; http://dx.doi.org/10.1093/nar/gkp992; PMID: 19906696
- Brinkman AB, Simmer F, Ma K, Kaan A, Zhu J, Stunnenberg HG. Whole-genome DNA methylation profiling using MethylCap-seq. Methods 2010; 52:232 - 6; http://dx.doi.org/10.1016/j.ymeth.2010.06.012; PMID: 20542119
- Bock C, Tomazou EM, Brinkman AB, Müller F, Simmer F, Gu H, et al. Quantitative comparison of genome-wide DNA methylation mapping technologies. Nat Biotechnol 2010; 28:1106 - 14; http://dx.doi.org/10.1038/nbt.1681; PMID: 20852634
- Berman BP, Weisenberger DJ, Aman JF, Hinoue T, Ramjan Z, Liu Y, et al. Regions of focal DNA hypermethylation and long-range hypomethylation in colorectal cancer coincide with nuclear lamina-associated domains. Nat Genet 2012; 44:40 - 6; http://dx.doi.org/10.1038/ng.969; PMID: 22120008
- Gu H, Smith ZD, Bock C, Boyle P, Gnirke A, Meissner A. Preparation of reduced representation bisulfite sequencing libraries for genome-scale DNA methylation profiling. Nat Protoc 2011; 6:468 - 81; http://dx.doi.org/10.1038/nprot.2010.190; PMID: 21412275
- Bibikova M, Le J, Barnes B, Saedinia-Melnyk S, Zhou L, Shen R, et al. Genome-wide DNA methylation profiling using Infinium® assay. Epigenomics 2009; 1:177 - 200; http://dx.doi.org/10.2217/epi.09.14; PMID: 22122642
- Eckhardt F, Lewin J, Cortese R, Rakyan VK, Attwood J, Burger M, et al. DNA methylation profiling of human chromosomes 6, 20 and 22. Nat Genet 2006; 38:1378 - 85; http://dx.doi.org/10.1038/ng1909; PMID: 17072317
- Challen GA, Sun D, Jeong M, Luo M, Jelinek J, Berg JS, et al. Dnmt3a is essential for hematopoietic stem cell differentiation. Nat Genet 2012; 44:23 - 31; http://dx.doi.org/10.1038/ng.1009; PMID: 22138693
- Quail MA, Kozarewa I, Smith F, Scally A, Stephens PJ, Durbin R, et al. A large genome center’s improvements to the Illumina sequencing system. Nat Methods 2008; 5:1005 - 10; http://dx.doi.org/10.1038/nmeth.1270; PMID: 19034268
- Langmead B, Trapnell C, Pop M, Salzberg SL. Ultrafast and memory-efficient alignment of short DNA sequences to the human genome. Genome Biol 2009; 10:R25; http://dx.doi.org/10.1186/gb-2009-10-3-r25; PMID: 19261174
- Li H, Durbin R. Fast and accurate short read alignment with Burrows-Wheeler transform. Bioinformatics 2009; 25:1754 - 60; http://dx.doi.org/10.1093/bioinformatics/btp324; PMID: 19451168
- Kumaki Y, Oda M, Okano M. QUMA: quantification tool for methylation analysis. Nucleic Acids Res 2008; 36:Web Server issue W170-5; http://dx.doi.org/10.1093/nar/gkn294; PMID: 18487274
- Jelinek J, Gharibyan V, Estecio MR, Kondo K, He R, Chung W, et al. Aberrant DNA methylation is associated with disease progression, resistance to imatinib and shortened survival in chronic myelogenous leukemia. PLoS One 2011; 6:e22110; http://dx.doi.org/10.1371/journal.pone.0022110; PMID: 21760961
- Kroeger H, Jelinek J, Estécio MR, He R, Kondo K, Chung W, et al. Aberrant CpG island methylation in acute myeloid leukemia is accentuated at relapse. Blood 2008; 112:1366 - 73; http://dx.doi.org/10.1182/blood-2007-11-126227; PMID: 18523155
- Edgar R, Domrachev M, Lash AE. Gene Expression Omnibus: NCBI gene expression and hybridization array data repository. Nucleic Acids Res 2002; 30:207 - 10; http://dx.doi.org/10.1093/nar/30.1.207; PMID: 11752295