Abstract
Immune factors are thought to influence glioma risk and outcomes, but immune profiling studies to further our understanding of the immune response are limited by current immunodiagnostic methods. We developed a new assay to capture glioma immune biology based on quantitative methylation specific PCR (qMSP) of two T-cell genes (CD3Z: T-cells, and FOXP3: Tregs). Flow cytometry of T-cells correlated well with the CD3Z demethylation assay (r = 0.93; p < 2.2 × 10⁻¹⁶), demonstrating the validity of the assay. Furthermore, there was a high correlation between qMSP and immunohistochemistry (IHC) in quantifying tumor infiltrating T-cells (r = 0.85; p = 3.4 × 10⁻¹¹). Applying our qMSP methods to archival whole blood from 65 glioblastoma multiforme (GBM) cases and 94 non-diseased controls, GBM cases had highly statistically significantly lower T-cells (p = 1.7 × 10⁻⁹) as well as Tregs (p = 5.2 × 10⁻¹¹) and a modestly lower ratio of Tregs/T-cells (p = 0.024). Applying the methods to 120 excised glioma tumors, we observed that tumor infiltrating CD3+ T-cells were positively correlated with glioma tumor grade (p = 5.7 × 10⁻⁷), and that Tregs were enriched in tumors compared with peripheral blood indicating active chemoattraction of suppressive Tregs into the tumor compartment. Poorer patient survival was correlated with higher levels of tumor infiltrating T-cells (p = 0.01) and Tregs (p = 0.04). DNA methylation based immunodiagnostics represent a new generation of powerful laboratory tools offering many advantages over conventional methods that will facilitate large clinical epidemiologic studies and capitalize on stored archival blood and tissue banks.
Keywords: :
Introduction
Gliomas are a histologically diverse cancer with few established risk factors and poor prognosis.Citation1-Citation4 However, immune factors are associated with increased glioma risk and are also thought to play a role in patient outcomes.Citation5,Citation6 Peripheral immune defects have long been documented in glioma. Patients with glioblastoma (GBM) exhibit the most dramatic abnormalitiesCitation7,Citation8 of T-cell response associated with pronounced reductions in T-cell numbers in peripheral blood.Citation9 The absolute counts of suppressive regulatory T-cells (Tregs), like other CD3+ and CD4+ cells, are greatly reduced in the blood of GBM patients.Citation9 It has been suggested that despite low Treg counts, the ratio of Tregs to T-cells is clinically relevant in immunosuppression. Yet to date there is no validated method to quantify this ratio. The quantification of immunosuppression may also help in characterizing patient tumors. An immunosuppressive environment in glioma is also suggested by the accumulation of tumor infiltrating lymphocytes (TILs) displaying markers of Tregs (i.e., cell membrane CD4 and CD25 and intracellular staining of the FOXP3 protein). Using these conventional markers investigators have reported that Tregs are increased in high-grade GBM tissues but not in lower grade tumors and are associated with the astrocytic compared with oligodendroglial or ependymal histologies.Citation10,Citation11
The etiologic and prognostic significance of T-cell alterations in glioma is unknown. In one study examining glioma tissues and outcomes no association of Treg accumulation with survival was observedCitation12 whereas an adverse influence of Tregs on glioma survival was reported in a second study.Citation13 A potential issue in these discordant results is the lack of robust markers of Tregs. For example, while FOXP3 is a recognized essential differentiation marker for Tregs,Citation14 it has been shown to be expressed transiently within induced Tregs without a stable suppressive phenotype.Citation15-Citation18 Recently, epigenetic markers involving the demethylation of the FOXP3 gene have been determined to be the most specific marker of stable Tregs.Citation19-Citation21 When information on the FOXP3 differentially methylated region (DMR) is combined with quantitative methylation specific PCR (qMSP) it is possible to obtain highly sensitive and accurate counts of Tregs in blood and tissues. Such DNA-based methods to interrogate specific populations of T-cell subsets are far less expensive than flow-cytometry and can be applied to archival specimens. Recognizing that immune alterations in human glioma affect not only Tregs but also the T-cell compartment more generally, and potentially the balance of Tregs to T-cells, we sought additional epigenetic markers for T-cells.
Because DMRs are implicated in many aspects of T-cell differentiation,Citation22 we hypothesized that markers could be discovered that would provide information on the overall T-cell compartment. Here we developed such a DMR marker for T-cells that can be used alone or in conjunction with the previously described Treg DMR marker. We describe a quantitative assay for T-cells based on the demethylation of the promoter of a component of the T-cell receptor complex: CD3Z (CD247). We show the validity of CD3Z demethylation as a T-cell marker and illustrate its application in patients with glioma that demonstrate the high discriminating value of CD3Z demethylation in case-control comparisons, histopathological characterization of tumors and patient prognosis.
Results
Cell-specific epigenetic biomarker development
The workflow for the developmental phase of this study is illustrated in Figure S1. First, putative T cell-specific DMRs were identified from Illumina Infinium HumanMethylation27 data for MACS purified, normal human leukocyte subsets by applying a linear mixed effects (LME) model with two fixed effect groups, T-cells and non-T-cells (including B-cells, NK cells, monocytes and granulocytes) using a false discovery rate (FDR) adjusted q-value of 0.05 as a significance cutoff. Unsupervised, hierarchical clustering of Infinium β values for the top 100 putative T cell-specific DMRs confirmed immune cell-lineage specific patterns of DNA methylation for the loci (). After integrating our DNA methylation analysis with published data on human leukocyte subtype RNA expression,Citation23 we selected putative T-cell specific DMRs with coordinately altered gene expression as candidate gene regions whose methylation signatures could serve as reliable epigenetic biomarkers of T-cells. Several components of the T-cell receptor (TCR) complex were among these candidates, including CD3D, CD3E, CD3G and CD3Z, all containing CpG loci that were demethylated in T-cells but methylated in B-cells, monocytes, and granulocytes. A CpG locus in CD3Z was demethylated in CD16+CD56dim NK cells, but methylated in CD16-CD56bright NK cells. CpG loci in the three other TCR subunits were methylated in all NK cell subtypes. All four TCR subunits were significantly overexpressed in T-cells compared with other leukocyte subtypes.Citation23
Figure 1. DNA methylation in MACS purified human leukocyte samples at immune cell-specific DMRs. (A) Illumina Infinium HumanMethylation27 data for top 100 putative T cell-specific DMRs identified from LME model. Beta values are scaled (zero centered) by gene locus. (B) MethyLight data for FOXP3 and CD3Z gene regions illustrating immune lineage-specific DNA methylation patterns. MACS purified cell type abbreviations: B, B lymphocytes; Gran, granulocytes; Neut, neutrophils; Mono, monocytes; NK, CD56+ natural killer cells; CD16+NK, CD16+CD56dim natural killer cells; CD16-NK, CD16-CD56bright natural killer cells; NKT, CD3+CD56+ natural killer T-cells; t, CD3+ T lymphocytes; Tc, CD3+CD8+ T lymphocytes (cytotoxic T-cells); Th, CD3+CD4+ T lymphocytes (helper T-cells); Treg, CD3+CD4+CD25+FOXP3+ regulatory T-cells
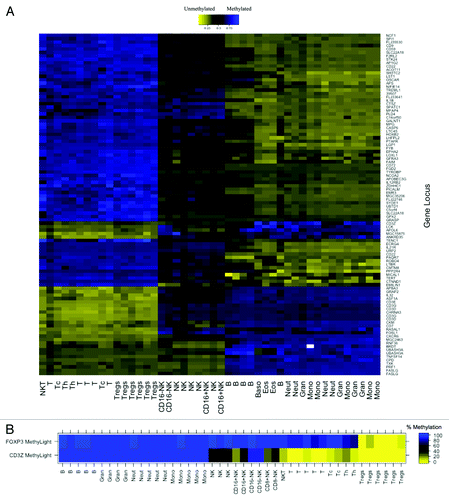
Our goal was to design a qMSP assay for the assessment of T-cell levels; therefore we had to consider amenability of the candidate gene regions to qMSP. A CpG island near the promoter of CD3Z that is immediately adjacent the Infinium microarray probe was optimally suited for qMSP assay design, whereas the other three TCR subunits did not contain suitable gene regions near their Infinium microarray probes. MethyLight and bisulfite pyrosequencing assays confirmed that DNA region in the CD3Z promoter is demethylated in T-cells and CD16+CD56dim NK cells, but methylated in B-cells, monocytes, granulocytes and CD16-CD56bright NK cells (; Fig. S2) and that a DNA region in the FOXP3 first intron is demethylated in Tregs, but methylated in all other leukocyte subtypes ().
Next, we set out to estimate T-cell numbers in cell mixtures by qMSP using the same primers and probe from the aforementioned CD3Z MethyLight assay, which target the unmethylated form of six CpG loci in the CD3Z promoter (). We generated a four-point calibration curve containing bisulfite converted DNA from MACS purified T-cells combined with bisulfite converted universal methylated DNA such that the total amount of DNA was held constant at 10,000 copies (33ng) for all four points, and demonstrated log-linear PCR kinetics over a range of CD3+ T-cell DNA inputs corresponding to 10 to 10,000 genomic copies (r = -0.99, p < 2.2 × 10⁻¹⁶; ; Fig. S3A). Likewise, we set out to estimate Treg numbers in cell mixtures by qMSP using the same primers and probe from the aforementioned FOXP3 MethyLight assay, which targets the unmethylated form of CpG loci in the FOXP3 first intron. We generated a four-point calibration curve using bisulfite converted DNA from MACS purified Tregs and bisulfite converted universal methylated DNA such that the total amount of DNA was held constant at 5,000 copies (16.5ng) for all four points and demonstrated log linear PCR kinetics over a range of Treg DNA inputs corresponding to 5 to 5,000 genomic copies (Fig. S3B). Taken together, these results indicate that the qMSP assays are able to detect a few demethylated cells within a background of many thousands of methylated cells.
Figure 2. CD3+ T-cell detection by qMSP. (A) Schematic showing methylation specific primers and probe targeting six CpGs (lollipops) in a region of the CD3Z gene identified as demethylated in CD3+ T-cells. (B) Real time PCR Ct values decrease linearly with 10-fold increase in bisulfite converted CD3+ T-cell DNA concentration. Bisulfite converted universal methylated DNA was used to keep total amount of DNA in all samples constant. At least five replicates of each sample are plotted. (C) Evaluation of CD3+ T-cell level by flow cytometry is highly correlated with T-cell quantification by CD3Z qMSP in whole blood specimens from glioma patients and healthy donors. (D) CD3+ T-cell count by imunohistochemical staining correlates with T-cell quantification by CD3Z qMSP in excised tumors across histological subtypes. Pearson correlations and F-test p values are shown in B‒D.
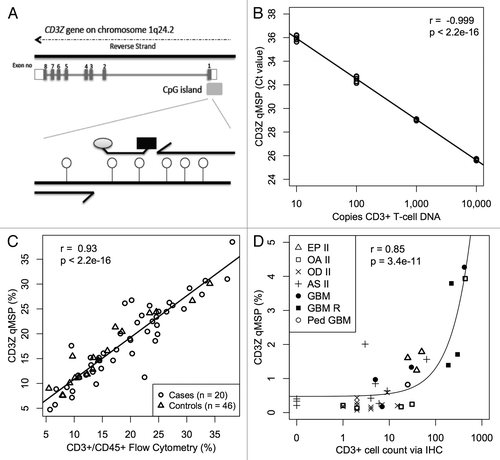
In order to estimate the total amount of DNA per reaction well, we used C-LESS qPCR primers and probe, which target a genomic sequence that does not contain any cytosine residues and therefore amplifies any human DNA regardless of its CpG methylation status.Citation24,Citation25 We generated a four-point standard curve consisting of human genomic DNA (gDNA) log diluted in buffer, and demonstrated log-linear PCR kinetics over a range of gDNA inputs corresponding to 30 to 30,000 genomic copies (Fig. S3C). For bisulfite converted samples, the resultant copy number needed to be multiplied by two, since C-LESS primers and probe hybridize to both strands of the non-bisulfite converted gDNA but bisulfite converted samples allow for only single strand hybridization during the first cycle. This allowed us to determine the percentage of total DNA input that was demethylated at a cell-specific DMR by dividing the number of demethylated CD3Z or FOXP3 DNA copies (estimated by qMSP using a T-cell or Treg calibration curve run on the same plate) by the total number of DNA copies (estimated by C-LESS qPCR using a gDNA standard curve).
Previous studies have validated the use of FOXP3 demethylation for the enumeration of Tregs in human blood and tissue.Citation26 Seeking to validate CD3Z demethylation for the enumeration of T-cells in human blood, we compared the results of our novel CD3Z qMSP assay to conventional fluorescence activated cell separation (FACS) measurement of T-cells in blood samples from 46 healthy controls and 20 glioma patients and found a high correlation (r = 0.93; p < 2.2 × 10⁻¹⁶; ). The uniform regression and close correspondence of the two methods was true for both glioma patients as well as healthy controls, thus ensuring that the disease process itself and treatment exposures did not influence the demethylation assay. In order to validate CD3Z demethylation for the quantification of T-cell infiltration into tissue we compared the results of our novel CD3Z qMSP assay to conventional immunohistochemistry (IHC) measurement of T-cells in 36 formalin fixed, paraffin embedded (FFPE) glioma tumors and found a significant association between the two methods (r = 0.85; p = 3.4 × 10⁻¹¹; ). Most CD3+ tumor infiltrating lymphocytes (TILs) were CD8+ and only a few stained positively for CD4+ (Fig. S4; data not shown). To ensure that CD3Z and FOXP3 are not significantly demethylated in normal brain or glioma tissue, we subjected five glioma cell lines (H4, A172, T98G, U138 and U87) and two glioma-free brain autopsy samples to the CD3Z and FOXP3 qMSP assays (Table S1A and B). We also considered the potential that glioma tissue displaying early neural features might ectopically express CD3Z, since it can be expressed in the rat during early neuronal development.Citation27 After comparing CD3Z expression among different gene expression classes of GBM within the TCGA database, we found no significant expression of CD3Z in any GBM tissue and no association with proneural expression signature.
Assessment of peripheral blood T-cells and Tregs by qMSP in glioma cases and controls
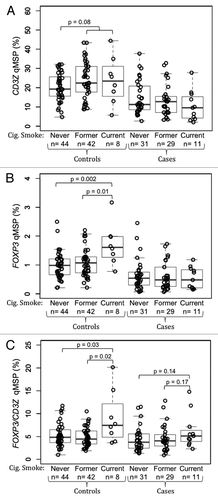
To explore the utility of the epigenetic assays in archived frozen blood specimens we performed a case control study of CD3Z and FOXP3 demethylation to measure T-cell and Treg levels, respectively, in stored peripheral blood specimens from the AGS case-control study. Results of qMSP assays are summarized in . The total inputs of DNA from whole blood from the 94 controls and 71 glioma cases were not significantly different from each other. In patients with grade IV glioblastoma multiforme (GBM), peripheral blood T-cell levels were significantly lower (p = 1.7 × 10⁻⁹; ), peripheral blood Treg levels were significantly lower (p = 5.2 × 10⁻¹¹; ) and peripheral blood Treg/T-cell ratios were moderately lower (p = 0.024; ) compared with healthy controls. In all cases and controls, levels of T-cells and Tregs were positively correlated (r = 0.61, p < 2.2 × 10⁻¹⁶; data not shown). Neither current use of dexamethasone nor chemotherapy was associated with T-cell measures. It should be noted that all GBM cases received steroid treatments at some time prior to blood sampling. In healthy controls, but not glioma patients, people who had ever smoked tended to have higher peripheral blood T-cell levels than those who had never smoked (p = 0.08, ) and current smokers had significantly higher levels of peripheral blood Tregs than former smokers (p = 0.01) and never smokers (p = 0.002; ). Furthermore, the ratio of Tregs/T-cells was significantly elevated in the peripheral blood of current smokers compared with former smokers (p = 0.01) and never smokers (p = 0.03) among healthy controls, and trended toward elevated levels in current smokers compared with former smokers (p = 0.17) and never smokers (p = 0.14; ).
Table 1. Summary of qMSP measurements for all samples (n = 285)
Figure 3. T-cells and Tregs in the peripheral blood of glioma patients and healthy donors. (A) Case control comparison of T-cells measured via CD3Z demethylation assay. (B) Case control comparison of Tregs measured via FOXP3 demethylation assay. (C) Case control comparison of Treg percent of T-cells determined by the ratio of FOXP3/CD3Z demethylation. In each panel, the displayed p value is from a Wilcoxon rank sum test between non-diseased control bloods and GBM patient bloods. Each data point represents the average of all replicate qMSP measurements for a single individual. Box plots superimposed on the data points cover the 2nd and 3rd quartile range with a line drawn at the median value, and whiskers that extend to the data point that is no more than 1.5 times the length of the box away from the box. The notches surrounding each median line extend to ± 1.58 IQR/sqrt(n), such that if the notches from two boxplots do not overlap there is strong evidence for a significant difference in the two medians.
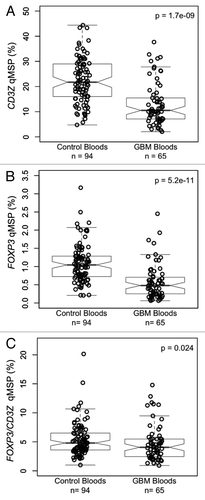
Figure 4. Association between cigarette smoking and peripheral blood T-cells and Tregs in glioma patients and healthy donors. (A) Comparison of peripheral blood T-cell levels, determined by CD3Z demethylation, among never, former and current cigarette smokers stratified by glioma case status. (B) Comparison of peripheral blood Treg levels, determined by FOXP3 demethylation, among never, former and current cigarette smokers stratified by glioma case status. (C) Comparison of peripheral blood Treg percent of T-cells, determined by ratio of FOXP3 to CD3Z demethylation, among never, former and current cigarette smokers stratified by glioma case status. In each panel the displayed p-values are from Wilcoxon rank sum tests between the two groups indicated. Each data point represents the average of all replicate qMSP measurements for a single individual. Box plots superimposed on the data points cover the 2nd and 3rd quartile range with a line drawn at the median value, and whiskers that extend to 1.5 times the length of the box.
We performed a logistic regression of T-cell values in GBM cases compared with controls showing that cases were 5.6 fold as likely to have T-cell counts in the lowest tertile of control values (Table S2A). Likewise, a logistic regression of Treg values in GBM cases compared with controls indicated that cases were 6.7 fold as likely to have Treg counts in the lowest tertile of control values (Table S2B). This further illustrates glioma-associated T-cell and Treg lymphopenia, as detected by epigenetic analysis.
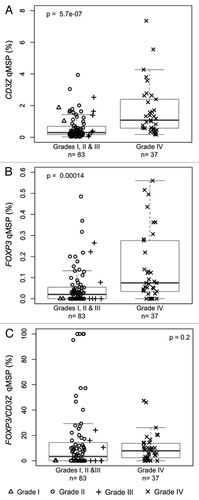
Tumor infiltrating T-cells and Tregs by qMSP in excised glioma tissue
The CD3Z and FOXP3 qMSP assays were used to measure the levels of tumor infiltrating T-cells and Tregs, respectively, in 120 fresh frozen glioma tumors from the UCSF Brain Tumor Research Center tissue bank. Results of qMSP assays are summarized in . There were significant associations between increased glioma tumor grade and higher levels of both T-cell (p = 5.7 × 10⁻⁷; ) and Treg (p = 0.00014; ) tumor infiltrates. In grade IV glioma tumor tissues the median level of Treg percentage of T-cells was higher than that of control bloods (), and higher than that of lower grade tumors (). However, these differences were not significant, due largely to a number of unusually high outliers for the Treg/T-cell ratio resulting from small numbers of T-cells in many of the tissues. The qMSP results also indicated significant differences between different glioma tumor histologies in the levels of T-cells (p = 8.6 × 10⁻⁷; Fig. S5A), Tregs (p = 0.00011; Fig. S5B) and Treg/T-cell ratios (p = 0.018; Fig. S5C). There were also associations between poorer patient survival and higher levels of tumor infiltrating T-cells (p = 0.014; Fig. S6A) and Tregs (p = 0.039; Fig. S6B) measured by qMSP.
Figure 5. Levels of T-cell and Treg infiltrates in excised glioma tissue. (A) T-cell levels, determined by CD3Z demethylation, in solid glioma samples stratified by tumor grade. (B) Treg levels, determined by FOXP3 demethylation, in solid glioma samples stratified by tumor grade. (C) Treg percent of T-cells, determined by ratio of FOXP3 to CD3Z demethylation, in solid glioma samples stratified by tumor grade. In each panel the displayed p-value is from a Wilcoxon rank sum test between lower grade tumors (Grades I, II and III) and Grade IV tumors. Each data point represents the average of all replicate qMSP measurements for a single individual. Box plots superimposed on the data points cover the 2nd and 3rd quartile range with a line drawn at the median value, and whiskers that extend to 1.5 times the length of the box.
Discussion
There is intense interest among glioma researchers in understanding the role of an altered immune response in both glioma etiology as well as in how this information can be applied to develop more effective therapies and prognostic indicators. Epidemiological studies implicate atopic immune alterations in glioma riskCitation28,Citation29 whereas immune suppression and abnormalities in T-cells in glioma patients may prevent antitumor immunity and pose barriers to effective immunotherapeutic strategies.Citation30,Citation31 Profound peripheral and tumor immune abnormalities have been recorded in previous studies of human glioma with the most dramatic alterations observed in patients with high grade GBM tumors. A highly immunosuppressive peripheral and tumor microenvironment in GBM is hypothesized to render the immune response ineffective. Peripheral lymphopenia affecting all T-cells including Tregs has been noted although an increased Treg compartment was observed in one study.Citation32 Here using our novel T-cell epigenetic assays we confirm significant decreases in CD3+ T-cells and Tregs in peripheral blood from GBM patients. The copy numbers of demethylated CD3Z and FOXP3, as a percent of total leukocyte copies, were reduced about 2-fold in GBM patients, which was highly statistically significant. We investigated current steroid use (dexamethasone), temozolomide and radiation exposures as possible factors in these effects among cases but found no significant associations of any factor with these T-cell alterations. It is possible that long-term suppression of T-cells explains these alterations because almost all patients receive steroid or other immunosuppressive exposures at some time during their treatment. Another possibility is that persons at risk for glioma have an increased susceptibility to intrinsic or acquired alterations in peripheral T-cells. Prospective studies would be required to test this hypothesis. However, given the rarity of glioma such studies are impractical. At the same time, the methods we have developed that delineate T-cell subsets from DNA will enable immune cell analyses using blood specimens that have been archived in cohort populations with long-term glioma follow-up data. Nested case control studies within large epidemiologic cohorts are now feasible, allowing us, for the first time, to test whether T-cell and Treg abnormalities precede the diagnosis of glioma.
Also of great interest is the balance of suppressive Tregs to total T-cells in peripheral blood, which has been reported to be shifted toward greater suppression in GBM patients and other types of cancer.Citation33 A high ratio of Tregs/T-cells is hypothesized to be an important feature of immunosuppression. Our data indicated wide interindividual variation in the ratio of Tregs/T-cells among both cases and controls. However, we did not observe a greater Treg/T-cell ratio among GBM cases vs. controls; in fact it was somewhat higher among control subjects. We also examined the ratio of Tregs/T-cells in association with cigarette smoking. Although the numbers of smokers were small in our cases and controls we observed an association of current smoking with higher Treg/T-cell ratios and we know of no other study to examine smoking as a factor influencing FOXP3 positive blood Tregs. There is strong evidence that cigarette smoke exposure leads to the accumulation of Tregs in respiratory airways in miceCitation34 and humansCitation35 as well as in the gut epithelium of exposed mice.Citation36 Elevated blood Treg numbers may reflect the mobilization and trafficking of Tregs into cigarette smoke exposed tissues. This is biologically plausible given the fact that cigarette smoking is associated with increases in the expression of the Treg chemoattractants CCL2 and CCL22.Citation37-Citation39 In our study Treg/T-cell ratios were higher in current smokers vs. former smokers, which are also consistent with the kinetics of CCL2 decay following smoking cessation.Citation38 We have subsequently confirmed in an independent population that current but not former cigarette smokers exhibit higher Treg/T-cell ratios (Wiencke et al., unpublished observation). Our results illustrate the urgent need for larger, more extensive examination of patient characteristics that affect Treg levels; clearly those studies should include cigarette smoking. Our development of new epigenetic methods will be useful in promoting these types of studies. The use of DNA extracted from archival blood samples, as opposed to fresh bloods samples, could potentially be a limitation of our work. However, we observed a very high correlation between conventional flow cytometric measurements of T-cells using fresh blood samples and CD3Z qMSP assessment of T-cell levels using DNA extracted from the same blood samples after storage, hereby validating the application of the epigenetic assay in archival samples. Furthermore, all of the qMSP results indicate the level of T-cells or Tregs relative to the total amount of leukocyte DNA, or as the ratio of Tregs relative to T-cells, and not as absolute counts of the cell types. Thus, for sample storage to lead to measurement bias there would have to be selective degradation of DNA from certain cell types and not the others, leading to altered relative levels of the different cell types. This is an unlikely scenario that is not supported by the current literature.
Suppressive Treg infiltration into glioma tissues has been invoked as one mechanism for circumventing immune anti-tumor reactions. Similar to many types of cancer CD4+ T helper cells and Tregs have been shown to infiltrate the human glioma tumor microenvironment.Citation40 In glioma studies using IHC to quantify T-cells in FFPE preparations CD4+ T-cell numbers were reported to increase with tumor grade, whereas CD8+ T-cells appear in equal frequencies across glioma grades.Citation12 Our studies indicate increased CD3Z demethylated cells according to grade; our corollary IHC analysis indicated that mostly these cells were CD8+ T-cells with very few CD4+ T-cells. We also report that ependymal tumor cells and some significant fraction of grade II OD and AS tumors contain significant numbers of T-cells and Tregs. As progression of lower grade to higher grade brain tumors is a common and serious clinical problem our results suggest that epigenetic analyses might be useful for characterizing low grade OD and AS tumors as well as EP. Previous studies using IHC detection of glioma infiltrating lymphocytes showed that the numbers of infiltrating T-cells and the ratio of Treg/T-cells is positively correlated with histopathological grade of the tumor,Citation10-Citation12,Citation41 suggesting that both Tregs and overall T-cells accumulated proportionately with grade. Furthermore, previous studies using FACS have indicated that the ratio of Tregs/T-cells in glioma tumor tissue is increased in comparison to blood.Citation42 Our analysis using qMSP corroborates all of these findings, supporting the hypothesis that there is a specific accumulation of Tregs in human brain tumors. The survival data indicated significant associations of immune parameters with patient survival. Increased accumulation of Tregs was associated with poorer survival. Additional studies are necessary to determine what, if any, prognostic value there is for epigenetic detection of immune cells in brain tumors. Our studies show the feasibility of combining peripheral blood and tumor immune studies using epigenetic analysis of immune cell-specific genes.
With respect to blood, there is one Treg study that specifically compared Tregs in 8 GBM cases to 6 control subjectsCitation9 and another study that compared Tregs in 10 GBM cases to intraoperative acquired blood from 6 seizure patients undergoing surgery.Citation10 In contrast, we studied 65 GBM bloods and 94 frequency matched controls. While very important papers, the previous two reports are not extensive surveys and importantly each identified substantial interindividual variation in T-cell values. In fact, Fecci et al. (2006) showed that 3 out of 8 of their GBM cases showed normal Treg/T-cell ratios, thus there was overlap of normal within the case group, and they concluded that further work on the CD4+ lymphopenia is a logical direction for future research.Citation9 Our work adds to the current hypotheses on glioma immunosuppression and takes a more population level (or epidemiological) approach to the issue. With respect to tumor T-cell infiltrates in glioma tissue, our results are consistent with the published literature in several significant ways. Similar to previous reports, we found that T-cell and Treg infiltrates in tumor tissue increase with glioma grade,Citation10,Citation43 that the fraction of Tregs/T-cells was increased in glioma tissues compared with blood implicating an active infiltration and accumulation in tumor tissue, and we found that CD8 cells represent about 60% of the T-cells in GBM tissues compared with 77%Citation44 or 40%Citation43 in previous studies. Hussain et al. (2006) reported that CD8 cells were about 30% of identified T-cells but their study acknowledge significant problems with autofluorescence in their flow analysis making the identification of CD4 cells problematic. Our data also indicate that Tregs are a small fraction of T-cells in glioma tissue, in agreement with 2 other studies using flowCitation10 or quantitative IHCCitation43,Citation44 to assess immune cell levels. All studies published to date cite wide individual variation in T-cell levels. Thus, our tumor studies are fully consistent with the main conclusions in the literature and within the range of results that might be expected.
Potential limitations of the epigenetic assay of T-cells by CD3Z demethylation include the possibility that disease processes may influence the expression of CD3Z in T-cells. Indeed the TCR complex in patients with several types of cancer has been shown to be altered in T-cells appearing in peripheral blood as well as among T-cells infiltrating the tumor microenvironment; low or even absent expression of CD3Z in T-cells has been reported in a variety of solid tumors.Citation9,Citation45 However, recent experiments have shown that the downregulation of CD3Z in pathologic conditions is a posttranslational effect on CD3Z proteins that is mediated by the upregulation of lysosomal or proteasomal degradation pathways. Normal levels of CD3Z mRNA are observed in the TILs with reduced CD3Z protein levels.Citation46,Citation47 Recent studies in T-cells from SLE patients reported an mTOR dependent lysosomal degradation mechanism leading to reduced CD3Z levels.Citation48 Also our observation of a close linear relationship between flow cytometry of CD3+ T-cells and CD3Z demethylation that was identical among glioma cases and controls argues against a possible cancer related effect on CD3Z demethylation. A second potential issue concerning the validity of CD3Z demethylation as a CD3+ T-cell marker in cancer tissues is that DNA demethylation may take place in transformed cells and thus ‘mimic’ a lymphocyte signal. To address this we assessed CD3Z and FOXP3 demethylation in brain tumor cells lines and in human GBM xenografts, which cannot contain human T-cells. All these samples contained non-detectable levels of CD3Z or FOXP3 demethylation. Normal brain tissue was also uniformly devoid of T-cell signals, which is consistent with the specificity of qMSP in tumor as reflecting infiltration of immune cells. Our analysis of the TCGA database revealed that CD3Z expression has no correlation with gene expression subtypes within GBM, making it unlikely that CD3Z is a biased marker for T-cell infiltration in GBM. Finally, we recognize that some subtypes of NK cells (CD56dimCD16bright) utilize CD3Z in NK receptor signaling.Citation49 We estimate that the contribution of CD3Z expressing and demethylated NK cells to the overall CD3Z demethylated signal in peripheral white blood cells is very small. Furthermore, NK cells have not been observed in glioma tissues. While it is important to recognize the limitations in using CD3Z demethylation as a specific marker of T-cells, this limitation is also shared by approaches that would target CD3E demethylation or the current methods using conventional cell surface or cytoplasmic expression of TCR proteins.
In conclusion, the fundamental innovation in our epigenetic analyses is to suggest a shift in immunodiagnostics away from proteomic-based approaches to one that is based on quantifying cell type specific DNA methylation events. This new approach produces gains in versatility, sensitivity, feasibility and throughput compared with conventional flow cytometry or IHC and at a lower cost. At the heart of this approach is the high chemical stability of cytosine methylation marks within genomic DNA and the fact that differentiation within the immune system is tightly linked with gene specific DNA methylation events. The method combines the intrinsic and profound chemical stability of DNA with the tremendous sensitivity of qPCR methods. Automation and liquid robotic handling in processing and analysis add further to the power of the methodology and should open avenues for investigations in the immunoepidemiology of glioma and many other diseases.
Materials and Methods
Patient characteristics and biological samples
Whole blood samples from glioma patients (n = 94) and controls (n = 71) were obtained from the UCSF San Francisco Adult Glioma Study (AGS) for these experiments (). The UCSF Committee for Human Research approved methods for subject recruitment and follow-up for survival; all subjects provided signed informed consent. Individual hospital institutional review boards also approved methods for medical record abstraction when appropriate. The patients included in this present study were newly diagnosed between 1997 and 2011. Details of subject ascertainment through the San Francisco regional population-based registry’s rapid case ascertainment program or the UCSF Neuro-oncology Clinic have been previously described.Citation50-Citation53 Pertinent data for this analysis included age at histological diagnosis, gender, vital status, and survival time between diagnosis date and date of death for those deceased or between diagnosis date and date of last contact for those alive as well as cigarette smoking history and exposure to steroids, chemotherapy and/or radiation therapy.
Table 2. Demographic characteristics of donors for all samples (n = 285) used in qMSP experiments
A panel of 120 fresh frozen glioma tumors from the UCSF Brain Tumor Research Center tissue bank, obtained under appropriate institutional review board approval, which were previously characterized for molecular featuresCitation50,Citation54 was chosen for tumor qMSP and IHC studies (). Tumor samples were defined as secondary GBM if the patients had prior histological diagnosis of a low-grade glioma. All ages are given at the time of surgery, which occurred at UCSF between 1990 and 2003. This tumor set contained the following histological subtypes: 2 pilocytic astrocytomas (PA), 15 ependymomas WHO grade II (EPII), 20 oligodendrogliomas WHO grade II (ODII), 16 oligoastrogliomas WHO grade II (OAII), 3 oligoastrogliomas WHO grade III (OAIII), 23 astrocytomas WHO grade II (ASII), 4 astrocytomas WHO grade III (ASIII) and 37 astrocytomas WHO grade IV, commonly called glioblastoma multiforme (GBM), 10 of which were recurrent and 5 of which were secondary.
Sorted, normal, human, peripheral blood leukocyte subtypes were isolated from different non-diseased individuals’ whole blood by magnetic activated cell sorting (MACS) using a combination of negative and positive selection with highly specific cell surface antibodies conjugated to magnetic beads. The purity of separated cells was confirmed with flow cytometry to be > 97%.
DNA extraction and sodium bisulfite conversion
Genomic DNA was extracted and purified from whole blood, fresh frozen tumor tissues, or MACS sorted leukocytes with AllPrep DNA/RNA/Protein Mini Kit according to manufacturer’s protocol (QIAGEN, Cat. No. 8004), then quantified by NanoDrop ND-1000 Spectrophotometer (NanoDrop Technologies, Inc.) and stored at -20°C. Prior to methylation analysis, DNA was treated with sodium bisulfite using ZYMO EZ-96 DNA Methylation Kit (ZYMO Research Corp., Cat. No. D5004), and stored at -80°C until needed.
DNA methylation microarray
The Infinium® HumanMethylation27 Beadchip Microarray (Illumina Inc.) quantifies the methylation status of 27,578 CpG loci from 14,495 genes, with a redundancy of 15–18-fold. The ratio of fluorescent signals was computed from both alleles using the following equation: β = [max(M,0)]/(|U| + |M|) + 100. The resultant β-value is a continuous variable ranging from 0 (unmethylated) to 1 (completely methylated) that represents the methylation at each CpG site and is used in subsequent statistical analyses. Data were assembled with the methylation module of GenomeStudio software (Illumina, Inc.).Citation55
Bisulfite pyrosequencing
Pyrosequencing assays to confirm microarray results were designed using Pyromark Assay Design 2.0 (Qiagen Inc.), and performed on a Pyromark MD pyrosequencer running Pyromark qCpG 1.1.11 software (Qiagen Inc.). Oligonucleotide primers were obtained from Life Technologies™.
MethyLight and qMSP
Primers and TaqMan major grove binding (MGB) probes with 5′ 6-FAM and 3′ non-fluorescent quencher (NFQ) as well as TaqMan® 1000 RXN Gold with Buffer A Pack were obtained from Life Technologies™. Oligonucleotide sequences are shown in Table S3. Solutions and conditions for real-time PCR reactions were as described previouslyCitation25 with some modifications. 10× TaqMan® Stabilizer containing 0.1% Tween-20, 0.5% gelatin was prepared weekly. Each reaction of 20 µl contained 5 µl DNA, 11.9 µl preMix, 3 µl oligoMix, and 0.1 µl Taq DNA polymerase. Cycling was performed using a 7900HT Fast Real-Time PCR System (Applied Biosystems); 50 cycles at 95°C for 15 sec and 60°C for 1 min after 10 min at 95°C preheat. All samples were run in triplicate using the absolute quantification method. The gDNA used to create a four-point standard curve for quantification of bisulfite converted DNA by C-LESS qPCR was extracted from whole blood and quantified by NanoDrop. A conversion factor of 3.3 pg DNA per genomic copy was implemented because one diploid human cell contains 6.6 pg of DNA. To confirm array results, MethyLight assays were performed using EpiTect PCR control DNA (Qiagen Inc., cat no. 59695) as methylated and/or unmethylated reference(s). CpGenome Universal Methylated DNA (Millipore Corp., Cat. No. S7821), MACS purified T-cell and MACS purified Treg DNA were bisulfite converted at the same time, and then quantified by C-LESS qPCR at the same time, prior to being used to generate four-point T-cell and Treg calibration curves for the CD3Z and FOXP3 qMSP assays respectively.
Flow cytometry of blood lymphocytes in whole blood
Venous whole blood samples were collected in citrate EDTA and processed using a lysis no wash protocol (Invitrogen, Cat. No. GAS-010). Cells were labeled by direct staining with the appropriate fluorochrome-conjugated antibodies (eBioscience Inc.), and incubated for 20 min in the dark at 4°C; CD3-fluorescein isothiocyanate (FITC, Cat. No. 11-0038–41), anti-CD4-allophycocyanin (APC, Cat. No. 17-0048-41), anti-CD8-phycoerythrin (PE, Cat. No. 12-0086-41), and anti-CD45-PerCP-Cy5.5 (Cat. No. 45-0459-41). Isotype control mAbs were used as negative controls. Accucheck counting beads (Invitrogen, Cat. No. PCB100) were used for quantifying leukocyte numbers. Acquisition was performed within 48 h of blood draw on a FACScalibur flow cytometer using Cell-Quest Software (Becton Dickinson). For CD3+ cells a minimum of 10,000 events were collected on the lymphocyte gate that was set on the forward scatter vs. side scatter (FSC vs. SSC) and then gated on CD3+ cells. For CD45+ counts we first gated on all non-bead events using the FSC vs. SSC. We then created a CD45+ histogram plot of the non-bead events, and gated on CD45+ cells. Examples can be seen in Figure S7. Absolute counts (number cells per μl) were obtained by taking the number of cells counted, divided by total number of beads counted, and multiplied by the known concentration of beads. Flowjo software (TreeStar Inc.) was used for data analysis.
Tumor immunohistochemistry (IHC) and tumor infiltrating lymphocytes (TIL)
Slides were prepared from a 5 micron slice of each FFPE tumor block. Slides were stained using a Benchmark XT instrument per manufacturer’s instructions (Ventana). CD3 antibody (Dako, Cat. No. A0452) was added in a 1:600 dilution, and incubated for 30 min. CD8 antibody (Dako, Cat. No. M7103) was added in a 1:200 dilution and incubated for 60 min. CD4 antibody (Leica Microsystems, Cat. No. NCL-L-CD4–368) was added in a 1:50 dilution, and incubated for 2 h. Slides were counterstained with hematoxylin. Each slide was scanned to identify four areas with the greatest number of positive cells (100× magnification). Within each of these four areas the number of immunopositive cells was enumerated in a single field at a magnification of 250x. This selection was done blinded to the CD3Z and FOXP3 methylation status of a tumor specimen. Representative examples can be seen in Figure S2. The mean number of positive cells per field per tumor was calculated (n = 4 per tumor). A photomicrograph was taken and scored for specimens with very high cell counts to increase accuracy. We also recorded whether the sample contained predominate perivascular and/or parenchymal infiltrates. The scores of the two readers (J.P. and G.H.) were compared with ensure uniform interpretation.
Statistical Methods
A linear mixed effects (LME) model was applied to the Illumina Infinium® HumanMethylation27 data using SAS (SAS Institute Inc.). Cell type was designated as the fixed effect while beadchip plate was the random effect. For this study, the fixed effect groups were T-cells and non-T cells, which included NK cells, B-lymphocytes, granulocytes and monocytes. This generated coefficients that estimated differential methylation such that, for any particular locus, a negative coefficient indicated less methylation in T-cells than in the other cell types. Subsequent statistical analyses were performed in R (www.r-project.org). The LME model generated p values that we adjusted for multiple comparisons using the “qvalue” package. Generalized linear models and F-tests were performed to determine log linear PCR kinetics for T-cell and Treg calibration curves, as well as for C-LESS standard curves. To test for univariate associations between continuous qMSP measurements and discrete variables, Wilcoxon rank sum tests (for dichotomous variables, such as case status) and Kruskal-Wallis one-way analysis of variance tests were used employed. To test for univariate associations between continuous qMSP measurements and other continuous variables, we performed linear regression, calculated Pearson product-moment correlations and performed F-tests. Multivariate logistic regression analyses were performed using the “glm” function with family set to binary. Kalpain-Meier plots and log-rank p-values for survival analyses were generated using the “survival” package.
| Abbreviations: | ||
| DMR | = | differentially methylated region |
| TIL | = | tumor infiltrating lymphocyte, TCR, T-cell receptor complex |
| CpG | = | cytosine-guanine dinucleotide |
| EP | = | ependymoma |
| OD | = | oligodendroglioma |
| OA | = | Oligoastrocytoma |
| PA | = | pilocytic astrocytoma |
| AS | = | astrocytoma |
| GBM | = | astrocytoma WHO grade IV, glioblastoma multiforme |
| IHC | = | immunohistochemistry |
| Foxp3 | = | forkhead box P3 transcription factor |
| Treg | = | CD4+CD25+Foxp3+ Regulatory T-cell |
| qMSP | = | quantitative methylation specific polymerase chain reaction |
Additional material
Download Zip (582.7 KB)Acknowledgments
The authors wish to acknowledge the contributions of Yuanyuan Xiao for comparing CD3Z expression levels among expression classes of GBMs within the TCGA database and Cynthia Caudrey, Tarik Tihan for providing tumor specimens and pathology review, Terri Rice, Lucie McCoy for data collection and analysis, and Katie Wegenman for sample processing.
Disclosure of Potential Conflicts of Interest
The authors have no potential conflicts of interest to report.
Financial Disclosures
This work was supported by grants from the National Institutes of Health, R01CA52689, CA126939, CA100679, University of California San Francisco Brain Tumor Specialized Program Of Research Excellence P50CA097257, K08 NS063456, and the National Institute of Environmental Health Sciences ES06717.
Supplemental Materials
Supplemental materials may be found here: www.landesbioscience.com/journals/epigenetics/article/22675
References
- Ohgaki H, Kleihues P. Epidemiology and etiology of gliomas. Acta Neuropathol 2005; 109:93 - 108; http://dx.doi.org/10.1007/s00401-005-0991-y; PMID: 15685439
- Louis DN, Ohgaki H, Wiestler OD, Cavenee WK, Burger PC, Jouvet A, et al. The 2007 WHO classification of tumours of the central nervous system. Acta Neuropathol 2007; 114:97 - 109; http://dx.doi.org/10.1007/s00401-007-0243-4; PMID: 17618441
- Ohgaki H, Kleihues P. Genetic pathways to primary and secondary glioblastoma. Am J Pathol 2007; 170:1445 - 53; http://dx.doi.org/10.2353/ajpath.2007.070011; PMID: 17456751
- Kleihues P, Burger PC, Scheithauer BW. The new WHO classification of brain tumours. Brain Pathol 1993; 3:255 - 68; http://dx.doi.org/10.1111/j.1750-3639.1993.tb00752.x; PMID: 8293185
- Wiemels JL, Wilson D, Patil C, Patoka J, McCoy L, Rice T, et al. IgE, allergy, and risk of glioma: update from the San Francisco Bay Area Adult Glioma Study in the temozolomide era. Int J Cancer 2009; 125:680 - 7; http://dx.doi.org/10.1002/ijc.24369; PMID: 19408307
- Yang I, Tihan T, Han SJ, Wrensch MR, Wiencke J, Sughrue ME, et al. CD8+ T-cell infiltrate in newly diagnosed glioblastoma is associated with long-term survival. J Clin Neurosci 2010; 17:1381 - 5; http://dx.doi.org/10.1016/j.jocn.2010.03.031; PMID: 20727764
- McVicar DW, Davis DF, Merchant RE. In vitro analysis of the proliferative potential of T cells from patients with brain tumor: glioma-associated immunosuppression unrelated to intrinsic cellular defect. J Neurosurg 1992; 76:251 - 60; http://dx.doi.org/10.3171/jns.1992.76.2.0251; PMID: 1730954
- Ashkenazi E, Deutsch M, Tirosh R, Weinreb A, Tsukerman A, Brodie C. A selective impairment of the IL-2 system in lymphocytes of patients with glioblastomas: increased level of soluble IL-2R and reduced protein tyrosine phosphorylation. Neuroimmunomodulation 1997; 4:49 - 56; PMID: 9326745
- Fecci PE, Mitchell DA, Whitesides JF, Xie W, Friedman AH, Archer GE, et al. Increased regulatory T-cell fraction amidst a diminished CD4 compartment explains cellular immune defects in patients with malignant glioma. Cancer Res 2006; 66:3294 - 302; http://dx.doi.org/10.1158/0008-5472.CAN-05-3773; PMID: 16540683
- El Andaloussi A, Lesniak MS. An increase in CD4+CD25+FOXP3+ regulatory T cells in tumor-infiltrating lymphocytes of human glioblastoma multiforme. Neuro Oncol 2006; 8:234 - 43; http://dx.doi.org/10.1215/15228517-2006-006; PMID: 16723631
- El Andaloussi A, Lesniak MS. CD4+ CD25+ FoxP3+ T-cell infiltration and heme oxygenase-1 expression correlate with tumor grade in human gliomas. J Neurooncol 2007; 83:145 - 52; http://dx.doi.org/10.1007/s11060-006-9314-y; PMID: 17216339
- Jordan JT, Sun W, Hussain SF, DeAngulo G, Prabhu SS, Heimberger AB. Preferential migration of regulatory T cells mediated by glioma-secreted chemokines can be blocked with chemotherapy. Cancer Immunol Immunother 2008; 57:123 - 31; http://dx.doi.org/10.1007/s00262-007-0336-x; PMID: 17522861
- Jacobs JF, Idema AJ, Bol KF, Grotenhuis JA, de Vries IJ, Wesseling P, et al. Prognostic significance and mechanism of Treg infiltration in human brain tumors. J Neuroimmunol 2010; 225:195 - 9; http://dx.doi.org/10.1016/j.jneuroim.2010.05.020; PMID: 20537408
- Zheng Y, Rudensky AY. Foxp3 in control of the regulatory T cell lineage. Nat Immunol 2007; 8:457 - 62; http://dx.doi.org/10.1038/ni1455; PMID: 17440451
- Wang J, Ioan-Facsinay A, van der Voort EI, Huizinga TW, Toes RE. Transient expression of FOXP3 in human activated nonregulatory CD4+ T cells. Eur J Immunol 2007; 37:129 - 38; http://dx.doi.org/10.1002/eji.200636435; PMID: 17154262
- François V, Ottaviani S, Renkvist N, Stockis J, Schuler G, Thielemans K, et al. The CD4(+) T-cell response of melanoma patients to a MAGE-A3 peptide vaccine involves potential regulatory T cells. Cancer Res 2009; 69:4335 - 45; http://dx.doi.org/10.1158/0008-5472.CAN-08-3726; PMID: 19435913
- Gavin MA, Torgerson TR, Houston E, DeRoos P, Ho WY, Stray-Pedersen A, et al. Single-cell analysis of normal and FOXP3-mutant human T cells: FOXP3 expression without regulatory T cell development. Proc Natl Acad Sci U S A 2006; 103:6659 - 64; http://dx.doi.org/10.1073/pnas.0509484103; PMID: 16617117
- Stockis J, Fink W, François V, Connerotte T, de Smet C, Knoops L, et al. Comparison of stable human Treg and Th clones by transcriptional profiling. Eur J Immunol 2009; 39:869 - 82; http://dx.doi.org/10.1002/eji.200838807; PMID: 19224638
- Floess S, Freyer J, Siewert C, Baron U, Olek S, Polansky J, et al. Epigenetic control of the foxp3 locus in regulatory T cells. PLoS Biol 2007; 5:e38; http://dx.doi.org/10.1371/journal.pbio.0050038; PMID: 17298177
- Baron U, Floess S, Wieczorek G, Baumann K, Grützkau A, Dong J, et al. DNA demethylation in the human FOXP3 locus discriminates regulatory T cells from activated FOXP3(+) conventional T cells. Eur J Immunol 2007; 37:2378 - 89; http://dx.doi.org/10.1002/eji.200737594; PMID: 17694575
- Polansky JK, Kretschmer K, Freyer J, Floess S, Garbe A, Baron U, et al. DNA methylation controls Foxp3 gene expression. Eur J Immunol 2008; 38:1654 - 63; http://dx.doi.org/10.1002/eji.200838105; PMID: 18493985
- Wilson CB, Makar KW, Shnyreva M, Fitzpatrick DR. DNA methylation and the expanding epigenetics of T cell lineage commitment. Semin Immunol 2005; 17:105 - 19; http://dx.doi.org/10.1016/j.smim.2005.01.005; PMID: 15737572
- Palmer C, Diehn M, Alizadeh AA, Brown PO. Cell-type specific gene expression profiles of leukocytes in human peripheral blood. BMC Genomics 2006; 7:115; http://dx.doi.org/10.1186/1471-2164-7-115; PMID: 16704732
- Weisenberger DJ, Trinh BN, Campan M, Sharma S, Long TI, Ananthnarayan S, et al. DNA methylation analysis by digital bisulfite genomic sequencing and digital MethyLight. Nucleic Acids Res 2008; 36:4689 - 98; http://dx.doi.org/10.1093/nar/gkn455; PMID: 18628296
- Campan M, Weisenberger DJ, Trinh B, Laird PW. MethyLight. Methods Mol Biol 2009; 507:325 - 37; http://dx.doi.org/10.1007/978-1-59745-522-0_23; PMID: 18987824
- Wieczorek G, Asemissen A, Model F, Turbachova I, Floess S, Liebenberg V, et al. Quantitative DNA methylation analysis of FOXP3 as a new method for counting regulatory T cells in peripheral blood and solid tissue. Cancer Res 2009; 69:599 - 608; http://dx.doi.org/10.1158/0008-5472.CAN-08-2361; PMID: 19147574
- Angibaud J, Louveau A, Baudouin SJ, Nerrière-Daguin V, Evain S, Bonnamain V, et al. The immune molecule CD3zeta and its downstream effectors ZAP-70/Syk mediate ephrin signaling in neurons to regulate early neuritogenesis. J Neurochem 2011; 119:708 - 22; http://dx.doi.org/10.1111/j.1471-4159.2011.07469.x; PMID: 21895656
- Wrensch M, Weinberg A, Wiencke J, Miike R, Sison J, Wiemels J, et al. History of chickenpox and shingles and prevalence of antibodies to varicella-zoster virus and three other herpesviruses among adults with glioma and controls. Am J Epidemiol 2005; 161:929 - 38; http://dx.doi.org/10.1093/aje/kwi119; PMID: 15870157
- Schwartzbaum JA, Xiao Y, Liu Y, Tsavachidis S, Berger MS, Bondy ML, et al. Inherited variation in immune genes and pathways and glioblastoma risk. Carcinogenesis 2010; 31:1770 - 7; http://dx.doi.org/10.1093/carcin/bgq152; PMID: 20668009
- Sonabend AM, Rolle CE, Lesniak MS. The role of regulatory T cells in malignant glioma. Anticancer Res 2008; 28:2B 1143 - 50; PMID: 18505050
- Grauer OM, Nierkens S, Bennink E, Toonen LW, Boon L, Wesseling P, et al. CD4+FoxP3+ regulatory T cells gradually accumulate in gliomas during tumor growth and efficiently suppress antiglioma immune responses in vivo. Int J Cancer 2007; 121:95 - 105; http://dx.doi.org/10.1002/ijc.22607; PMID: 17315190
- Fecci PE, Ochiai H, Mitchell DA, Grossi PM, Sweeney AE, Archer GE, et al. Systemic CTLA-4 blockade ameliorates glioma-induced changes to the CD4+ T cell compartment without affecting regulatory T-cell function. Clin Cancer Res 2007; 13:2158 - 67; http://dx.doi.org/10.1158/1078-0432.CCR-06-2070; PMID: 17404100
- Beyer M, Schultze JL. Regulatory T cells in cancer. Blood 2006; 108:804 - 11; http://dx.doi.org/10.1182/blood-2006-02-002774; PMID: 16861339
- Brandsma CA, Hylkema MN, van der Strate BW, Slebos DJ, Luinge MA, Geerlings M, et al. Heme oxygenase-1 prevents smoke induced B-cell infiltrates: a role for regulatory T cells?. Respir Res 2008; 9:17; http://dx.doi.org/10.1186/1465-9921-9-17; PMID: 18252008
- Smyth LJ, Starkey C, Vestbo J, Singh D. CD4-regulatory cells in COPD patients. Chest 2007; 132:156 - 63; http://dx.doi.org/10.1378/chest.07-0083; PMID: 17505034
- Verschuere S, Bracke KR, Demoor T, Plantinga M, Verbrugghe P, Ferdinande L, et al. Cigarette smoking alters epithelial apoptosis and immune composition in murine GALT. Lab Invest 2011; 91:1056 - 67; http://dx.doi.org/10.1038/labinvest.2011.74; PMID: 21537330
- Ritter M, Göggel R, Chaudhary N, Wiedenmann A, Jung B, Weith A, et al. Elevated expression of TARC (CCL17) and MDC (CCL22) in models of cigarette smoke-induced pulmonary inflammation. Biochem Biophys Res Commun 2005; 334:254 - 62; http://dx.doi.org/10.1016/j.bbrc.2005.06.084; PMID: 15993846
- Braber S, Henricks PA, Nijkamp FP, Kraneveld AD, Folkerts G. Inflammatory changes in the airways of mice caused by cigarette smoke exposure are only partially reversed after smoking cessation. Respir Res 2010; 11:99; http://dx.doi.org/10.1186/1465-9921-11-99; PMID: 20649997
- Monzon ME, Forteza RM, Casalino-Matsuda SM. MCP-1/CCR2B-dependent loop upregulates MUC5AC and MUC5B in human airway epithelium. Am J Physiol Lung Cell Mol Physiol 2011; 300:L204 - 15; http://dx.doi.org/10.1152/ajplung.00292.2010; PMID: 21097527
- Nishikawa H, Sakaguchi S. Regulatory T cells in tumor immunity. Int J Cancer 2010; 127:759 - 67; PMID: 20518016
- Heimberger AB, Sun W, Hussain SF, Dey M, Crutcher L, Aldape K, et al. Immunological responses in a patient with glioblastoma multiforme treated with sequential courses of temozolomide and immunotherapy: case study. Neuro Oncol 2008; 10:98 - 103; http://dx.doi.org/10.1215/15228517-2007-046; PMID: 18079360
- Hussain SF, Yang D, Suki D, Aldape K, Grimm E, Heimberger AB. The role of human glioma-infiltrating microglia/macrophages in mediating antitumor immune responses. Neuro Oncol 2006; 8:261 - 79; http://dx.doi.org/10.1215/15228517-2006-008; PMID: 16775224
- Lohr J, Ratliff T, Huppertz A, Ge Y, Dictus C, Ahmadi R, et al. Effector T-cell infiltration positively impacts survival of glioblastoma patients and is impaired by tumor-derived TGF-β. Clin Cancer Res 2011; 17:4296 - 308; http://dx.doi.org/10.1158/1078-0432.CCR-10-2557; PMID: 21478334
- Kim YH, Jung TY, Jung S, Jang WY, Moon KS, Kim IY, et al. Tumour-infiltrating T-cell subpopulations in glioblastomas. Br J Neurosurg 2012; 26:21 - 7; http://dx.doi.org/10.3109/02688697.2011.584986; PMID: 21707245
- Whiteside TL. Down-regulation of zeta-chain expression in T cells: a biomarker of prognosis in cancer?. Cancer Immunol Immunother 2004; 53:865 - 78; http://dx.doi.org/10.1007/s00262-004-0521-0; PMID: 15118842
- Reichert TE, Rabinowich H, Johnson JT, Whiteside TL. Mechanisms responsible for signaling and functional defects. J Immunother 1998; 21:295 - 306; http://dx.doi.org/10.1097/00002371-199807000-00007; PMID: 9672851
- Taylor DD, Bender DP, Gerçel-Taylor C, Stanson J, Whiteside TL. Modulation of TcR/CD3-zeta chain expression by a circulating factor derived from ovarian cancer patients. Br J Cancer 2001; 84:1624 - 9; http://dx.doi.org/10.1054/bjoc.2001.1847; PMID: 11401315
- Fernandez DR, Telarico T, Bonilla E, Li Q, Banerjee S, Middleton FA, et al. Activation of mammalian target of rapamycin controls the loss of TCRzeta in lupus T cells through HRES-1/Rab4-regulated lysosomal degradation. J Immunol 2009; 182:2063 - 73; http://dx.doi.org/10.4049/jimmunol.0803600; PMID: 19201859
- Lanier LL. Viral immunoreceptor tyrosine-based activation motif (ITAM)-mediated signaling in cell transformation and cancer. Trends Cell Biol 2006; 16:388 - 90; http://dx.doi.org/10.1016/j.tcb.2006.06.004; PMID: 16815013
- Christensen BC, Smith AA, Zheng S, Koestler DC, Houseman EA, Marsit CJ, et al. DNA methylation, isocitrate dehydrogenase mutation, and survival in glioma. J Natl Cancer Inst 2011; 103:143 - 53; http://dx.doi.org/10.1093/jnci/djq497; PMID: 21163902
- Felini MJ, Olshan AF, Schroeder JC, Carozza SE, Miike R, Rice T, et al. Reproductive factors and hormone use and risk of adult gliomas. Cancer Causes Control 2009; 20:87 - 96; http://dx.doi.org/10.1007/s10552-008-9220-z; PMID: 18766447
- Wrensch M, Jenkins RB, Chang JS, Yeh RF, Xiao Y, Decker PA, et al. Variants in the CDKN2B and RTEL1 regions are associated with high-grade glioma susceptibility. Nat Genet 2009; 41:905 - 8; http://dx.doi.org/10.1038/ng.408; PMID: 19578366
- Wrensch M, McMillan A, Wiencke J, Wiemels J, Kelsey K, Patoka J, et al. Nonsynonymous coding single-nucleotide polymorphisms spanning the genome in relation to glioblastoma survival and age at diagnosis. Clin Cancer Res 2007; 13:197 - 205; http://dx.doi.org/10.1158/1078-0432.CCR-06-1199; PMID: 17200355
- Zheng S, Houseman EA, Morrison Z, Wrensch MR, Patoka JS, Ramos C, et al. DNA hypermethylation profiles associated with glioma subtypes and EZH2 and IGFBP2 mRNA expression. Neuro Oncol 2011; 13:280 - 9; http://dx.doi.org/10.1093/neuonc/noq190; PMID: 21339190
- Bibikova M, Le J, Barnes B, Saedinia-Melnyk S, Zhou L, Shen R, et al. Genome-wide DNA methylation profiling using Infinium® assay. Epigenomics 2009; 1:177 - 200; http://dx.doi.org/10.2217/epi.09.14; PMID: 22122642