Abstract
Chronic lymphocytic leukemia (CLL) can be divided into prognostic subgroups based on the IGHV gene mutational status, and is further characterized by multiple subsets of cases with quasi-identical or stereotyped B cell receptors that also share clinical and biological features. We recently reported differential DNA methylation profiles in IGHV-mutated and IGHV-unmutated CLL subgroups. For the first time, we here explore the global methylation profiles of stereotyped subsets with different prognosis, by applying high-resolution methylation arrays on CLL samples from three major stereotyped subsets: the poor-prognostic subsets #1 (n = 15) and #2 (n = 9) and the favorable-prognostic subset #4 (n = 15). Overall, the three subsets exhibited significantly different methylation profiles, which only partially overlapped with those observed in our previous study according to IGHV gene mutational status. Specifically, gene ontology analysis of the differentially methylated genes revealed a clear enrichment of genes involved in immune response, such as B cell activation (e.g., CD80, CD86 and IL10), with higher methylation levels in subset #1 than subsets #2 and #4. Accordingly, higher expression of the co-stimulatory molecules CD80 and CD86 was demonstrated in subset #4 vs. subset #1, pointing to a key role for these molecules in the crosstalk of CLL subset #4 cells with the microenvironment. In summary, investigation of three prototypic, stereotyped CLL subsets revealed distinct DNA methylation profiles for each subset, which suggests subset-biased patterns of transcriptional control and highlights a key role for epigenetics during leukemogenesis.
Introduction
Determination of the immunoglobulin heavy variable (IGHV) gene mutational status has proved to be one of the most important prognostic markers in chronic lymphocytic leukemia (CLL), where patients with unmutated IGHV genes demonstrate an inferior outcome compared with those displaying mutated IGHV genes.Citation1,Citation2 Furthermore, approximately one-third of CLL cases can be assigned to distinct subsets that express specific IG heavy/light chain genes and carry closely homologous, stereotyped B cell receptors (BcRs).Citation3-Citation9 These findings have strongly implied a role for antigen selection in CLL development.
Recent studies have also revealed an important association between stereotyped BcRs and clinical outcome for certain subsets.Citation6,Citation10,Citation11 For instance, subset #1 cases typically express heavy chains encoded by one of the IGHV1/5/7 clan genes with a highly homologous heavy complementarity determining region 3 (VH CDR3), in combination with kappa light chains encoded by IGKV1-39/1D-39. These patients carry unmutated IGHV genes and have poorer prognosis compared with non-stereotyped, unmutated cases using the same IGHV genes.Citation6,Citation11 Furthermore, approximately half of all IGHV3-21 patients express a stereotyped BcR (denoted as subset #2) with a short and highly similar VH CDR3 in combination with IGLV3-21 gene usage.Citation3,Citation10,Citation12 These subset #2 cases have a shorter time to progression, independent of IGHV gene mutational status, compared with non-subset #2 patients.Citation6 In contrast, subset #4 cases express stereotyped IGHV4-34/IGKV2-30 BcRs that are highly mutated and IgG switched; such cases have a low median age at diagnosis and display an indolent disease course compared with non-stereotyped, mutated IGHV4-34 patients.Citation6 Hence, the molecular classification of CLL according to BcR stereotypy seems to refine survival prediction compared with the broader sub-grouping according to IGHV gene mutational status alone, likely because subsets are considerably more homogeneous than the broad mutational categories (i.e., unmutated vs. mutated CLL).
Recently, we described distinct gene expression profiles in CLL cases that are assigned to two different subsets utilizing the IGHV4-34 gene, e.g., subset #4 and subset #16 (IGHV4-34/IGKV3-20).Citation13 These differences are especially noteworthy given that both subsets have similar mutational status; furthermore, they support the notion that the molecular classification of CLL based on BcR stereotypy reflects true biological differences stemming from distinct signaling pathways to CLL development. Along these lines, it is relevant to mention that the differentially expressed genes between subsets #4 and #16 are involved in important cell regulatory pathways, including immune response, proliferation and cell cycle control. In a separate study, global expression profiling of IGHV3-21 CLL patients revealed that genes involved in DNA replication/cell cycle control, transcription and protein kinase activity were preferentially expressed in comparison to non-IGHV3-21 patients, possibly contributing to the poor outcome associated with IGHV3–21 gene usage.Citation14
Previous reports in CLL have shown a strong correlation between promoter methylation and transcriptional silencing for individual genes (e.g., ZAP70, TWIST2, DAPK1 and HOXA4).Citation15-Citation18 Additionally, the methylation of several of these genes has been reported to correlate with the IGHV mutational status.Citation15,Citation16 More recently, we reported the first global DNA methylation profiling study in CLL using methylation arrays on patients belonging to the IGHV-mutated and IGHV-unmutated/IGHV3-21 groups.Citation19 Significant differences in methylation patterns were observed when comparing these subgroups; for instance, several tumor suppressor genes were methylated in IGHV-unmutated CLL, while a number of genes involved in cell proliferation and tumor progression were methylated in IGHV-mutated CLL.
Prompted by these findings, and also taking into account the distinct gene expression profiles of individual CLL subsets with stereotyped BcRs, we here extend our previous study by investigating DNA methylation in relation to BcR stereotypy. Our specific aim was to identify the regulatory processes that may underlie the functional and eventual clinical differences for CLL patients that belong to different subsets. To address this issue, we analyzed a unique collection of 39 CLL cases assigned to three major and paradigmatic stereotyped subsets that represent “extremes” in survival: the poor-prognostic subsets #1 and #2 and the favorable-prognostic subset #4.
Results
Distinct methylation profiles were observed in stereotyped CLL subsets
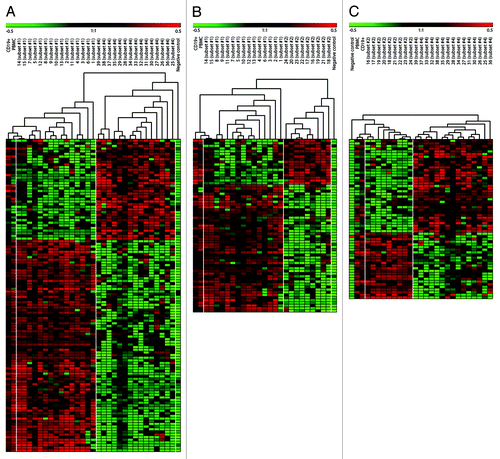
Genome-wide 27K methylation arrays were applied to analyze the DNA methylation patterns of 39 CLL samples belonging to stereotyped subsets #1, #2 and #4. In particular, each CLL subset was characterized by a unique methylation pattern, as visualized by unsupervised hierarchical and PCA analysis, where CLL samples were separated into three distinct clusters corresponding to their subset assignments (). Using stringent criteria based on p values and difference in mean MI (see Materials and Methods) many genes were identified as significantly differentially methylated between each subsets: 106 genes (118 CpG sites) differed between subsets #1 and #4, 60 genes (65 CpG sites) differed between subsets #1 vs. #2, while 56 genes (60 CpG sites) differed between subsets #2 and #4. Supervised hierarchical clustering of cases according to the methylation status of the differentially methylated genes is represented in .
Figure 1. Unsupervised hierarchical clustering (A) and three-dimensional principal component analysis (PCA) of DNA methylation data (B) comparing samples belonging to subset #1, subset #2 and subset #4. The S refers to the subset number while the following number refers to the specific case as detailed in Table S1.
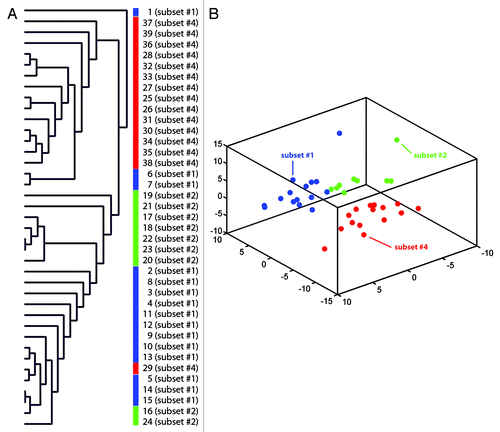
Figure 2. Supervised hierarchical clustering of differentially methylated genes (methylation index geometric mean difference > 0.35, p < 0.05). Comparisons were made between subsets #1 and #4 (A), subsets #1 and #2 (B) and subsets #2 and #4 (C). A gradient color scale represents the methylation index values; green as unmethylated and red as methylated.
Importantly, the sets of differentially methylated genes from the current comparisons showed only partial overlap (Fig. S1) with the corresponding set from the comparisons performed in our previous study on methylation in IGHV-mutated/unmutated and IGHV3–21 CLL (using the same criteria). This result could be viewed as further evidence that comparing more homogeneous CLL subgroups defined by BcR stereotypy may give more precise information than simply comparing the heterogeneous, broader IGHV mutational categories.Citation19
Differential methylation of genes involved in immune response
The gene list from each subset comparison was entered into the GOTM database tool in order to investigate the biological functions of the differentially methylated genes. Interestingly, the annotation of genes identified when comparing subset #1 to #2 or subset #1 to #4 revealed a significant overrepresentation of genes involved in various aspects of the immune response including the adaptive immune response, cytokine production, regulation of T helper cell differentiation and T cell proliferation (Tables S3 and S4). Among the most frequently listed genes were CD80, CD86, SPN (CD43) and IL10, but other immune response genes, such as IKBKE, TOLLIP, IL1F9 and FCRL4, were also identified (Table S3A). Of particular interest was the observation that the majority of these genes were methylated in subset #1 but not in subsets #2 and #4 (Table S4).
To investigate this further, GOTM analysis was performed separately for genes methylated in subset #1 but not in subset #2 (n = 65) or #4 (n = 124) after lowering the geometrical distance cutoff from 0.35 to 0.30 to increase the number of genes analyzed. In concordance with the above findings, enriched functions included various immune response categories, and the CD80, CD86 and IL10 genes were most prominent (Table S3B). Additionally, KEGG pathway analysis was performed for genes methylated in subset #1. Enriched pathways included immune signaling such as the Toll-like receptor signaling pathway (4 genes, CD80, CD86, IKBKE and TOLLIP, p = 0.004 vs. subset #2, p = 0.04 vs. subset #4). A separate GOTM analysis was performed for genes methylated in subsets #4 (n = 66) and #2 (n = 23) but not in subset #1 using the 0.30 cutoff. Among genes methylated in subset #4 enrichment for genes involved in biological/cell adhesion was observed (11 genes, p = 0.01) such as PECAM1, ITGAM and LAMA1 (Table S3C). No significant enrichment was seen among genes methylated in subset #2 vs. #1, probably due to the low number of genes.
Pyrosequencing confirmed differential methylation of CD80 and CD86
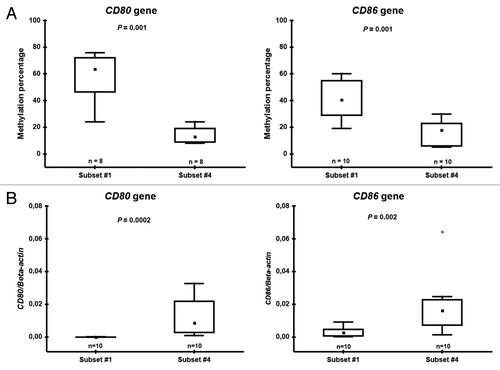
Prompted by (1) the herein reported significant differences in methylation status of the CD80 and CD86 immune response genes and; (2) our recent immune profiling studies of subsets #1 and #4 demonstrating significantly lower CD86 expression in subset #1, we sought to evaluate further the DNA methylation levels for CD80 and CD86 by a quantitative method using pyrosequencing technology in subset #1 and #4 CLL patient samples. The methylation percentage as measured by pyrosequencing was significantly higher in subset #1 than subset #4 samples for both the CD80 gene (median methylation 64% vs. 13%, p = 0.001) and the CD86 gene (median methylation 41% vs. 18%, p = 0.001) (). Furthermore, there was a good correlation between the methylation levels as detected by the Illumina array and pyrosequencing for individual patient samples for the CD80 gene (r = 0.88). Hence, we were able to validate our observations from the array data using an independent method.
Figure 3. Pyrosequencing (A) and RQ-PCR (B) data on CD80 and CD86 in subset #1 and #4 patient samples. Boxes indicate the interquartile range (25–75%) while the small inner square indicates the median value. The whiskers represent the minimum and maximum values, except for outliers (circles) and extremes (stars).
Correlation of CD80 and CD86 methylation status with gene expression
The mRNA expression levels of CD80 and CD86 were compared in subset #1 and #4 samples using RQ-PCR. For both CD80 and CD86, methylated in subset #1 but unmethylated in subset #4, the gene expression correlated with the methylation status. Specifically, the expression was significantly lower in subset #1 samples compared with subset #4 samples (CD80 p = 0.0002, CD86 p = 0.002, ). Along with the mRNA expression levels, the protein expression levels also supported the data showing higher expression of CD80 and CD86 in subset #4 samples (n = 4) compared with the expression levels in both IGHV-unmutated/subset #1 samples (n = 3), which were analyzed by FACS analysis using CD80 and CD86 antibodies (Table S5). In the case of CD86, it is relevant to note that the results herein reported accurately recapitulate our previous findings in subsets #1 and #4 from an independent series of experiments.Citation20,Citation21
Furthermore, the expression of nine additional genes was compared in subset #1 and #4 specimens. For two genes (ABI3, p = 0.002; and NGFR, p = 0.0004), the gene expression correlated significantly with the DNA methylation status, but for seven genes there was either no difference (SPN, CIAS, GRP55, IKBKE, NCOR2 and RIPK3) in gene expression between the subsets, or an inverse correlation (CST7) with DNA methylation status (data not shown).
Discussion
It is now widely recognized that DNA methylation is an important epigenetic modification and that aberrant methylation patterns are associated with tumorigenesis.Citation22,Citation23 In a previous study using methylation arrays we were able to observe differential methylation profiles between IGHV-mutated/-unmutated and IGHV3-21 CLL subgroups.Citation19 More recently, we and others could confirm and extend this finding using 450K-arrays.Citation24,Citation25 In the present study, we further explored global methylation in subsets with BcR stereotypy. This approach is justified by ever-increasing evidence that different subsets are characterized by high intra-subset homogeneity and consistency for clinical presentation and outcome,Citation6,Citation11 genomic aberrations,Citation26,Citation27 antigen reactivityCitation28,Citation29 and immune signalingCitation20,Citation21 even beyond their IGHV gene mutational status.
The present study is based on the analysis of a unique collection of samples belonging to three major stereotyped CLL subsets,Citation9 i.e., the poor-prognostic subsets #1, #2 and the good-prognostic subset #4. Overall, significant differences in the global methylation profile were observed between the three subsets () that were clearly separated from each other in the PCA (), thus further corroborating the notion that the subgrouping of CLL into distinct subsets based on BcR sequence stereotypy reflects actual biological differences and is also functionally and clinically relevant. Perhaps even more importantly, only a partial overlap was observed between differentially methylated genes identified in the present study compared with our methylation profiling according to IGHV gene mutational status (Fig. S1).Citation19 This finding further underscores that the IGHV-mutated/-unmutated subgroups include a considerably more heterogeneous assortment whereas stereotyped CLL subsets represent more homogeneous groups, enabling to reach more consistent and robust conclusions even when analyzing a more limited number of cases as in the present study.
Gene ontology analysis revealed enrichment of distinct biological processes in different subset comparisons, where one of the most striking findings was a prominent overrepresentation of genes involved in immune response, such as regulation of adaptive immune response, cytokine biosynthesis and T cell proliferation, which were generally more methylated in subset #1 vs. subsets #2 and, especially, #4 (Tables S3 and S4). In more detail, targets methylated in subset #1 were enriched for adaptive immune response genes (e.g., CD80, CD86 and IL10) and NF-κB-inducing kinase activity (IKBKE, PPP4C and RIPK3), while the only enriched categories among targets methylated in subset #4 were biological and cell adhesion (e.g., ITGAM, PECAM1 and LAMA1). In contrast, no particular gene category was enriched among genes methylated in subset #2.
We decided to focus the validation part on the two prototypic subsets, subsets #1 and #4, where data on distinct immune profiling has started to emerge,Citation30 as well as on two genes, CD80 and CD86, which repeatedly came up in our analyses as methylated in subset #1 and unmethylated in subset #4. The observation of differential methylation of CD80 and CD86 in the array data was first validated by an independent method, i.e., pyrosequencing, and, importantly, the gene and protein expression of both CD80 and CD86 were found higher in subset #4 cases than subset #1 cases (). CD80 and CD86, which are both expressed on the surface of antigen presenting B cells, have been shown to physically interact with the CD28 receptor on T cells. These co-stimulating signals are absolutely necessary for optimal T cell activation and prevent T cell death during primary immune activation.Citation31 Both CD80 and CD86 have previously been reported to be upregulated on CLL cells after triggering via CD40 or after exposure to pre-activated T cells in vitro.Citation32,Citation33 Recent gene expression data also demonstrated high CD80/CD86 expression in IGHV-mutated CLL cases compared with unmutated cases and in particular CD86 was highly expressed in subset #4 compared with subset #1 CLL.Citation20 Furthermore, CD86 expression could be upregulated in subset #4 CLL cells after stimulation via Toll-like receptors but to a much lesser extent in subset #1 CLL cells.Citation21
Taken together, these results may imply that subset #4 CLL clones expressing higher levels of CD80 and CD86 engage in and perhaps are actively dependent on crosstalk with their microenvironment, including T cells. We obtained additional support for this hypothesis by performing co-culturing experiments with CLL cell lines expressing CD80/CD86 and allogeneic T cells from healthy donors, which revealed induction of T cell activation (Figs. S2 and S3). Admittedly, these findings have to be corroborated also on primary CLL cells, yet, despite their preliminary nature, they can be taken to imply an important role for CD80 and CD86 in the pathophysiology of CLL in general and CLL subset #4 in particular. Questions remain especially as to how this capacity for immune signaling can be reconciled with the particularly indolent clinical behavior of CLL subset #4 that points to diminished responsiveness to microenvironmental stimulation. A propos this latter point, it is relevant to note that subset #4 is also outstanding among all other CLL for exhibiting pronounced intra-clonal diversification due to ongoing somatic hypermutation, very likely in the context of active immune signaling.Citation34,Citation35
Certainly, our study can offer only a partial view of the global DNA methylation patterns in the CLL subsets analyzed, as the Illumina 27K array is biased toward promoter CpG islands and covers only a proportion of all CpG sites in the genome. Interestingly, we did observe that the majority (62–78%) of differentially methylated CpG sites in our three subset comparisons were located outside CpG islands compared with only 27% of CpG probes on the array. Recent studies have also shown that CpG sites that are located outside CpG islands, in regions known as shores and shelves, appear more differentially methylated and play an important role in regulation of gene expression.Citation24,Citation25,Citation36,Citation37 Future approaches using next-generation sequencing may hence reveal the full spectrum of aberrant methylation in different parts of the genome in stereotyped subsets of CLL.
In conclusion, distinct methylation profiles were identified for three major and paradigmatic stereotyped CLL subsets. Importantly, gene ontology analysis revealed enrichment for immune response genes, such as CD80 and CD86, among targets methylated in subset #1 but remaining unmethylated and expressed in subset #4. In line with our previous report of distinct gene expression patterns for stereotyped CLL,Citation13 these novel findings provide additional evidence for distinct patterns of transcriptional control among CLL subsets and further underscore the validity of the molecular sub-classification of CLL according to BcR stereotypy.
Patients and Methods
Patient samples
Tumor samples from 39 CLL patients (24 males, 15 females) were included in this study; 37 derived from peripheral blood, while 2 samples were from bone marrow. Samples were collected from collaborating institutes in Greece (n = 18) and Sweden (n = 21). Cases were diagnosed and classified according to recently revised criteriaCitation38 and displayed the typical CLL immunophenotype with a tumor percentage of ≥ 70%. Based on IG gene sequence features and following previously established criteria defined according to Stamatopoulos et al. and Murray et al.,Citation6,Citation7 cases were assigned to three groups: (1) subset #1: 15 cases; (2) subset #2: 9 cases and (3) subset #4: 15 cases. Clinical and molecular characteristics for all patients, including immunogenetic features of the clonotypic BcRs, are summarized in Table S1. In total, 7 samples (2 subset #1 and 5 subset #2 cases) overlapped with our recent methylation array study on IGHV mutated/unmutated and IGHV3-21 CLL (Table S1).Citation19 A negative control (whole-genome amplified DNA) was included in the analysis as well as two healthy control samples, one with peripheral blood mononuclear cells (PBMC) and the other with CD19 sorted B cells.Citation19 Written informed consent was obtained according to the Helsinki declaration and the study was approved by the local Ethics Review Committee from each institution.
Methylation array and data analysis
In this study, Illumina Infinium HumanMethylation27 BeadChip arrays (Illumina, WG-311-2201), which allow analysis of 27,578 CpG dinucleotides covering 14,495 genes, were applied. Bi-sulfite conversion of genomic DNA was performed using the EZ DNA Methylation-Gold Kit (Zymo Research, D5005) as outlined previously.Citation19 The BeadStudio software (Illumina) was used to analyze fluorescence as previously described.Citation19 Quality control of array data revealed that all cases had > 98% of CpG probes (> 27,026) with a p value < 0.01, except two cases where > 95% of CpG probes (> 26,199) had a p value < 0.01. The methylation status for each detected CpG site ranged between 0 (completely unmethylated) to 1 (completely methylated). Subsequent bioinformatics analysis of the methylation data was performed in R (www.r-project.org). In order to identify any differences in methylation between the subsets (i.e. subsets #1, #2 and #4), data was quantile normalized and arcsin transformed, and an empirical Bayes moderated t-test was applied using the “limma” package. P values were adjusted using the method of Benjamini and Hochberg and a level of p < 0.05 was used as a cut-off. In order to identify genes displaying the greatest difference in methylation among subsets, a further filter incorporating an average geometric difference of 0.35 was applied, although the cutoff was lowered to 0.30 for selected gene ontology analyses. This measure was added to ensure that only genes with large absolute differences remained. Results were visualized by heatmaps and dendrograms using Genesis TreeView version 1.2.7 (www.genome.tugraz.at). Principal component analysis (PCA) was applied to visualize the data; more specifically, the “princomp” function in Matlab was used. Furthermore, the Gene Ontology Tree Machine (GOTM) online software (http://bioinfo.vanderbilt.edu/gotm) was applied for identification of significant GO and KEGG pathway categories within the data set, using the Illumina 27K array as a reference set and the Benjamini and Hochberg method for multiple test adjustment where p < 0.05 was considered significant.
Gene expression analysis using real-time quantitative PCR
Real-time quantitative PCR (RQ-PCR) analysis was performed to measure the expression levels of 11 genes. Total RNA was extracted from sorted CLL cells (Dynal B Cell Negative Isolations Kit, Invitrogen, 113.13D) from subset #1 (n = 10) and subset #4 (n = 10) patients using the RNeasy Mini kit (Qiagen, 74104) according to the manufacturer’s protocol. Reverse transcription (RT) reaction was performed using the MMLV-RT kit (Invitrogen, 28025–013) and random hexamers (Fermentas, SO142) according to the manufacturer’s protocol. RQ-PCR primers were designed with the Primer3 software (Broad institute) and RQ-PCR analysis was performed using the MaximaTM SYBR Green Master Mix according to manufacturer’s protocol (Fermentas, K0251). Beta-actin expression was used as an internal reference. Gene expression was analyzed using the ΔCt method and differences between subsets were evaluated using the Mann-Whitney U nonparametric test and the Statistica 9.0 software (Stat Soft). p < 0.05 was considered significant.
Pyrosequencing assay
Pyrosequencing was performed for two genes (CD80 and CD86) in order to measure methylation levels in subset #1 and subset #4 patient samples. Genomic DNA was bisulfite converted using the EZ DNA Methylation Kit according to manufacturer’s protocol as described previously.Citation19 The PyroMarkTM software was used to design pyrosequencing primers; one forward and one reverse primer for PCR amplification of the desired product (one biotin labeled in the 5′ end) and one sequencing primer. The sequenced target region contained the specific CpG site targeted by the Illumina methylation array along with nearby CpG sites. Primer sequences, total number of CpG sites covered in the target region and the size of the amplified product are specified in Table S2. In brief, bisulfite converted DNA was subjected to PCR amplification in total of 25 µl. Eighteen to twenty microliters of PCR product were immobilized to 2 μL of Streptavidin Sepharose High Performance (GE Healthcare, 17-5113-01) followed by annealing in 25 μL of annealing buffer containing 0.3 μM of sequencing primer for 2 min at 80°C. The analysis was performed using the PyroMarkTM Q24 pyrosequencer instrument (Bioetage Inc., 9001514). CpG site methylation analysis was done with PyroMark Q24 software (9019062), and for each gene CpG methylation percentage was calculated for CLL patient samples. Methylation differences between subsets were evaluated using Mann-Whitney U nonparametric test and the Statistica 9.0 software. p < 0.05 was considered significant.
Additional material
Download Zip (619.4 KB)Acknowledgments
This work was supported by the Nordic Cancer Union, the Swedish Cancer Society, the Swedish Research Council, the Medical Faculty of Uppsala University, Uppsala University Hospital, and Lion's Cancer Research Foundation in Uppsala, Sweden, the Cariplo Foundation in Milan, Italy, and the ENosAI project (code 09SYN-13-880), co-funded by the EU and the Greek General Secretariat for Research and Technology.
Disclosure of Potential Conflicts of Interest
No potential conflicts of interest were disclosed.
Supplemental Materials
Supplemental materials may be found here: www.landesbioscience.com/journals/epigenetics/article/22901
References
- Damle RN, Wasil T, Fais F, Ghiotto F, Valetto A, Allen SL, et al. Ig V gene mutation status and CD38 expression as novel prognostic indicators in chronic lymphocytic leukemia. Blood 1999; 94:1840 - 7; PMID: 10477712
- Hamblin TJ, Davis Z, Gardiner A, Oscier DG, Stevenson FK. Unmutated Ig V(H) genes are associated with a more aggressive form of chronic lymphocytic leukemia. Blood 1999; 94:1848 - 54; PMID: 10477713
- Tobin G, Thunberg U, Johnson A, Eriksson I, Söderberg O, Karlsson K, et al. Chronic lymphocytic leukemias utilizing the VH3-21 gene display highly restricted Vlambda2-14 gene use and homologous CDR3s: implicating recognition of a common antigen epitope. Blood 2003; 101:4952 - 7; http://dx.doi.org/10.1182/blood-2002-11-3485; PMID: 12586612
- Tobin G, Thunberg U, Karlsson K, Murray F, Laurell A, Willander K, et al. Subsets with restricted immunoglobulin gene rearrangement features indicate a role for antigen selection in the development of chronic lymphocytic leukemia. Blood 2004; 104:2879 - 85; http://dx.doi.org/10.1182/blood-2004-01-0132; PMID: 15217826
- Messmer BT, Albesiano E, Efremov DG, Ghiotto F, Allen SL, Kolitz J, et al. Multiple distinct sets of stereotyped antigen receptors indicate a role for antigen in promoting chronic lymphocytic leukemia. J Exp Med 2004; 200:519 - 25; http://dx.doi.org/10.1084/jem.20040544; PMID: 15314077
- Stamatopoulos K, Belessi C, Moreno C, Boudjograh M, Guida G, Smilevska T, et al. Over 20% of patients with chronic lymphocytic leukemia carry stereotyped receptors: Pathogenetic implications and clinical correlations. Blood 2007; 109:259 - 70; http://dx.doi.org/10.1182/blood-2006-03-012948; PMID: 16985177
- Murray F, Darzentas N, Hadzidimitriou A, Tobin G, Boudjogra M, Scielzo C, et al. Stereotyped patterns of somatic hypermutation in subsets of patients with chronic lymphocytic leukemia: implications for the role of antigen selection in leukemogenesis. Blood 2008; 111:1524 - 33; http://dx.doi.org/10.1182/blood-2007-07-099564; PMID: 17959859
- Darzentas N, Hadzidimitriou A, Murray F, Hatzi K, Josefsson P, Laoutaris N, et al. A different ontogenesis for chronic lymphocytic leukemia cases carrying stereotyped antigen receptors: molecular and computational evidence. Leukemia 2010; 24:125 - 32; http://dx.doi.org/10.1038/leu.2009.186; PMID: 19759557
- Agathangelidis A, Darzentas N, Hadzidimitriou A, Brochet X, Murray F, Yan XJ, et al. Stereotyped B-cell receptors in one-third of chronic lymphocytic leukemia: a molecular classification with implications for targeted therapies. Blood 2012; 119:4467 - 75; http://dx.doi.org/10.1182/blood-2011-11-393694; PMID: 22415752
- Ghia P, Stamatopoulos K, Belessi C, Moreno C, Stella S, Guida G, et al. Geographic patterns and pathogenetic implications of IGHV gene usage in chronic lymphocytic leukemia: the lesson of the IGHV3-21 gene. Blood 2005; 105:1678 - 85; http://dx.doi.org/10.1182/blood-2004-07-2606; PMID: 15466924
- Bomben R, Dal Bo M, Capello D, Forconi F, Maffei R, Laurenti L, et al. Molecular and clinical features of chronic lymphocytic leukaemia with stereotyped B cell receptors: results from an Italian multicentre study. Br J Haematol 2009; 144:492 - 506; http://dx.doi.org/10.1111/j.1365-2141.2008.07469.x; PMID: 19036101
- Thorsélius M, Kröber A, Murray F, Thunberg U, Tobin G, Bühler A, et al. Strikingly homologous immunoglobulin gene rearrangements and poor outcome in VH3-21-using chronic lymphocytic leukemia patients independent of geographic origin and mutational status. Blood 2006; 107:2889 - 94; http://dx.doi.org/10.1182/blood-2005-06-2227; PMID: 16317103
- Marincevic M, Mansouri M, Kanduri M, Isaksson A, Göransson H, Smedby KE, et al. Distinct gene expression profiles in subsets of chronic lymphocytic leukemia expressing stereotyped IGHV4-34 B-cell receptors. Haematologica 2010; 95:2072 - 9; http://dx.doi.org/10.3324/haematol.2010.028639; PMID: 20801898
- Fält S, Merup M, Tobin G, Thunberg U, Gahrton G, Rosenquist R, et al. Distinctive gene expression pattern in VH3-21 utilizing B-cell chronic lymphocytic leukemia. Blood 2005; 106:681 - 9; http://dx.doi.org/10.1182/blood-2004-10-4073; PMID: 15817677
- Corcoran M, Parker A, Orchard J, Davis Z, Wirtz M, Schmitz OJ, et al. ZAP-70 methylation status is associated with ZAP-70 expression status in chronic lymphocytic leukemia. Haematologica 2005; 90:1078 - 88; PMID: 16079107
- Raval A, Lucas DM, Matkovic JJ, Bennett KL, Liyanarachchi S, Young DC, et al. TWIST2 demonstrates differential methylation in immunoglobulin variable heavy chain mutated and unmutated chronic lymphocytic leukemia. J Clin Oncol 2005; 23:3877 - 85; http://dx.doi.org/10.1200/JCO.2005.02.196; PMID: 15809452
- Strathdee G, Sim A, Parker A, Oscier D, Brown R. Promoter hypermethylation silences expression of the HoxA4 gene and correlates with IgVh mutational status in CLL. Leukemia 2006; 20:1326 - 9; http://dx.doi.org/10.1038/sj.leu.2404254; PMID: 16688227
- Raval A, Tanner SM, Byrd JC, Angerman EB, Perko JD, Chen SS, et al. Downregulation of death-associated protein kinase 1 (DAPK1) in chronic lymphocytic leukemia. Cell 2007; 129:879 - 90; http://dx.doi.org/10.1016/j.cell.2007.03.043; PMID: 17540169
- Kanduri M, Cahill N, Göransson H, Enström C, Ryan F, Isaksson A, et al. Differential genome-wide array-based methylation profiles in prognostic subsets of chronic lymphocytic leukemia. Blood 2010; 115:296 - 305; http://dx.doi.org/10.1182/blood-2009-07-232868; PMID: 19897574
- Arvaniti E, Ntoufa S, Papakonstantinou N, Touloumenidou T, Laoutaris N, Anagnostopoulos A, et al. Toll-like receptor signaling pathway in chronic lymphocytic leukemia: distinct gene expression profiles of potential pathogenic significance in specific subsets of patients. Haematologica 2011; 96:1644 - 52; http://dx.doi.org/10.3324/haematol.2011.044792; PMID: 21750087
- Ntoufa S, Vardi A, Papakonstantinou N, Anagnostopoulos A, Aleporou-Marinou V, Belessi C, et al. Distinct Innate Immunity Pathways to Activation and Tolerance in Subgroups of Chronic Lymphocytic Leukemia with Distinct Immunoglobulin Receptors. Molecular medicine (Cambridge, Mass 2012.
- Das PM, Singal R. DNA methylation and cancer. J Clin Oncol 2004; 22:4632 - 42; http://dx.doi.org/10.1200/JCO.2004.07.151; PMID: 15542813
- Robertson KD. DNA methylation and human disease. Nat Rev Genet 2005; 6:597 - 610; http://dx.doi.org/10.1038/nrg1655; PMID: 16136652
- Cahill N, Bergh AC, Kanduri M, Göransson-Kultima H, Mansouri L, Isaksson A, et al. 450K-array analysis of chronic lymphocytic leukemia cells reveals global DNA methylation to be relatively stable over time and similar in resting and proliferative compartments. Leukemia 2012; In press http://dx.doi.org/10.1038/leu.2012.245; PMID: 22922567
- Kulis M, Heath S, Bibikova M, Queirós AC, Navarro A, Clot G, et al. Epigenomic analysis detects widespread gene-body DNA hypomethylation in chronic lymphocytic leukemia. Nat Genet 2012; 44:1236 - 42; http://dx.doi.org/10.1038/ng.2443; PMID: 23064414
- Athanasiadou A, Stamatopoulos K, Gaitatzi M, Stavroyianni N, Fassas A, Anagnostopoulos A. Recurrent cytogenetic findings in subsets of patients with chronic lymphocytic leukemia expressing IgG-switched stereotyped immunoglobulins. Haematologica 2008; 93:473 - 4; http://dx.doi.org/10.3324/haematol.11872; PMID: 18310544
- Marincevic M, Cahill N, Gunnarsson R, Isaksson A, Mansouri M, Göransson H, et al. High-density screening reveals a different spectrum of genomic aberrations in chronic lymphocytic leukemia patients with ‘stereotyped’ IGHV3-21 and IGHV4-34 B-cell receptors. Haematologica 2010; 95:1519 - 25; http://dx.doi.org/10.3324/haematol.2009.021014; PMID: 20421269
- Chu CC, Catera R, Zhang L, Didier S, Agagnina BM, Damle RN, et al. Many chronic lymphocytic leukemia antibodies recognize apoptotic cells with exposed nonmuscle myosin heavy chain IIA: implications for patient outcome and cell of origin. Blood 2010; 115:3907 - 15; http://dx.doi.org/10.1182/blood-2009-09-244251; PMID: 20110421
- Binder M, Léchenne B, Ummanni R, Scharf C, Balabanov S, Trusch M, et al. Stereotypical chronic lymphocytic leukemia B-cell receptors recognize survival promoting antigens on stromal cells. PLoS One 2010; 5:e15992; http://dx.doi.org/10.1371/journal.pone.0015992; PMID: 21209908
- Papakonstantinou N, Ntoufa S, Papadopoulos G, Hatzigeorgiou A, Anagnostopoulos A, Chlichlia A, et al. Distinct profiles of miRNAs modulating immune signalling pathways in different subsets of chronic lymphocytic Leukemia. EHA. Amsterdam, 2012.
- Peach RJ, Bajorath J, Naemura J, Leytze G, Greene J, Aruffo A, et al. Both extracellular immunoglobin-like domains of CD80 contain residues critical for binding T cell surface receptors CTLA-4 and CD28. J Biol Chem 1995; 270:21181 - 7; http://dx.doi.org/10.1074/jbc.270.36.21181; PMID: 7545666
- Van den Hove LE, Van Gool SW, Vandenberghe P, Bakkus M, Thielemans K, Boogaerts MA, et al. CD40 triggering of chronic lymphocytic leukemia B cells results in efficient alloantigen presentation and cytotoxic T lymphocyte induction by up-regulation of CD80 and CD86 costimulatory molecules. Leukemia 1997; 11:572 - 80; http://dx.doi.org/10.1038/sj.leu.2400598; PMID: 9096698
- Romano C, De Fanis U, Sellitto A, Dalla Mora L, Chiurazzi F, Giunta R, et al. Effects of preactivated autologous T lymphocytes on CD80, CD86 and CD95 expression by chronic lymphocytic leukemia B cells. Leuk Lymphoma 2003; 44:1963 - 71; http://dx.doi.org/10.1080/1042819031000111026; PMID: 14738151
- Sutton LA, Kostareli E, Hadzidimitriou A, Darzentas N, Tsaftaris A, Anagnostopoulos A, et al. Extensive intraclonal diversification in a subgroup of chronic lymphocytic leukemia patients with stereotyped IGHV4-34 receptors: implications for ongoing interactions with antigen. Blood 2009; 114:4460 - 8; http://dx.doi.org/10.1182/blood-2009-05-221309; PMID: 19713457
- Kostareli E, Sutton LA, Hadzidimitriou A, Darzentas N, Kouvatsi A, Tsaftaris A, et al. Intraclonal diversification of immunoglobulin light chains in a subset of chronic lymphocytic leukemia alludes to antigen-driven clonal evolution. Leukemia 2010; 24:1317 - 24; http://dx.doi.org/10.1038/leu.2010.90; PMID: 20463750
- Doi A, Park IH, Wen B, Murakami P, Aryee MJ, Irizarry R, et al. Differential methylation of tissue- and cancer-specific CpG island shores distinguishes human induced pluripotent stem cells, embryonic stem cells and fibroblasts. Nat Genet 2009; 41:1350 - 3; http://dx.doi.org/10.1038/ng.471; PMID: 19881528
- Irizarry RA, Ladd-Acosta C, Wen B, Wu Z, Montano C, Onyango P, et al. The human colon cancer methylome shows similar hypo- and hypermethylation at conserved tissue-specific CpG island shores. Nat Genet 2009; 41:178 - 86; http://dx.doi.org/10.1038/ng.298; PMID: 19151715
- Hallek M, Cheson BD, Catovsky D, Caligaris-Cappio F, Dighiero G, Döhner H, et al, International Workshop on Chronic Lymphocytic Leukemia. Guidelines for the diagnosis and treatment of chronic lymphocytic leukemia: a report from the International Workshop on Chronic Lymphocytic Leukemia updating the National Cancer Institute-Working Group 1996 guidelines. Blood 2008; 111:5446 - 56; http://dx.doi.org/10.1182/blood-2007-06-093906; PMID: 18216293