Abstract
Renal cell carcinoma (RCC) accounts for around 3% of cancers in the UK, and both incidence and mortality are increasing with the aging population. RCC can be divided into several subtypes: conventional RCC (the most common, comprising 75% of all cases), papillary RCC (15%) and chromophobe RCC (5%). Renal oncocytoma is a benign tumor and accounts for 5% of RCC. Cancer and epigenetics are closely associated, with DNA hypermethylation being widely accepted as a feature of many cancers. In this study the DNA methylation profiles of chromophobe RCC and renal oncocytomas were investigated by utilizing the Infinium HumanMethylation450 BeadChips. Cancer-specific hypermethylation was identified in 9.4% and 5.2% of loci in chromophobe RCC and renal oncocytoma samples, respectively, while the majority of the genome was hypomethylated. Thirty (hypermethylated) and 41 (hypomethylated) genes were identified as differentially methylated between chromophobe RCC and renal oncocytomas (p < 0.05). Pathway analysis identified some of the differentially hypermethylated genes to be involved in Wnt (EN2), MAPK (CACNG7) and TGFβ (AMH) signaling, Hippo pathway (NPHP4), and cell death and apoptosis (SPG20, NKX6-2, PAX3 and BAG2). In addition, we analyzed ccRCC and papillary RCC data available from The Cancer Genome Atlas portal to identify differentially methylated loci in chromophobe RCC and renal oncocytoma in relation to the other histological subtypes, providing insight into the pathology of RCC subtypes and classification of renal tumors.
Introduction
Renal cell carcinomas (RCCs) arise from the epithelium of renal tubules and are the most common type of renal cancers in adults. RCC consists of a group of heterogeneous tumors ranging in their malignant potential from benign to highly tumorigenic. RCCs are classified into four main types: conventional (clear cell), papillary, chromophobe and collecting duct carcinoma. The most common types among these are conventional and papillary, which together account for 85–90% of all RCCs. Chromophobe RCC accounts for 5% of renal tumors and is histologically similar to renal oncocytoma, a benign kidney neoplasm, accounting for another 5% of renal tumors.Citation1 Each histological subtype harbors different genetic, biological and clinical properties and responds differently to therapy.
Although the vast majority of renal tumors occur sporadically, several inherited cancer syndromes are associated with the development of renal cancer.Citation2,Citation3 These include von Hippel-Lindau syndrome, hereditary papillary RCC, hereditary leiomyomatosis and Birt-Hogg-Dube syndrome (BHD). Much of our knowledge base for the molecular basis of sporadic RCC has been achieved by identification and functional characterization of the genes predisposing to the familial RCCs mentioned above (VHL, MET, FH and FLCN, respectively).Citation4-Citation7 Second generation sequencing projects have led to the identification of additional genes implicated in sporadic RCC, including polybromo-1 (PBRM1), mutated in 37% of sporadic clear cell RCC (ccRCC).Citation8 PBRM1 is located on 3p (as is the VHL gene), a region that is often deleted in ccRCC. PBRM1 forms part of the PBAF SWI/SNF chromatin remodeling complex that regulates gene transcription and DNA integrity. Genes associated with histone modifications have also been identified by large scale sequencing projects in ccRCC, although at a much lower frequency of mutations (1−4%). These include histone methylases (SETD2 and MLL2) and histone demethylases (JARID1C and UTX).Citation9,Citation10
Epigenetic alterations play a significant role in the development and progression of human tumors. DNA methylation is a hallmark of many cancers and is increasingly utilized in clinical trials (epigenetic therapy) due to the reversible nature of the biological processes underlying DNA methylation. We and others identified RASSF1A tumor suppressor gene (TSG) to be frequently methylated in ccRCC as well as in other epithelial cancers, but to be rarely mutated in RCC and other cancers.Citation11,Citation12 Hence, strategies to identify epigenetically inactivated genes in cancer can provide very useful molecular tools to understand the pathogenesis of cancer as well as to develop molecular markers for diagnostic and prognostic purposes. In the past, we have used a range of molecular techniques, including candidate gene analysis and high throughput platforms such as MeDIP, functional epigenomics and genome-wide methylation arrays to elucidate the epigenome of ccRCC.Citation13-Citation16 There is a dearth of knowledge in regards to epigenetic analysis of more rare types of RCC; hence, in the present report we have analyzed the epigenome of chromophobe RCC and renal oncocytomas using the latest Infinium HumanMethylation450 BeadChips to elucidate molecular pathways deregulated in these two entities and to help identify DNA methylation markers for the classification of renal tumors.
Results
Validation of the HumanMethylation450 BeadChips results
Global methylation profiles of chromophobe RCC and renal oncocytoma samples in relation to four normal kidney samples were generated on the Infinium HumanMethylation450 BeadChips. A list of all probes methylated in > 30% of all the samples for each given RCC subtype is given in Tables S1 and S2.
The reproducibility of the HumanMethylation450 BeadChips results was examined via incorporation of a duplicate renal oncocytoma sample. Average β values for each locus were plotted to identify correlation between the two replicates (Fig. S1). Pearson's correlation coefficient (r) was 0.997, indicating high correlation and, thus, reproducibility of the array.
Further confirmation of the HumanMethylation450 BeadChips results was obtained by single colony sequencing of bisulfite modified DNA of three genes (BNC1, FOXL1 and OVOL1) previously identified to be frequently hypermethylated in ccRCC and also hypermethylated in our cohort.Citation16 Loci identified to be methylated (β value > 0.5) also showed a high methylation index (MI > 50%), while loci with low β values showed low MI (; Fig. S2).
Figure 1. Validation of probe β values using bisulfite clone sequencing of FOXL1 and OVOL1. Single colony sequencing of FOXL1 and OVOL1, which were previously identified to be methylated in ccRCC and determined to be methylated with a β value > 0.5, was conducted in some of our samples. Hypermethylated loci (β value > 0.5) also showed a high methylation index (MI > 50%), while low β value loci correlated with a low MI. Bisulfite sequencing rows represent individual alleles, with each circle indicating location and methylation state of a CpG locus (black circle: methylated; white circle: unmethylated). Arrowheads indicate the HumanMethylation450 array locus under investigation. Also listed next to the gene name are the Target IDs.
Chromophobe and oncocytoma methylome
Figure S3 depicts the stepwise analysis of the HumanMethylation450 data to identify cancer specific hyper- or hypo-methylation (see also Materials and Methods). We analyzed 20 chromophobe RCC samples and 21 renal oncocytoma samples as well as 4 normal kidney samples. For cancer specific hypermethylation, a CpG locus was considered hypermethylated if the β value was > 0.5 in the tumor sample (with all normal kidney samples showing a β value < 0.25) and hypomethylated if the β value was < 0.25 in the tumor sample (with all normal kidney samples showing a β value > 0.5).
Supervised hierarchical clustering using Euclidean distance complete linkage of the 500 most variable cancer specific hypermethylated loci identified two main clusters, with the majority of samples clustered in Cluster I and associated with a lower level of methylation (). Sub-clustering within Cluster I reveals three further clusters with the trend to subdivide the samples according to histology. Cluster I.1 contained 7 oncocytoma samples and 2 chromophobe samples, Cluster I.2 contained 8 oncocytoma samples and Cluster I.3 possessed the majority of chromophobe samples within Cluster I (10) and only 6 oncocytoma samples. Cluster II contained 6 chromophobe samples with the highest level of methylation and one chromophobe sample with widespread hypermethylation reminiscent of a CIMP positive phenotype (). Supervised hierarchical clustering of the 500 most variable cancer specific hypomethylated loci also separated the two histologies, and grouped samples into four clusters. Cluster I presented the lowest levels of methylation and consisted predominantly of oncocytoma samples (14) and one chromophobe sample. Clusters II and III were composed predominantly of chromophobe samples (8 and 5, respectively), with only 2 oncocytoma samples, and presented an overall profile of methylation in the probes examined. Group IV clustered the samples with the lowest amount of hypomethylation and consisted of 5 oncocytoma samples and 4 chromophobe samples (). No clustering was observed in relation to age or gender.
Figure 2. Supervised hierarchical clustering using Euclidean distance complete linkage of the 500 most variable cancer-specific hypermethylated (A) and hypomethylated (B) loci. Below the hierarchical cluster, the top row shows black squares for chromophobe samples and white squares for oncocytoma samples. Gender is denoted in the middle row: female by black squares and male by white squares. Patient age range is indicated in the lower row: 30–49 y, white squares; 50–69 y, gray squares; 70–89 y, black squares. Samples lacking these data are indicated by crossed out boxes. No clustering was observed in relation to gender or age.
Global methylation profiling of chromophobe RCC and renal oncocytoma samples in relation to 4 normal kidney samples showed that only a small percentage of CpGs were differentially methylated between normal kidney and chromophobe RCC samples (1.2%) or oncocytoma RCC samples (0.6%) (). Interestingly, both chromophobe RCC and renal oncocytoma samples presented a large proportion of loci that were hypomethylated (90.6% or 4,023 loci for chromophobe RCC and 99.4% or 2,258 loci for renal oncocytoma) with a smaller percentage of cancer-specific probes being hypermethylated in > 30% samples (chromophobe RCC: 9.4%, 416 loci, 204 genes; renal oncocytoma: 5.2%, 125 loci, 70 genes) (; Tables S1 and S2). Investigation into the genomic distribution of the above hyper- and hypo-methylated loci in relation to known genes and CpG islands (CGIs) showed little variation between the two characterized cancers. It should also be noted that the percentage of loci residing in the promoter, 3′UTR, gene body or intergenic regions did not differ much between hyper- and hypo-methylated filters (). The distribution of loci in relation to CGIs concurred with previous reports,Citation17 with a distinct trend showing that hypermethylation is mainly located in regions of dense CpG loci (CGI, shores and shelves), 79.1% and 76.0% for chromophobe RCC and renal oncocytoma samples, respectively. Hypomethylated loci were predominantly located in regions of low CpG density / isolated CpG loci, known as open sea (65.7% of chromophobe RCC samples and 67.3% of oncocytoma samples) ().
Figure 3. Methylation profiles of chromophobe RCC and renal oncocytoma samples. (A) Global methylation profile was mapped in relation to the 4 normal kidney samples included on the array. Differentially methylated loci were deemed to be all cancer-specific loci showing hyper- or hypo-methylation (1.2% or 4,439 loci for chromophobe samples and 0.6% or 2,383 loci for oncocytoma samples). All other loci not fulfilling this criterion where deemed to be equally methylated to the normal. (B) Methylation profile of cancer-specific loci identified as either hypermethylated (β value > 0.5) or hypomethylated (β value < 0.25) in > 30% of chromophobe RCC and > 30% renal oncocytoma samples. The majority of loci showed hypomethylation in both histologies with less than 10% of cancer-specific probes being hypermethylated. (C) Genomic distribution of cancer-specific hyper- and hypo-methylated CpG loci in relation to their location within known genes. The promoter region indicates loci residing within the 1st exon, 5′UTR, TSS200 and TSS1500 of known genes. CpG distribution did not differ between the two histologies, or between the profiles of hypermethylated and hypomethylated loci. (D) Genomic distribution of cancer-specific hyper- and hypo-methylated CpG loci in relation to CpG density. The majority of hypermethylated loci are shown to reside in areas of high CpG density (CpG islands, north and south shores and north and south shelves): 79.1% for chromophobe samples and 76.0% for oncocytoma samples. Cancer-specific hypomethylated loci are mostly located in isolated/low-density CpG regions known as open sea (65.7% for chromophobe samples and 67.3% for oncocytoma samples).
Hypermethylation profile analysis of chromophobe RCC and renal oncocytoma samples
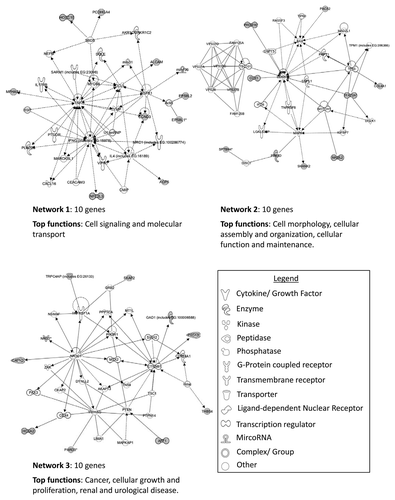
Within hypermethylated genes, only 17.5% (48 genes, 53 loci) were identified as methylated in both histologies. From literature searches, only a very small percentage of these genes (2.53% or 7 genes: PCDH17, ASCL2, NKX6-2, HOXA9, PITX2, TLX3 and ZNF177) hypermethylated in either histology, had previously been reported as methylated in any type of renal cancer. Ingenuity pathway analysis (IPA) was conducted to identify interactions and networks among hypermethylated genes. The top three networks identified for genes methylated in > 30% of chromophobe samples included 13 genes associated with embryonic development, tissue development and tissue morphology, 12 genes associated with cell signaling, molecular transport and vitamin and mineral metabolism and 11 genes related to cell death and survival, cell cycle and cancer (). The top three networks for methylated genes in oncocytoma samples identified the following key functions: cell signaling and molecular transport (10 genes); cell morphology, cellular assembly and organization, cellular function and maintenance (10 genes) and cancer, cellular growth and proliferation and renal and urological disease (10 genes) ().
Figure 4. Top three networks identified by Ingenuity associated functional network analysis of genes hypermethylated in > 30% of chromophobe RCC samples. Methylated genes are shown in gray and connecting genes in white. Solid arrows represent direct interaction, dashed arrows highlight indirect interactions, solid joining lines identify protein binding only. IPA analysis identified several key networks with the top three showing interactions and involvement in embryonic development, tissue development and morphology, cell signaling, molecular transport, vitamin and mineral metabolism, cell death and survival, cell cycle and cancer.
Figure 5. Top three networks identified by Ingenuity associated functional network analysis of genes hypermethylated in > 30% of renal oncocytoma samples. Methylated genes are shown in gray and connecting genes are in white. Solid arrows represent direct interaction, dashed arrows highlight indirect interactions, solid joining lines identify protein binding only. IPA analysis identified networks with involvement in cell signaling and molecular transport, cell morphology, cellular assembly and organization, cellular function and maintenance, cancer, cellular growth and proliferation, and renal and urological disease.
Differentially hypermethylated loci between chromophobe RCC and renal oncocytoma samples
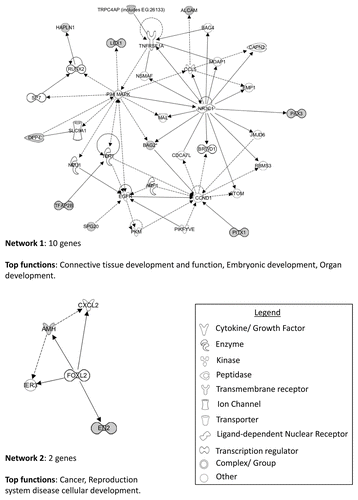
A gene list of differentially hypermethylated loci between chromophobe RCC and renal oncocytoma samples was compiled by selecting CpG loci that were hypermethylated (β value > 0.5) in > 30% of the samples of one tumor type and had a β value < 0.3 in 90% of the samples of the other tumor. Student’s t-test with FDR (false discovery rate) correction identified 30 genes (28 chromophobe-specific genes and 2 oncocytoma-specific genes) that showed significant differential methylation between the two types of RCC (p < 0.05) (). We confirmed the methylation status for two of the above genes (NPHP4 and SPG20) by cloning and sequencing of bisulfite modified DNA (). All except one of the differentially methylated CpG loci resided in CGIs or shores, the remaining locus resided in a shelf. Twelve of the differentially hypermethylated CpG loci were associated with gene promoter CGIs or shores. DAVID and Panther analysis identified several genes to be involved in the Wnt signaling pathway (EN2 and HOXC4), MAPK signaling pathway (CACNG7), Hippo pathway (NPHP4), TGFβ signaling pathway (AMH), cell death and apoptosis (SPG20, NKX6-2, PAX3, BAG2), as well as other functions such as cell cycle, cell migration and cell adhesion. Ingenuity pathway analysis (IPA) of the genes showing significant differential methylation identified several key networks with interactions in different pathways, including connective tissue development and function, embryonic and organ development, cancer, reproductive system disease and cellular development ().
Table 1. Differentially hypermethylated genes between chromophobe RCC and renal oncocytoma samples
Figure 6. Validation of loci β values using bisulfite clone sequencing of NPHP4 and SPG20 genes. (A) Schematic overview of the NPHP4 gene (black boxes represent exons, black lines represent introns and gray boxes represent CpG islands). Black line below CpG island represents region interrogated by primers for bisulfite sequencing including differentially methylated CpG locus (black dash). The differentially methylated CpG resides in a CpG island within 200 bp of the TSS of the gene. (B) Schematic overview of the SPG20 gene. The differentially methylated CpG resides in a north shore in the 5′UTR region of the gene. Bisulfite sequencing rows represent individual alleles, with each circle indicating location and methylation state of a CpG locus (black circle: methylated; white circle: unmethylated). Black arrowheads point to the CpG loci identified on the 450K array as showing significant differential methylation. Bisulfite sequencing of chromophobe RCC and renal oncocytoma samples confirm that the CpG loci in NPHP4 and SPG20 are hypermethylated in chromophobe RCC samples and unmethylated in renal oncocytoma samples.
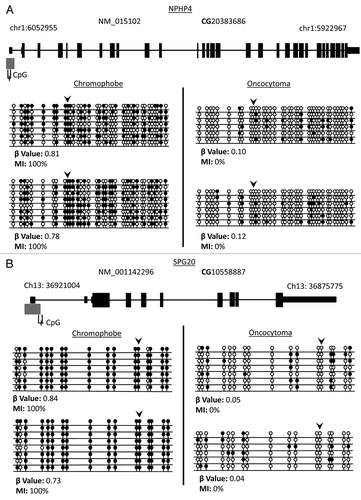
Figure 7. IPA network analysis of genes showing significant differential methylation between chromophobe RCC and renal oncocytoma samples. Top two networks and the interactions between methylated genes (in gray) and connecting genes (in white). Solid arrows represent direct interactions, dashed arrows highlight indirect interactions and solid joining lines identify protein binding.
To further investigate chromophobe-specific hypermethylation, the 28 genes differentially methylated in chromophobe RCC samples vs. renal oncocytoma samples were compared with The Cancer Genome Atlas (TCGA) data for ccRCC (n = 100) and papillary renal cell carcinoma (n = 81). One-way ANOVA with Games-Howell post hoc test for unequal sample sizes identified significant chromophobe-specific hypermethylation in three genes: SPG20, NPHP4 and TFAP2B ().
Figure 8. Identification of histologic-specific differential methylation. Genes identified as differentially methylated between oncocytoma and chromophobe samples were compared with the β values for ccRCC and papillary RCC from the TCGA data using one-way ANOVA with Games-Howell post hoc test. (A) Three genes were identified as significantly methylated in chromophobe RCC samples compared with the other histologies. Box plots with whiskers display the median ± maximum and minimum values for each histology. (B) Differentially methylated genes in renal oncocytoma identified two genes. One of them, HOXA9, identified as significantly hypomethylated compared with the other histologies. p values: * > 0.05, ** > 0.01, *** > 0.001
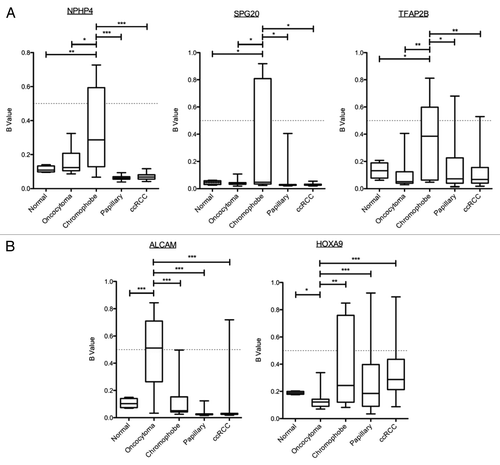
The same criterion was applied to investigate oncocytoma-specific hypermethylation in two differentially methylated loci. Post hoc analysis identified one locus (ALCAM) to be differentially hypermethylated in oncocytoma samples. Interestingly, the other gene, HOXA9, which was initially included due to being significantly methylated in chromophobe samples, has been identified instead as being unmethylated in oncocytoma, while showing significantly higher levels of methylation in all other histologies of renal carcinoma ().
Hypomethylation profile analysis of chromophobe RCC and renal oncocytoma samples
Profiling was then conducted on gene-associated loci identified as hypomethylated in > 30% chromophobe and oncocytoma samples. A total of 2,134 genes (4,023 loci) and 1,239 genes (2,258 loci) were identified to be hypomethylated in chromophobe and oncocytoma samples, respectively. Of these genes, 27.9% (943 genes, 1,543 loci) were identified to be hypomethylated in both histologies. IPA analysis for each histology identified association with many networks, with the top three networks for each histology displayed in Figures S4 and S5. The top three networks identified by IPA for chromophobe have functions involved in cell to cell signaling, hereditary disorders, neurological diseases, post-translational modifications, tissue morphology, cancer and gastrointestinal diseases (Fig. S4). On the other hand, the top three IPA networks for oncocytoma have been associated with functions in hereditary disorder, neurological disease, skeletal and muscular disorders, cancer, cellular development, cellular function and maintenance, embryonic development, lymphoid tissue structure and development, and organ development (Fig. S5).
Differentially hypermethylated loci between chromophobe RCC and renal oncocytoma samples
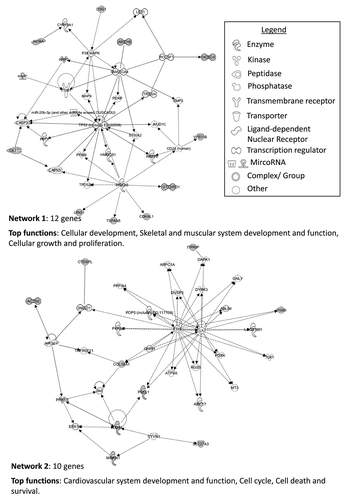
Differentially hypomethylated genes between chromophobe and oncocytoma samples were identified as having a β value < 0.25 in > 30% of the samples in one histology and a β value > 0.45 in 100% of the samples of the other histology. Student’s t-test with FDR correction identified 43 loci (41 genes: 5 genes in oncocytoma and 36 genes in chromophobe samples) differentially hypomethylated (). Further IPA analysis of the genes showing significant differential hypomethylation between chromophobe RCC and renal oncocytoma samples identified associations with several functions, including cardiovascular system development and function, cell cycle, cell death and survival, cellular development, skeletal and muscular system development and function, and cellular growth and proliferation ().
Table 2. Differentially hypomethylated genes between chromophobe RCC and renal oncocytoma samples
Figure 9. IPA network analysis of genes showing significant differential hypomethylation between chromophobe RCC and renal oncocytoma samples. Top two networks and the interactions between hypomethylated genes (gray) and connecting genes (white). Solid arrows represent direct interaction, dashed arrows highlight indirect interactions and solid joining lines identify protein binding. Associated functions include cardiovascular system development and function, cell cycle, cell death and survival, cellular development, skeletal and muscular system development and function, and cellular growth and proliferation.
Discussion
Chromophobe RCC and renal oncocytoma are thought to arise from distal renal tubules. Chromophobe RCCs have better prognosis than ccRCC or papillary RCC, with fewer than 5% of the cases being metastatic at the time of diagnosis, while renal oncocytomas are benign tumors morphologically similar to chromophobe RCC.Citation1 Hence, differential diagnosis of these two types of renal tumors is of paramount importance in determining the clinical course of treatment. Chromosomal abnormalities, gene expression and miRNA profiles have been used to try to distinguish between renal oncocytomas and chromophobe RCCs. Renal oncocytomas, as expected of a benign tumor, show a limited number of chromosomal abnormalities, including loss of chromosomes 1 and Y. On the other hand, frequent losses of chromosomes 1, 2, 6, 10 and 17 have been identified in chromophobe RCC. Loss of chromosomes 2, 10, 13, 17 and 21 are also reported to discriminate between chromophobe RCC and renal oncocytomas.Citation18 Using a combination of gene expression and high throughput SNP platforms, Tan et al. generated a probe signature that could discriminate chromophobe RCC and renal oncocytomas.Citation19 Petillo et al. identified a unique miRNA signature for clear cell, papillary, chromophobe RCC and renal oncocytoma.Citation20
There is growing evidence that not only genetic but also epigenetic changes play important roles in human malignancy. Aberrant DNA methylation leading to alterations in normal gene regulation was one of the first epigenetic marks to be associated with cancer development and has been recognized for over 20 years. DNA hypomethylation associated with loss of DNA methylation occurs in many gene poor regions, including introns, repetitive sequences and retrotransposons, and results in chromosomal instability. DNA hypermethylation associated with gain of methylation in promoter CGIs silences tumor suppressor genes. A more recent study has identified that the majority of DNA methylation changes involved in regulation of gene expression are located at CpG shores, located up to 2 kb distant from CGIs.Citation21
Previously, our laboratory and others have used the Illumina Goldengate methylation BeadChips (containing 1,505 CpG sites in 807 genes) to identify methylated TSGs in RCC.Citation22 More recently, we have identified novel methylated TSGs in RCC by using the much more comprehensive Illumina HumanMethylation27 BeadChips, which interrogate approximately 27,500 CpG in > 14,000 genes.Citation16 The above studies analyzed the more frequently occurring histological RCCs, namely ccRCC and papillary RCC, while there is very little knowledge regarding the epigenome of less frequently occurring histological subtypes of RCC. Hence, we have used the most comprehensive high density HumanMethylation450 BeadChips (> 480,000 CpG dinucleotides in > 20,600 genes) to elucidate the epigenome of the more rare and less malignant types of RCC, namely chromophobe RCC and renal oncocytomas. Our previous analysis using the Goldengate methylation arrays showed that papillary RCC had much higher numbers of methylated loci compared with ccRCC, irrespective of the VHL status of the ccRCC.Citation22 In the present study, we demonstrate that malignant chromophobe RCCs show higher percentage of cancer-specific hypermethylated loci, compared with the benign renal oncocytomas, although both entities demonstrate a much larger number of hypomethylated loci compared with hypermethylated loci. Only a minority of the genes frequently hypermethylated in chromophobe RCC and renal oncocytoma samples have been previously shown to be frequently methylated in RCC (< 3%).
Among the 30 CpG loci showing significant differential hypermethylation between chromophobe RCC and renal oncocytoma samples, 12 CpG loci were associated with gene promoter CGIs or shores, hence likely to influence gene regulation (11 in chromophobe RCC and 1 in renal oncocytoma samples). Furthermore, 5 of the 11 differentially hypermethylated loci associated with gene promoter CGIs or shores in RCC reside on chromosomes that are frequently lost from the genomes of ccRCC and are associated with downregulation of gene expression,Citation18 constituting classical hallmarks of TSG loci. Functional pathway analysis showed that, among the differentially methylated genes, some were involved in key signaling pathways, including Wnt, MAPK, TGFβ, Hippo pathway and cell death and apoptosis. While 71% of differentially hypomethylated loci between chromophobe RCC and renal oncocytoma samples resided in isolated CpGs (open sea), 10 of the 37 differentially hypomethylated loci in chromophobe RCC resided on chromosomes that showed chromosomal gains in this tumor type.
In addition, we utilized TCGA data on ccRCC and papillary RCC to determine if any of the differentially hypermethylated genes remained significant when considering all four types of histological RCC. This analysis yielded three genes (SPG20, NPHP4 and TFAP2B) that remained differentially hypermethylated in chromophobe RCC compared with ccRCC, papillary RCC and renal oncocytoma. Similar analysis yielded one gene (ALCAM) that showed differential hypermethylation in renal oncocytoma when comparing the four histological subtypes of RCC. The differentially methylated CpG loci in NPHP4 and SPG20 resided in gene promoter CGIs and shores, respectively. SPG20 promoter hypermethylation has recently been described as a biomarker for early detection of colorectal cancer and plays a role in cytokinesis arrest in cancer cells.Citation23 NPHP4 is a cilia-associated protein involved in Wnt and Hippo tumor suppressor networks.Citation24
The differentially methylated genes we have identified may provide clues into the biological differences among the RCC subtypes and the molecular pathways deregulated in subtype-specific contexts and may help identify DNA markers for classification of renal tumors. Further research to understand the pathways highlighted here may lead to potential new drug targets for the development of subtype-specific therapy as well as for differential diagnosis of renal cancer. Patients presenting advanced and metastatic clear cell renal cell carcinoma have more treatment options in part, due to type-specific therapies that been developed for ccRCC.Citation25 It is hoped that in the future targeted therapies will also be available for non-clear cell RCC.
Materials and Methods
HumanMethylation450 BeadChips
Four normal kidney, 21 sporadic oncocytoma and 20 sporadic chromophobe anonymized DNA samples were outsourced to Cambridge Genomics Services for bisulfite modification and array hybridization to Illumina HumanMethylation450 array. Normalized data was obtained using Genome Studio software from Illumina. Data was corrected for color bias using a modified pipeline for the 450K array (designed in R bioconductor package Lumi)Citation26 adapting a quantile approach originally employed for the Infinium HumanMethylation27 BeadChips. In brief, the two probe types (Infinium Type I and II) were separated and both color channels normalized via the aforementioned quantile approach to remove color bias by giving the two channels the same distribution within the same array. Data was then merged, and between-array normalization was then applied using a quantile approach. Average β scores were calculated for each probe using the formula provided by Illumina: β = M/(U + M + 100), where M is methylated intensity and U is the unmethylated intensity. All anonymized DNA samples were used with ethical approval following institutional guidelines.
Data processing
Data was processed to remove all unreliable probes identified by a detection p value of > 0.01. All probes expressed on X or Y chromosome were removed to avoid gender bias, followed by removal of SNP and known imprinted gene associated probes (Fig. S3). Hypermethylation was set at a β value greater than 0.5, while hypomethylation was set as β value lower than 0.25. Identification of cancer-specific hypermethylation and removal of background methylation was preformed by the removal of any probe with a β value > 0.25 in any of the four normal samples. The reverse criterion was applied to identify hypomethylation.
Differential methylation analysis
Differential analysis was conducted by establishing as differentially hypermethylated those loci presenting a β value > 0.5 in > 30% of the samples of one histology and a β value < 0.30 in > 90% of the samples in the other histology. Identification of differentially hypomethylated loci was done by selecting those loci presenting a β value < 0.25 in 30% of the samples of one histology and a β value > 0.45 in 100% of the cases of the other histology. Significant differential methylation between the two histologies was identified via a Student’s t-test followed by FDR correction.
TCGA data
Further evaluation of differential methylation in oncocytoma and chromophobe samples was conducted. Loci showing significant differential methylation between renal oncocytoma and chromophobe RCC samples were compared with the HumanMethylation450 array data for ccRCC and papillary RCC, publicly available from The Cancer Genome Atlas (TCGA) (Table S3). One hundred ccRCC samples randomly chosen via a random number generator and all 81 papillary samples were downloaded. One-way ANOVA with Games-Howell post hoc analysis (due to unequal sample sizes and variance) was performed to identify significant differential methylation between all four histological subtypes.
Statistical analyses
All statistical analyses and data processing were conducted using Microsoft Excel 2007, Graphpad prism 5.0 and SPSS v20. Significance was calculated with Student’s t-test with FDR correction or one-way ANOVA with Games-Howell post hoc test, when comparing more than three histologies.
Array validation
Validation of the array and confirmation of differential methylation was preformed via single colony sequencing. Primary DNA was bisulfite modified using Qiagen EpiTect Kit following manufacturer’s instructions. Prior to the PCR touchdown amplification of CpG loci of interest (primers were designed to flank CpG loci identified by the 450K array and are available upon request): 95°C for 5 min, 5 cycles of 95°C 45 sec, Ta +4°C 45 sec (decreasing one degree every cycle), 72°C for 45 sec, 35 cycles of 95°C 45 sec, Ta 45 sec, 72°C for 45 sec, with a final 72°C amplification of 10 min. PCR was run on a 2% agarose gel and the product excised and extracted using Qiagen gel extraction kit. Extracted DNA was ligated using Promega pGEM-T Easy vector system, prior to transfection into α-select silver efficiency chemically competent cells (Bioline). Transfected cells were plated on LB agar (plus 100 μg/ml ampicillin and 50 mg/ml X-gal) and grown at 37°C overnight. White colonies were selected and denatured at 95°C for 5 min. Single colony touchdown PCR was preformed to confirm transfection was successful, using primers for T7 and pGem. Successful PCR samples were cleaned via Exosap kit (Fermentas), and the sequencing reaction was conducted using Big Dye Terminator kit. DNA was cleaned and precipitated prior to sequencing on a 3,730 DNA analyzer (Applied Biosystems). DNA precipitation included precipitation with 1.5 M sodium acetate and EDTA, 95% ethanol and centrifuged for 20 min at 4,000 rpm. Followed by two cleaning spins with 70% ethanol, before samples were resuspended in 10 μl HiDi Formamide (Applied Biosystems) and denatured for 5 min and sequenced. All of the above kits were used in accordance with the manufacturer’s guidelines and instructions. Methylation was visualized via CpG viewer, and the Methylation Index (MI) (the percentage of methylation observed per gene) was calculated using the following formula: MI = (Number Methylated CpG loci/ Total number CpG loci) × 100.
Additional material
Download Zip (1.6 MB)Acknowledgments
A.S. was funded by the MRC. M.A. was funded by the King Saud University, Riyadh, Saudi Arabia.
Disclosure of Potential Conflicts of Interest
No potential conflicts of interest were disclosed.
Supplemental Materials
Supplemental materials may be found here: www.landesbioscience.com/journals/epigenetics/article/23817
References
- Kovacs G, Akhtar M, Beckwith BJ, Bugert P, Cooper CS, Delahunt B, et al. The Heidelberg classification of renal cell tumours. J Pathol 1997; 183:131 - 3; http://dx.doi.org/10.1002/(SICI)1096-9896(199710)183:2<131::AID-PATH931>3.0.CO;2-G; PMID: 9390023
- Maher ER. Genetics of familial renal cancers. Nephron Exp Nephrol 2011; 118:e21 - 6; http://dx.doi.org/10.1159/000320892; PMID: 21071978
- Linehan WM, Srinivasan R, Schmidt LS. The genetic basis of kidney cancer: a metabolic disease. Nat Rev Urol 2010; 7:277 - 85; http://dx.doi.org/10.1038/nrurol.2010.47; PMID: 20448661
- Latif F, Tory K, Gnarra J, Yao M, Duh FM, Orcutt ML, et al. Identification of the von Hippel-Lindau disease tumor suppressor gene. Science 1993; 260:1317 - 20; http://dx.doi.org/10.1126/science.8493574; PMID: 8493574
- Schmidt L, Duh FM, Chen F, Kishida T, Glenn G, Choyke P, et al. Germline and somatic mutations in the tyrosine kinase domain of the MET proto-oncogene in papillary renal carcinomas. Nat Genet 1997; 16:68 - 73; http://dx.doi.org/10.1038/ng0597-68; PMID: 9140397
- Tomlinson IP, Alam NA, Rowan AJ, Barclay E, Jaeger EE, Kelsell D, et al, Multiple Leiomyoma Consortium. Germline mutations in FH predispose to dominantly inherited uterine fibroids, skin leiomyomata and papillary renal cell cancer. Nat Genet 2002; 30:406 - 10; http://dx.doi.org/10.1038/ng849; PMID: 11865300
- Nickerson ML, Warren MB, Toro JR, Matrosova V, Glenn G, Turner ML, et al. Mutations in a novel gene lead to kidney tumors, lung wall defects, and benign tumors of the hair follicle in patients with the Birt-Hogg-Dubé syndrome. Cancer Cell 2002; 2:157 - 64; http://dx.doi.org/10.1016/S1535-6108(02)00104-6; PMID: 12204536
- Varela I, Tarpey P, Raine K, Huang D, Ong CK, Stephens P, et al. Exome sequencing identifies frequent mutation of the SWI/SNF complex gene PBRM1 in renal carcinoma. Nature 2011; 469:539 - 42; http://dx.doi.org/10.1038/nature09639; PMID: 21248752
- Dalgliesh GL, Furge K, Greenman C, Chen L, Bignell G, Butler A, et al. Systematic sequencing of renal carcinoma reveals inactivation of histone modifying genes. Nature 2010; 463:360 - 3; http://dx.doi.org/10.1038/nature08672; PMID: 20054297
- van Haaften G, Dalgliesh GL, Davies H, Chen L, Bignell G, Greenman C, et al. Somatic mutations of the histone H3K27 demethylase gene UTX in human cancer. Nat Genet 2009; 41:521 - 3; http://dx.doi.org/10.1038/ng.349; PMID: 19330029
- Dammann R, Li C, Yoon JH, Chin PL, Bates S, Pfeifer GP. Epigenetic inactivation of a RAS association domain family protein from the lung tumour suppressor locus 3p21.3. Nat Genet 2000; 25:315 - 9; http://dx.doi.org/10.1038/77083; PMID: 10888881
- Morrissey C, Martinez A, Zatyka M, Agathanggelou A, Honorio S, Astuti D, et al. Epigenetic inactivation of the RASSF1A 3p21.3 tumor suppressor gene in both clear cell and papillary renal cell carcinoma. Cancer Res 2001; 61:7277 - 81; PMID: 11585766
- Morris MR, Gentle D, Abdulrahman M, Maina EN, Gupta K, Banks RE, et al. Tumor suppressor activity and epigenetic inactivation of hepatocyte growth factor activator inhibitor type 2/SPINT2 in papillary and clear cell renal cell carcinoma. Cancer Res 2005; 65:4598 - 606; http://dx.doi.org/10.1158/0008-5472.CAN-04-3371; PMID: 15930277
- Morris MR, Maher ER. Epigenetics of renal cell carcinoma: the path towards new diagnostics and therapeutics. Genome Med 2010; 2:59; http://dx.doi.org/10.1186/gm180; PMID: 20815920
- Morris MR, Ricketts CJ, Gentle D, McRonald F, Carli N, Khalili H, et al. Genome-wide methylation analysis identifies epigenetically inactivated candidate tumour suppressor genes in renal cell carcinoma. Oncogene 2011; 30:1390 - 401; http://dx.doi.org/10.1038/onc.2010.525; PMID: 21132003
- Ricketts CJ, Morris MR, Gentle D, Brown M, Wake N, Woodward ER, et al. Genome-wide CpG island methylation analysis implicates novel genes in the pathogenesis of renal cell carcinoma. Epigenetics 2012; 7:278 - 90; http://dx.doi.org/10.4161/epi.7.3.19103; PMID: 22430804
- Sandoval J, Heyn H, Moran S, Serra-Musach J, Pujana MA, Bibikova M, et al. Validation of a DNA methylation microarray for 450,000 CpG sites in the human genome. Epigenetics 2011; 6:692 - 702; http://dx.doi.org/10.4161/epi.6.6.16196; PMID: 21593595
- Yusenko MV, Kuiper RP, Boethe T, Ljungberg B, van Kessel AG, Kovacs G. High-resolution DNA copy number and gene expression analyses distinguish chromophobe renal cell carcinomas and renal oncocytomas. BMC Cancer 2009; 9:152; http://dx.doi.org/10.1186/1471-2407-9-152; PMID: 19445733
- Tan MH, Wong CF, Tan HL, Yang XJ, Ditlev J, Matsuda D, et al. Genomic expression and single-nucleotide polymorphism profiling discriminates chromophobe renal cell carcinoma and oncocytoma. BMC Cancer 2010; 10:196; http://dx.doi.org/10.1186/1471-2407-10-196; PMID: 20462447
- Petillo D, Kort EJ, Anema J, Furge KA, Yang XJ, Teh BT. MicroRNA profiling of human kidney cancer subtypes. Int J Oncol 2009; 35:109 - 14; http://dx.doi.org/10.3892/ijo_00000318; PMID: 19513557
- Irizarry RA, Ladd-Acosta C, Wen B, Wu Z, Montano C, Onyango P, et al. The human colon cancer methylome shows similar hypo- and hypermethylation at conserved tissue-specific CpG island shores. Nat Genet 2009; 41:178 - 86; http://dx.doi.org/10.1038/ng.298; PMID: 19151715
- McRonald FE, Morris MR, Gentle D, Winchester L, Baban D, Ragoussis J, et al. CpG methylation profiling in VHL related and VHL unrelated renal cell carcinoma. Mol Cancer 2009; 8:31; http://dx.doi.org/10.1186/1476-4598-8-31; PMID: 19493342
- Lind GE, Raiborg C, Danielsen SA, Rognum TO, Thiis-Evensen E, Hoff G, et al. SPG20, a novel biomarker for early detection of colorectal cancer, encodes a regulator of cytokinesis. Oncogene 2011; 30:3967 - 78; http://dx.doi.org/10.1038/onc.2011.109; PMID: 21499309
- Habbig S, Bartram MP, Müller RU, Schwarz R, Andriopoulos N, Chen S, et al. NPHP4, a cilia-associated protein, negatively regulates the Hippo pathway. J Cell Biol 2011; 193:633 - 42; http://dx.doi.org/10.1083/jcb.201009069; PMID: 21555462
- Sun M, Lughezzani G, Perrotte P, Karakiewicz PI. Treatment of metastatic renal cell carcinoma. Nat Rev Urol 2010; 7:327 - 38; http://dx.doi.org/10.1038/nrurol.2010.57; PMID: 20458330
- Du P, Kibbe WA, Lin SM. lumi: a pipeline for processing Illumina microarray. Bioinformatics 2008; 24:1547 - 8; http://dx.doi.org/10.1093/bioinformatics/btn224; PMID: 18467348