Abstract
The use of next generation sequencing has expanded our view on whole mammalian methylome patterns. In particular, it provides a genome-wide insight of local DNA methylation diversity at single nucleotide level and enables the examination of single chromosome sequence sections at a sufficient statistical power. We describe a bisulfite-based sequence profiling pipeline, Bi-PROF, which is based on the 454 GS-FLX Titanium technology that allows to obtain up to one million sequence stretches at single base pair resolution without laborious subcloning. To illustrate the performance of the experimental workflow connected to a bioinformatics program pipeline (BiQ Analyzer HT) we present a test analysis set of 68 different epigenetic marker regions (amplicons) in five individual patient-derived xenograft tissue samples of colorectal cancer and one healthy colon epithelium sample as a control. After the 454 GS-FLX Titanium run, sequence read processing and sample decoding, the obtained alignments are quality controlled and statistically evaluated. Comprehensive methylation pattern interpretation (profiling) assessed by analyzing 102-104 sequence reads per amplicon allows an unprecedented deep view on pattern formation and methylation marker heterogeneity in tissues concerned by complex diseases like cancer.
Introduction
DNA methylation is a robust epigenetic feature that can be studied at single base pair resolution. Changes in DNA methylation are frequently observed in cells and tissues in the context of development and disease. Due to the advent of Next Generation Sequencing (NGS) technologies, the generation of genome-wide methylation maps is becoming routine. Such comprehensive methylomes can be produced by various methods including enrichment technologies to capture methyl-cytosine by antibody or protein binding or by chemical conversion of unmethylated cytosines to uracils using, e.g., sodium bisulfite, which remains the current gold standard methodology for DNA methylation mapping.Citation1-Citation3 While all these techniques provide a comprehensive genome-wide overview, the precise local chromosomal distribution of CpG methylation, particularly in putative regulatory elements, is usually not obtained at sufficient resolution and quality. Particularly, questions related to complex local pattern formation along various CpGs and on individual DNA molecules may provide additional information, e.g., on allele-specific association or cellular heterogeneity in the samples. Recent publications elucidated branched intra-tumor evolution with acquisition of novel mutations.Citation4 This microevolution is likely to affect the epigenetic state of sub-populations within a single primary tumor or within different metastasis. However, until now, only very few reports have been published that elucidated the epigenetic heterogeneity within a tumor or within different tumor samples of individuals. Such information can be obtained by comprehensive local PCR-based bisulfite sequencing approaches for which we developed an NGS-linked multiplexed workflow. Our Bisulfite profiling (Bi-PROF) pipeline encompasses the generation of amplicons from bisulfite-treated DNA, which are sequenced in a multiplexed, deep (102- to 104-fold) manner allowing simultaneous characterization of multiple chromosomal positions with unprecedented accuracy and precision at single CpG resolution. Compared with previous work using predecessors like the 454 GS20 or the GS-FLX systems,Citation5 we provide a complete analysis package that allows to generate and evaluate longer bisulfite-sequence stretches of up to 500 bp by conducting higher nucleotide flow cycles (up to 800 cycles vs. 400 cycles in GS FLX and 168 in GS20). After describing our analysis package consisting of the experimental workflow and the bioinformatics program pipeline (BiQ Analyzer HT),Citation6 we document the excellent performance of the 454 GS-FLX Titanium-based approach on a set of 68 candidate regions in patient-derived colorectal cancer (CRC) xenografts and normal colon epithelium.
Results and Discussion
Bisulfite treatment and amplicon generation
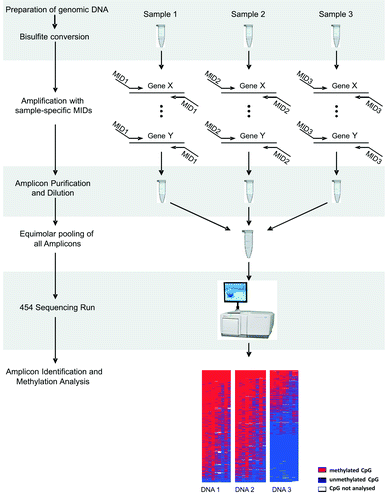
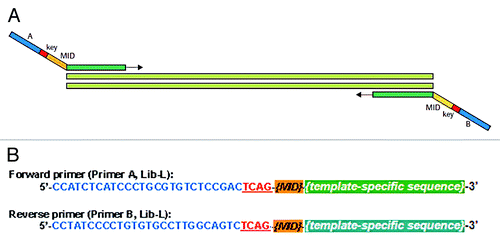
The experimental workflow is outlined in . After preparation of high-molecular weight genomic DNA, 300–500 ng are subjected to bisulfite treatment using commercially available kits that approximate full conversion of unmethylated cytosines (calculated by BiQ Analyzer HT during sequence read assessment). For subsequent amplification, fusion primers are used to incorporate sequencing adaptors into the PCR products providing templates that are adapted for further processing. 55–65 bp long fusion primers consist of a unique amplicon-specific part fused to a 5′-tail (35 bp) comprising sequences necessary for emulsion PCR (emPCR)-based amplification and sequencing reactions using the GS-FLX Titanium chemistry (). The 3′-locus-specific portion of the fusion primer has to be properly designed to achieve high amplification efficiencies, especially when bisulfite-treated template DNA is used. We suggest the following general rules for fusion primer design: (1) the locus-specific portion should be 22 to 28 bp long, (2) CpG positions within the oligo sequence are prohibited and (3) it should be devoid of longer T- or A-stretches. In case only CpG methylation is analyzed, the oligonucleotide should contain at least 4 thymine residues that represent cytosine residues before bisulfite conversion. We recommend generating amplicons in the range between 250 to 500 bp (including adaptors) because longer DNA fragments are often not successfully amplified or not entirely sequenced. Generating multiple PCR products per reaction may save time and effort. However, it should be noted that an imbalance of individual products that are over- or under-represented after PCR might lead to biased sequencing results. If more than one sample is analyzed per GS-FLX Titanium lane, a 10 bp sample-specific tag, called multiplex identifier (MID), should be added to the 3′-end of the sequencing adaptor sequence of the forward and reverse primers (). An extended set of > 150 MID sequences is available from the my454 web portal (www.454.com). It is important to note that the MID list provided is computationally designed but not experimentally tested. Good PCR primer design practices and empirical testing should be used to minimize the likelihood of spurious interactions between locus-specific sequences, MIDs, and sequencing adaptors.
Figure 1. Schematic experimental workflow Bi-PROF. As an example we show the generation of a set of amplicons for 3 different sample DNAs. Amplicons are generated with DNA sample-specific tags (so called MIDs). The sample and amplicon complexity can be expanded–we have successfully tested up to 60 MIDs. After dilution and size-adjusted pooling, amplicons are subjected to emulsion-PCR and pyrosequencing. Obtained reads are filtered and sorted according to their MID and the reference sequence. Alignments and visualizations are subsequently performed using the freely available software BiQ Analyzer HT (http://biq-analyzer-ht.bioinf.mpi-inf.mpg.de/).

Figure 2. Schematic representation of the fusion primer design used for amplification. (A) fusion primers consist of a universal 5′-tail and a template-specific portion targeting distinct bisulfite DNA sequences; (B) universal 5′-tail sequences (when using Lib-L emPCR chemistry) including the emPCR primer and sequencing primer target sites (blue), the key important for GS-FLX Titanium read identification (red) and 10 bp MID (list more than 150 different MIDs is provided by Roche on the my454 web portal (www.454.com)).

Amplicons are generated in a 30 µl reaction volume using Hot Start Polymerases. We highly recommend using HotStarTaq (Qiagen) or HotFirePol (Solis BioDyne), which showed similarly good performances in our experiments. If amplification efficiency suffers from primer dimers, 2 µg HotStart-IT Binding Protein (Affymetrix) can be added to the PCR reaction to sequester primers prior to PCR. Adding 1.25 M Betaine to each reaction may be beneficial for challenging templates, particularly when amplifying high G+C and/or CpG target regions. Although a standard PCR reaction with a primer annealing temperature of 54°C works efficiently for most target regions, optimization may be necessary. An aliquot of the resulting PCR should be subjected to gel electrophoresis to check for successful and specific amplification.
Amplicon purification, dilution and pooling
Even small amounts of primer dimers may significantly deteriorate sequencing performance, therefore PCR reactions should be optimized and PCR products need to be purified prior to sequencing by agarose gel separation and extraction or by following the protocols outlined in TCB No 2011–007 available from the my454 customer web portal. To avoid cross contamination, we recommend using separate agarose gels for each sequencing lane, especially when a single amplicon is being sequenced across multiple samples. For purification, commercially available glass milk-based kits or filter units can be used. To improve time-efficiency the usage of Agencourt® AMPure XP beads in a 96-well format can be beneficial as long as primer dimers are entirely removed. We want to emphasize that the eluted PCR product has to be completely free of ethanol, since traces of ethanol may influence subsequent reactions. Successful purification is recommended to be analyzed by gel electrophoresis of a 3 µl aliquot on a 1.2% agarose gel, and PCR products should be quantified using fluorometric methods since photometry is likely not sufficient for this application. For equimolar pooling, PCR products are diluted to 1x10⁹ molecules/µl using 1xTE. All amplicons dedicated to one sequencing lane are pooled and subjected to emPCR and processed further for sequencing using the manufacturer’s protocols.
Titration and sequencing
The optimal enrichment of DNA-containing beads (8–12%) is achieved when using between 2 and 10 copies per bead of input DNA, suggesting titration steps of 2, 4 and 8 copies-per-beads. Importantly, we observed disequilibrium between different amplicon sizes after several 454 runs. As short PCR target regions typically have higher amplification efficiencies than longer ones, we prefer to pool PCR products of similar size and perform separate emPCR reactions for length-adapted pools. This procedure can be avoided by designing primers in a way that the size difference of less than ~150 bp between the various amplicons within a pool is maintained. Further suggestions for optimization are also given by the “454 Sequencing Systems Guidelines for Amplicon Experimental Design” on the my454 web portal.
Both Lib-A and Lib-L sequencing methods are appropriate for Bi-PROF. However, we suggest using the more flexible “One-Way Reads” method utilizing the Lib-L adaptors, since shot-gun libraries and amplicon libraries, when loaded in different lanes, can be sequenced on the same sequencing plate.
Data evaluation
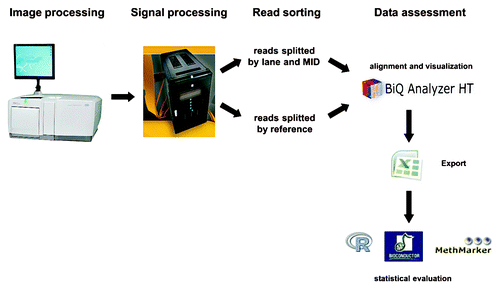
Primary data output of the sequencer is a collection of raster images–one per each residue flow of the sequencing cycle. The data evaluation pipeline is schematically shown in . For the image and signal processing (base calling) steps, we recommend embarking upon the gsRunProcessor software provided by Roche. However, the yield of reads passing the data processing steps could be improved by modifying the values of several gsRunProcessor options to better fit peculiarities of the bisulfite sequencing, e.g., disabling of the global droop corrector. Shotgun processing and amplicon processing pipelines reach similar quality, despite a slightly reduced quantity of processed reads when using the more stringent amplicon pipeline. After processing, the sequence data are exported in SFF format–one SFF file per sequenced lane. Our in-house web-interface, powered by the Roche SFF-tools, uses amplicon-specific primer sequences as tags to extract the sequence reads and allocates them to the respective amplicons. Interactive quality control, filtering, summarization and visual representation of the DNA methylation data are done with the aid of BiQ Analyzer HT software, specifically developed for this task.Citation5 This tool provides refined methylation information in tabular format and publication-quality graphics. Exported files are provided in a format compatible with popular software for further statistical analysis, like Microsoft Excel or R/Bioconductor packages (www.bioconductor.org).Citation7
Figure 3. Schematic workflow of data evaluation. After generation of raw images data are processed by filtering reads that are either too short or could not be unambiguously sequenced (e.g., two different sequence reads per well). Processed reads are sorted by MID, sequencing lane and reference and uploaded into the BiQ Analyzer HT program.Citation5 DNA methylation patterns are assessed and visualized. Exported files serve as templates for R-based statistics or other further evaluation programs like MethMarker or Bioconductor software packages (www.bioconductor.org).Citation7

Bi-PROF of five CRC patient-derived xenografts
To demonstrate our streamlined protocol for deep sequencing of bisulfite treated DNA, we chose to analyze 67 single-copy loci and the promoter of repetitive LINE-1 elements in xenograft tissues derived from the primary tumors of five CRC patients, along with sampled DNA from a healthy colon epithelium. The biological advantages to study tumor-derived xenografts instead of cell lines are nativeness and their cancer-related epigenetic plasticity. Cancer cell lines that often are already cultured for decades rather acquire an unpredictable epigenetic patterning caused by long-term culturing. The loci, mostly situated within promoter CpG islands, were previously shown to be either hypermethylated or lower expressed in CRC tumors or cell lines (see Table S1). To prove amplification linearity of methylated and unmethylated sequences, which might be an issue especially for longer PCR products, we included a 407 bp (including adapters) amplicon containing the sixth CTCF binding site of the H19 DMR (H19CTCF6). This locus is known to be allele-specifically methylated (50:50 ratio) in normal epithelial cells.
After primer design and PCR, amplicons were grouped into three different size fractions, pooled, clonally amplified via emulsion PCR and finally subjected to 454 GS-FLX Titanium pyrosequencing for a targeted yield of 500 reads per amplicon in five physically separated picotiter plate lanes. All data can be downloaded as BiQ Analyzer HT project files under ftp://public.genetik.uni-sb.de/public/data_BiProf/.
In general, the sequencing run yielded more than 230.000 filtered, quality controlled reads, leading to an average of about 530 reads per amplicon, obtaining the farmost lowest yield from the normal colon epithelium sample (208.5 reads in average only, ). This effect is probably due to the limited primary sample material illustrating again the advantage of using xenograft models. The mean methylation across the amplicons, although heterogeneous between the xenografts, shows significantly higher methylation in tumors compared with the healthy colon epithelium. The low average standard deviation (< 10%) points to most of the sequence reads within the same sample showing similar absolute methylation. Taken together all amplicons in the same sample, bisulfite conversion rates amount to approx. 97%. Going deeper into sequence alignments, distinct read- or CpG dinucleotide-specific methylation patterns can be assessed. Amplification and sequencing of the allele-specifically methylated H19CTCF6 amplicon in healthy colon epithelium approximates linearity reassuring that possible amplification/sequencing biases are small and may not heavily influence pattern interpretation. The amount of analyzed reads and their sequence diversity, in particular at the CpG positions, points to the problem of sequencing PCR chimeras to be marginal. Three typical examples of obtained methylation patterns are shown in .
Table 1. Statistical results of the obtained data after 454 GS-FLX Titanium sequencing. Listed are average numbers and percentages per sample over all analyzed amplicons
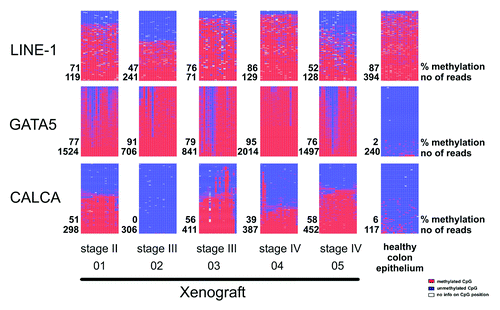
Figure 4. Methylation pattern maps for the amplicons of LINE-1, GATA5 and CALCA promoters. Methylation pattern maps of LINE-1 (top) and GATA5 (middle) and CALCA (bottom) promoter amplicons are shown for the five analyzed patient-derived xenograft tissues and normal colon epithelium. Every line represents the local methylation on a single allele, every column represents a CpG position within the analyzed region. Colors indicate no methylation (blue), full methylation (red) and not analyzed CpG positions (white).

All analyzed amplicons are located in the promoter regions showing altered DNA methylation in numerous colorectal cancer tumors. The exact genomic positions and citations are given in Tables S1 and S2. A typical pattern was observed for the consensus sequence of the promoter region of LINE-1 elements (, top). Here, both methylated and unmethylated CpG positions were present in a mosaic fashion with no sign of focal preference for either state. A more interesting output of the LINE-1 amplicon is in fact the average methylation, which can provide a measure for the rate of global (hypo)methylation in a given sample (further information on this topic is described in Yang et al., 2004Citation8). In the case of the GATA5 promoter amplicon (, middle), which interrogates the methylation state of 19 CpGs within the promoter region, we found CpG positions four to 11 to be less prone to a gain of methylation in CRC patient-derived xenografts. Due to the limited number of analyzed samples, this pattern may not reflect the tumor stage per se, but should rather be regarded as a sample-specific effect. Methylation patterns can also differ based on the interrogated chromosome rather than specific CpG positions (CALCA promoter, , bottom). In contrast to the GATA5 promoter, this observation hints to the existence of distinct subpopulations with a quite sharp division into either fully methylated or unmethylated sequence reads. As we can rule out contamination of the PCR products with amplificates from mouse stroma (due to the specificity of the PCR primers used), these subpopulations must stem from the human tumor tissue itself.
Concluding remarks
We present a workflow and detailed protocol including sequence and data analysis that allows high-resolution bisulfite sequencing of individual target regions using the 454 GS-FLX Titanium system. As shown previously, older 454 developments already allow sequencing of more than 1.000 different bisulfite-amplicons in a single run.Citation6 The advantageous feature of the 454 GS-FLX Titanium system is the improved read length (up to 500 bp for bisulfite-amplicons). Further increase of read lengths may be desired but might be limited by DNA degradation induced by the bisulfite conversion. In the experimental sections, we provide experimental details and recommendations, which are of high importance to reach optimal performance. The combination of the sequencing run with a bioinformatics pipeline complements the analysis package by facilitating alignment generation and interpretation. Result tables are exportable from the program allowing easy statistical evaluation of the sequence data for ultimate biological interpretation. To our experience, coverage rates of approximately 500–1,000 reads per amplicon provide sufficient depth to obtain a comprehensive pattern distribution for statistical and biological evaluation. While the entire procedure still requires some manual work and expertise, the results obtained are of unique and extreme quality allowing unprecedented insights into the distribution of CpG and non-CpG methylation, and links to allelic variation in individual chromosomes. We have successfully applied the workflow above in studies to investigate DNA methylation in the context of cellular heterogeneity e.g., in cancer, DNA methylation reprogramming during early embryo development and for DNA extracted from complex cell pools.
The challenging subject of heterogeneous cell populations, for example in biopsied primary tumors or metastases, can be addressed with this method by increasing the number and length of target reads even further. To this date, there is no other technology available which can provide a comparable level of precision in bisulfite-based methylation analysis for a given genomic region spanning up to 500 bp in length with a single PCR amplicon. Paired with our analysis pipeline, researchers gain access to intelligible data presentations and a tailored statistical evaluation.
Materials and Methods
Tissues from colorectal carcinomas were obtained from the Surgical Department of the Charité or the Robert-Rössle-Clinics Berlin-Buch. All tumors were collected after first obtaining informed patient consent and according to local research ethics and regulations.Citation9 In brief, fresh post-operative tumor tissue of five individual CRC patients was transplanted subcutaneously into immunodeficient mice and successively passaged with the aim of tissue material generation. Two of the xenografts were derived from stage III colorectal cancer tumors (xenograft 2 and 4), two samples of stage IV (xenograft 3 and 5) and one sample of stage II (xenograft 1) were also included in the cohort. Four of the xenograft tissue samples (xenografts 2–5) were from early passages (3 to 4) and one sample was from passage 11 (sample 1). Mice were sacrificed when the xenograft volume reached approximately 1 cm3, the tumors were harvested and immediately snap-frozen in liquid nitrogen.
Genomic DNA was extracted with the GenElute Mammalian Genomic DNA Miniprep kit (Sigma-Aldrich Chemie GmbH). 500 ng genomic DNA were treated with 2 M sodium bisulfite and 0.6 M NaOH. We applied 99°C for 5 min followed by two incubation steps of 1.5 h at 50°C. Purification was achieved by loading, desulfonation and washing on a microcon YM-30 column (Millipore). Bisulfite DNA was eluted in 50 μl 1xTE.
Amplicons are generated in separate reactions by adding 2 µl of bisulfite-treated DNA to 1 x HotStarTaq reaction buffer (contains 1.5 mM MgCl2), 0.2 mM of each dNTP, 200 nm each of the forward and reverse primers, and 1.5U HotStarTaq (Qiagen) in a total reaction volume of 30 µl. Alternatively, 3U HotFirePol (Solis BioDyne) with 1 x buffer B (80 mM Tris-HCL, 20 mM (NH4)2SO4, 0.2% Tween-20) and 2.5 mM MgCl2 was used. PCR reactions were performed in PCR strips starting with 15 min denaturation at 95°C followed by 42 cycles of 95°C for 60 sec, 54°C for 60 sec, 72°C for 90 sec and a final 10 min extension step at 72°C. PCR reactions later to be sequenced in the same picotiter plate lane were loaded on separate 1.2% agarose gels. Amplicons were separately cut from the gel and purified using the Gel/PCR DNA Fragments Extraction kit from Avegene. Two µl of purified PCR product were measured in the Qubit fluorometer (Invitrogen) and loaded on an agarose gel to check for successful purification.
Dilution, pooling and subsequent sequencing were performed according to 454 GS-FLX Titanium standard protocols provided by Roche. In brief, all amplicons were diluted to 109 molecules/µl and divided into a big (431–608 bp, including adapters)- and small (237–414 bp, including adapters)-sized subgroup to avoid amplicon size-dependent amplification bias. One big- and small-sized amplicon pool for each xenograft/healthy colon epithelium sample was subjected to separate amplification reactions using emPCR Lib-A chemistry (Roche). After beads containing amplified DNA were enriched and counted, big- and small-sized amplicon pools of each sample were merged and loaded onto one picotiter plate lane. Sequencing was performed using unidirectional sequencing with the sequencing primer binding to the universal A adaptor sequence.
Additional material
Download Zip (52 KB)Acknowledgments
We thank Roche Diagnostics and 454 Life Sciences for providing consumables and technical support. The project was supported by the Bundesministerium für Bildung und Forschung (ColoNet, grant no. 0315417A and D) and the EU (NOTOX, grant no. FP7 267038).
Disclosure of Potential Conflicts of Interest
No potential conflicts of interest were disclosed.
References
- Ruike Y, Imanaka Y, Sato F, Shimizu K, Tsujimoto G. Genome-wide analysis of aberrant methylation in human breast cancer cells using methyl-DNA immunoprecipitation combined with high-throughput sequencing. BMC Genomics 2010; 11:137; http://dx.doi.org/10.1186/1471-2164-11-137; PMID: 20181289
- Lan X, Adams C, Landers M, Dudas M, Krissinger D, Marnellos G, et al. High resolution detection and analysis of CpG dinucleotides methylation using MBD-Seq technology. PLoS One 2011; 6:e22226; http://dx.doi.org/10.1371/journal.pone.0022226; PMID: 21779396
- Bibikova M, Fan JB. Genome-wide DNA methylation profiling. Wiley Interdiscip Rev Syst Biol Med 2010; 2:210 - 23; http://dx.doi.org/10.1002/wsbm.35; PMID: 20836023
- Gerlinger M, Rowan AJ, Horswell S, Larkin J, Endesfelder D, Gronroos E, et al. Intratumor heterogeneity and branched evolution revealed by multiregion sequencing. N Engl J Med 2012; 366:883 - 92; http://dx.doi.org/10.1056/NEJMoa1113205; PMID: 22397650
- Lutsik P, Feuerbach L, Arand J, Lengauer T, Walter J, Bock C. BiQ Analyzer HT: locus-specific analysis of DNA methylation by high-throughput bisulfite sequencing. Nucleic Acids Res 2011; 39:Web Server issue W551-6; http://dx.doi.org/10.1093/nar/gkr312; PMID: 21565797
- Taylor KH, Kramer RS, Davis JW, Guo J, Duff DJ, Xu D, et al. Ultradeep bisulfite sequencing analysis of DNA methylation patterns in multiple gene promoters by 454 sequencing. Cancer Res 2007; 67:8511 - 8; http://dx.doi.org/10.1158/0008-5472.CAN-07-1016; PMID: 17875690
- Schüffler P, Mikeska T, Waha A, Lengauer T, Bock C. MethMarker: user-friendly design and optimization of gene-specific DNA methylation assays. Genome Biol 2009; 10:R105; http://dx.doi.org/10.1186/gb-2009-10-10-r105; PMID: 19804638
- Yang AS, Estécio MRH, Doshi K, Kondo Y, Tajara EH, Issa JPJ. A simple method for estimating global DNA methylation using bisulfite PCR of repetitive DNA elements. Nucleic Acids Res 2004; 32:e38; http://dx.doi.org/10.1093/nar/gnh032; PMID: 14973332
- Fichtner I, Slisow W, Gill J, Becker M, Elbe B, Hillebrand T, et al. Anticancer drug response and expression of molecular markers in early-passage xenotransplanted colon carcinomas. Eur J Cancer 2004; 40:298 - 307; http://dx.doi.org/10.1016/j.ejca.2003.10.011; PMID: 14728946