 ?Mathematical formulae have been encoded as MathML and are displayed in this HTML version using MathJax in order to improve their display. Uncheck the box to turn MathJax off. This feature requires Javascript. Click on a formula to zoom.
Abstract
The potential influence of underlying differences in relative leukocyte distributions in studies involving blood-based profiling of DNA methylation is well recognized and has prompted development of a set of statistical methods for inferring changes in the distribution of white blood cells using DNA methylation signatures. However, the extent to which this methodology can accurately predict cell-type proportions based on blood-derived DNA methylation data in a large-scale epigenome-wide association study (EWAS) has yet to be examined. We used publicly available data deposited in the Gene Expression Omnibus (GEO) database (accession number GSE37008), which consisted of both blood-derived epigenome-wide DNA methylation data assayed using the Illumina Infinium HumanMethylation27 BeadArray and complete blood cell (CBC) counts among a community cohort of 94 non-diseased individuals. Constrained projection (CP) was used to obtain predictions of the proportions of lymphocytes, monocytes and granulocytes for each of the study samples based on their DNA methylation signatures. Our findings demonstrated high consistency between the average CBC-derived and predicted percentage of monocytes and lymphocytes (17.9% and 17.6% for monocytes and 82.1% and 81.4% for lymphocytes), with root mean squared error (rMSE) of 5% and 6%, for monocytes and lymphocytes, respectively. Similarly, there was moderate-high correlation between the CP-predicted and CBC-derived percentages of monocytes and lymphocytes (0.60 and 0.61, respectively), and these results were robust to the number of leukocyte differentially methylated regions (L-DMRs) used for CP prediction. These results serve as further validation of the CP approach and highlight the promise of this technique for EWAS where DNA methylation is profiled using whole-blood genomic DNA.
Introduction
Methylation of a cytosine residue in the context of a CpG dinucleotide on DNA is a normal epigenetic regulatory mark that contributes to the control of gene expression and genomic stability. Epigenetic processes, such as DNA methylation, allow a single genome to elicit the multitude of transcriptional programs characteristic of multicellular organisms, whose various cell types have distinct phenotypes and functions. Of course, because epigenetic patterns are linked to cell-specific gene expression patterns, several studies have successfully identified differentially methylated regions (DMRs) among various cell types,Citation1-Citation5 i.e., CpG sites whose methylation state is stable and differs among two or more cell types.
When studying DNA methylation in human health and disease, DMRs present an important challenge and a unique opportunity. For instance, DNA from peripheral blood is a mixture of genetic substrate from various leukocyte subtypes, and variation in leukocytes proportions could confound true epigenetic associations between methylation and a dependent variable of interest, since there is the potential for associations between phenotype and DNA methylation to be mediated by shifts in leukocyte proportions. Indeed, the potential for shifts in leukocyte composition to confound associations in epigenome-wide association studies (EWAS) has been recognized.Citation6-Citation12 The underlying proportion of leukocytes could also confound or bias other leukocyte DNA biomarker relationships, such as that between telomere length, repetitive element DNA methylationCitation13 or mitochondrial copy numberCitation14 and exposures or disease outcomes.
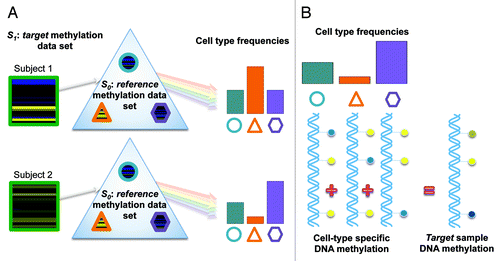
Motivated by work from our group and others that identified L-DMRs that distinguish white blood cell types,Citation10,Citation15-Citation17 we recently developed a set of statistical methods that exploit the use of L-DMRs for inferring changes in cell mixture proportions based solely on DNA methylation profiles of peripheral blood.Citation18 In this approach (), data obtained from a target set (S1), consisting of DNA methylation profiles from a heterogeneous mixture of cell populations, are assumed to be a high-dimensional multivariate surrogate for the underlying distribution of cell types. Houseman et al.Citation18 proposed a cell mixture deconvolution methodology that involves the projection of DNA methylation profiles from S1 onto a reference data set (S0 ), which is comprised of the DNA methylation signatures for isolated leukocyte subtypes. Under certain constraints, which we describe in more detail in the Statistical methods section, the cell mixture deconvolution approach can be used to approximate the underlying distribution of cell proportions within S1 via constrained projection (CP).
Figure 1. Illustration of the blood cell mixture deconvolution approach. This approach involves, (A) constrained projection of DNA methylation profiles from a target methylation data set (S1) onto a reference data set (S0 ), which is comprised of the DNA methylation signatures for isolated white blood cell types (shapes reflect different white blood cell types). The result is an estimate of the underlying distribution of cell proportions (circle, triangle and hexagon) for each sample within S1. (B) This approach assumes that the methylation signature for samples within S1 are the weighted sum of the methylation signatures from individual white blood cell types, where the weights are proportional to the cell-type frequencies.
Currently, leukocyte differential counts and flow cytometry measurements (the gold standard for identifying subsets of cells within heterogeneous mononuclear cell samples) are often not possible because they require fresh samples with intact cells, or are too costly. Thus, as epigenome-wide DNA methylation can be measured using archival peripheral blood with relatively straightforward protocols and commercially available array technology or bisulfite sequencing, the capacity to accurately predict cell-type proportions using L-DMRs has important implications for any study of health, disease or pharmacologic intervention where measurement of leukocyte proportions is of interest. For instance, in EWASCitation19 (Langevin et al., under review) obtaining reliable estimates of relative leukocyte proportions using DNA-based methods could be used for better understanding the extent to which observed differences in whole-blood DNA methylation are due to underlying differences in leukocyte subtypes themselves or reflect direct changes in the methylome. Along these lines, the predicted cell-type proportions obtained from constrained projection could be added as additional covariate terms to control for the confounding effects of variable leukocyte distribution when examining the association between DNA methylation and some phenotype/exposure of interest. In fact, the approach described in Houseman et al.Citation18 has been successfully applied in the context of several EWASCitation19,Citation39 (Langevin et al., under review; Koestler et al., provisionally accepted) and was shown to reliably estimate leukocyte proportions in a small-scale mixture experiment involving six known mixtures of monocytes and B cells and six known mixtures of granulocytes and T cells.Citation18 However, a comprehensive examination of the potential for constrained projection to accurately predict cell-type proportions in large-scale epigenome-wide DNA methylation data sets has not been shown.
Lam et al.Citation20 recently investigated the relation of peripheral blood DNA methylation with demographic, socioeconomic and psychosocial factors among a cohort of 94 healthy individuals using commercially available epigenome-wide methylation array technology. In addition, these authors subjected each blood sample to a detailed differential blood cell count. As further validation of the methods of Houseman et al.Citation18 for estimating relative leukocyte proportions in peripheral blood using L-DMRs, here we present an analysis of their methylation and differential blood cell count data. Specifically, we focus our attention on the utility of the constrained projection approachCitation18 for accurately predicting relative leukocyte distributions, comparing our predictions to those obtained from a widely accepted method for determining cell-type distributions in blood. Since there is interest in balancing the number of L-DMRs and cell-type prediction performance, we also present an examination of the sensitivity of our predictions to varying numbers of L-DMRs used in the constrained projection procedure.
Results
As previously described,Citation20 proportions of lymphocytes, monocytes, basophils, eosinophils and neutrophils were assessed in whole-blood by complete blood count (CBC) with differential, for each of the 99 samples among the 94 study subjects. The percentage of granulocytes in whole-blood, which ranged from 36.1–77.5% across the study subjects, comprised the vast majority of underlying cell types, constituting on average 61.7% (SD = 8.6%) (). On average, lymphocytes and monocytes constituted 31.6% (SD = 8.3%) and 6.7% (SD = 2.1%) of the underlying cell types and, like granulocytes, exhibited substantial variability across the study subjects (range 15.1–57.4% and 1.5–13.1%, respectively) ().
Figure 2. Complete blood cell (CBC) and predicted proportions of white blood cell types in the target methylation data set. CBC derived proportions [i.e., Ω(CBC)] of white blood cell types in (A) whole-blood and (B) peripheral blood mononuclear cell (PBMCs) (i.e., devoid of granulocytes) for the samples in the target methylation data set. (C) Predicted proportions (i.e., ) of CD8+ T-lymphocytes (CD8T), CD4+ T-lymphocytes (CD4T), Natural killer cells (NK), B cells (Bcell), Monocytes (Mono) and Granulocytes (Gran) for the target samples using constrained projection (CP). Black bars denote the median and the red dashed bars denote the 75th and 25th percentiles for the predicted cell-type proportions. Colored points indicate subjects with replicate samples, where two points of the same color denote replicate samples for the same subject.
![Figure 2. Complete blood cell (CBC) and predicted proportions of white blood cell types in the target methylation data set. CBC derived proportions [i.e., Ω(CBC)] of white blood cell types in (A) whole-blood and (B) peripheral blood mononuclear cell (PBMCs) (i.e., devoid of granulocytes) for the samples in the target methylation data set. (C) Predicted proportions (i.e., ) of CD8+ T-lymphocytes (CD8T), CD4+ T-lymphocytes (CD4T), Natural killer cells (NK), B cells (Bcell), Monocytes (Mono) and Granulocytes (Gran) for the target samples using constrained projection (CP). Black bars denote the median and the red dashed bars denote the 75th and 25th percentiles for the predicted cell-type proportions. Colored points indicate subjects with replicate samples, where two points of the same color denote replicate samples for the same subject.](/cms/asset/eb573dd2-1561-44a0-8629-c4661c9aa7b6/kepi_a_10925430_f0002.gif)
Since DNA methylation was assessed in PBMCs, which are mostly devoid of granulocytes, the percentage of lymphocytes and monocytes in PBMCs was taken to be the percentage of these cell types in the absence of granulocytes. From this, we estimated the average percentage of lymphocytes and monocytes in PBMCs to be 82.1% and 17.9%, respectively ().
As in Lam et al.,Citation20 we first began by implementing a principal components analysis (PCA) to gain an understanding of the extent to which variation in DNA methylation across the array could be explained by differences in the underlying distribution of cell types. PCA represents a feature extraction technique where the data are orthogonally transformed, such that the first principal component has the largest possible variance (accounts for maximal amount of variability in the data), and each succeeding component in turn has the next highest variance possible. As we detected substantial variability in DNA methylation due to BeadChip (Fig. S1), we first applied the ComBatCitation21 methodology to normalize the methylation data based on BeadChip. After adjusting out the effects of BeadChip on variability in DNA methylation, we computed the principal components, or otherwise eigen-probes, based on the adjusted DNA methylation data. Not surprisingly, the CBC-derived proportions of lymphocytes and monocytes were found to be associated with the first and third eigen-probes (p = 0.07 and p = 0.06, respectively), which accounted for 16.5% and 5.4% of the variation of DNA methylation across the array. The second eigen-probe, which accounted for 9.1% of the variation in DNA methylation, was found to be significantly associated with exercise (minutes per week) (p = 0.04) and ethnicity (Caucasian vs. non-Caucasian) (p = 0.03) and marginally significantly associated with age, gender and smoking status (yes vs. no) (p = 0.07, 0.06, 0.09, respectively). Thus, even among the study subjects considered here, which were all non-diseased at the time of sample collection, differences in white blood cell distributions are contributing to the observed variation in PMBC DNA methylation. These results provide further support for the adjustment cell-type distributions when analyzing blood-derived DNA methylation data, particularly in situations where the phenotype or exposure of interest is responsible for shifts in leukocyte subpopulations.
We next examined the extent to which CP is capable of producing reliable and accurate estimates of the underlying relative distribution of leukocytes. To discern L-DMRs, we examined the association between methylation and leukocyte subtype (e.g., CD4+ T cells, CD8+ T cells, B cells, etc.) for each of the 26,486 autosomal CpG loci. This revealed 10,370 significantly differentially methylated CpGs among the leukocyte subtypes (fdr q-value < 0.05), which we ranked by q-value. Consistent with Liu et al.,Citation19 we applied CP using the top 500 L-DMRs, allowing us to obtain predictions for the proportions of CD8+ T-lymphocytes (CD8T), CD4+ T-lymphocytes (CD4T), Natural Killer cell (NK), B cells (Bcell), Monocytes (Mono) and Granulocytes (Gran) across the 99 individual samples. As there were 5 subjects in S1 with replicate samples (collected at the same time), we had the unique opportunity to assess the similarity in cell-type predictions within a replicate pair, which would be expected to be high. The results of this analysis are given in and show a high-degree of similarity between the predicted cell-type proportions among the 5 technical replicates—indicated by colored points. Within a specific cell type, differences between the predicted percentages among technical replicates were minimal, with a mean difference of 2% (SD = 2%). This is also captured in the intra-class correlation coefficients (ICCs), which ranged from 0.85–0.95, demonstrating a high-degree of similarity in the predicted cell-type proportions among technical replicates.
As DNA methylation was profiled in PBMCs, we were also interested in examining the specificity of CP by investigating the predicted proportions of granulocytes—which would be expected to be approximately zero, allowing for some small residual contamination in purification. As noted in , the predicted percentage of granulocytes was minimal, ranging from 0–7% with a mean value across the study samples of 1% (SD = 1.3%). Examining the correlation between the predicted percentage of lymphocytes, obtained by summing the individual predictions among the lymphoid-derived cells (i.e., CD4T, CD8T, NK and B cells) and the percentage of lymphocytes via CBC (), demonstrated a moderate-high correlation between predicted lymphocyte proportions and those obtained from CBC (r = 0.61; p < 0.0001). Similarly, we also observed a moderate-high correlation between predicted monocyte proportions and those obtained from CBC (r = 0.60; p < 0.0001) ().
Figure 3. Comparison of the predicted and CBC derived proportions of monocytes and lymphocytes among the target samples. Scatter-plot of the predicted and CBC-derived proportions of (A) monocytes and (B) lymphocytes. Solid red lines represent the unity lines (i.e., y = x). Bland–Altman plots for (C) monocyte and (D) lymphocyte proportions. Y-axes represent the difference in the predicted and CBC-derived cell-type proportions, and X-axes represent the mean cell-type proportions based on CP prediction and CBC-based proportions. Red-dotted lines indicate the global bootstrap-based 95% prediction intervals for the difference in predicted and CBC-derived cell-type proportions.
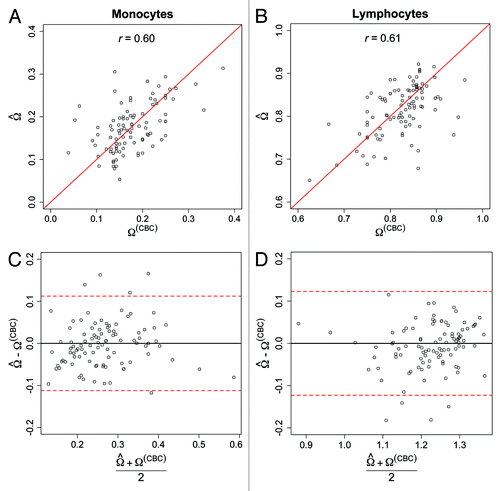
Across the study samples, there was remarkable consistency between the average percentage of monocytes and lymphocytes via CBC (17.9% and 82.1%, respectively) and the average predicted percentage of monocytes (17.6%) and lymphocytes (81.3%). Furthermore, the root mean squared error (rMSE) (i.e.,
for k ∈ {1,2,…,K}) based on comparisons of the predicted and CBC percentages of lymphocytes and monocytes was 6% and 5%, respectively. We also note that the vast majority of our subject-specific cell-type predictions were within the global 95% bootstrap prediction interval (). Examining the bias in our cell-type predictions based on characteristics of the study subjects showed some evidence of an association between cell type-specific prediction error and stress (p = 0.06 and 0.05 for monocytes and lymphocytes, respectively), depression (p = 0.07 and 0.03 for monocytes and lymphocytes, respectively) and current SES status (p = 0.02 for lymphocytes) (Table S1; Table S2). However none of the aforementioned p-values remained statistically significant after controlling for multiple comparisons.
Two possibilities to explain this phenomenon include that the accuracy of CBC counts are themselves associated stress, depression and current SES. Since this is unlikely, the second possibility is that the accuracy of cell-type predictions via CP is associated with these covariates. Or in other words, a subject’s value for these covariates is adversely influencing the accuracy of our predictions. Since our predictions were based on CP using the top 500 L-DMRs, this would necessarily imply that the methylation status of the top 500 L-DMRs are themselves altered based on the values of these covariates. To this end, we conducted an additional analysis aimed at investigating the association between the methylation status of the top 500 L-DMRs and each of the previously mentioned covariates. For this analysis, we fit a series of generalized estimating equations (GEE) that modeled the methylation M-values for the top 500 L-DMRs, the above covariates as a dependent variable, and incorporated dependency based on replicate samples from the same subject. These models were also adjusted for either the CBC-derived proportion of lymphocytes or the predicted proportion of lymphocyte subtypes (CD4T, CD8T, etc.) to remove the confounding effect due to interpersonal differences in immune cell subsets. The p-values reported in Table S3 reflect the omnibus p-value obtained from a permutation test (further details provided in the Supplementary Material) and demonstrated no association between the top 500 L-DMRs and stress, depression and current SES (p = 0.45, 0.56 and 0.12, respectively). While a number of other covariates (age, gender, ethnicity) demonstrated a significant association with the top 500 L-DMRs, none of these covariates were associated with bias in our cell- type predictions (Table S1; Table S2). Furthermore, removing the L-DMRs that were significantly associated with age, gender, and ethnicity followed by the subsequent application of CP using the remaining L-DMRs, showed a very high correlation with the previously obtained cell-type estimates (Pearson correlation = 0.99, 0.99, 0.98, 0.96, 0.99 and 0.97 for CD4T, CD8T, Bcell, NK, Mono and Gran, respectively).
We also considered a negative control analysis as a further validation of CP and of the utility of L-DMRs in inferring cell-type proportions. While our previous analysis used the top 500 L-DMRs (Fig. S2A) for predicting cell-type proportions in our target data set, as a negative control we used 500 CpGs among the set of non-L-DMRs (i.e., those with fdr q-value > 0.05). Specifically, the 500 least discriminative CpGs across the leukocyte subtypes were selected for this analysis (Fig. S2B) and used in the previously described CP procedure to arrive at predictions for cell-type proportions. The results of this analysis, showed very little correlation between the between predicted cell-type proportions and those obtained from CBC (r = 0.10 for both monocytes and lymphocytes, respectively) and an rMSE of 34% between the predicted and CBC-derived cell-type percentages for both lymphocytes and monocytes.
We next implemented a sensitivity analysis aimed at understanding the sensitivity of the predicted cell-type proportions attempted to gain an understanding of the sensitivity of our predictions when m, or the number of L-DMRs used in CP was varied. For this analysis, m was varied from 20 to 10,000, and (as previously) for each selection of m the correlation and rMSE were used to compare the predicted and CBC-derived proportions of monocytes and lymphocytes. Additionally, for each selection of m, the predicted proportion of granulocytes was recorded and used to assess the specificity of CP across differing selections of m. Our choice of 10,000 L-DMRs as the upper limit in our sensitivity analysis was based on the number of statistically significant CpG loci across the leukocyte subtypes (10,370 with fdr qvalues < 0.05). The results of this analysis are given in and show minimal variation in the correlation coefficients between the predicted and CBC-derived proportions of monocytes and lymphocytes across different selections of m (). Specifically, beyond 1,000 L-DMRs correlations between the predicted and CBC-derived proportions of monocytes and lymphocytes varied by at most 0.04 on the correlation scale and both appeared to achieve maximum correlation at m = 6,000 (i.e., the top 6,000 L-DMRs). Similarly, there was minimal variation in the rMSE between the predicted and CBC-derived proportions of monocytes and lymphocytes across different selections of m, with differences of at most 1.5% in rMSE across the selected numbers of L-DMRs (). While the median percent of granulocytes was minimized at approximately m = 800, like the correlation and rMSE between predicted and CBC-derived proportions of monocytes and lymphocytes, there was a fair degree of stability in the median percent of granulocytes as a function of m ().
Figure 4. Prediction performance as a function of the number of L-DMRs used in CP. (A) Pearson correlation between the predicted and CBC-derived proportions of monocytes (blue line) and lymphocytes (red line) as a function of the numbers of L-DMRs used in CP. (B) root mean squared error (rMSE) for monocytes and lymphocytes and (C) median (%) granulocytes as a function of the numbers of L-DMRs used in CP. (D) Pearson correlation between the predicted and CBC-derived proportions of monocytes and lymphocytes as a function of the numbers of non L-DMRs (negative controls) used in CP.
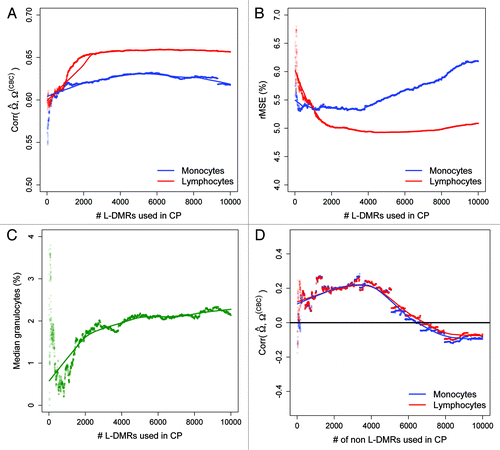
In a manner similar to the sensitivity analysis described above, we also examined the correlation and rMSE based on predicted and CBC-derived proportions of monocytes and lymphocytes as a function of the number of non L-DMRs used in CP. Contrary to the relative stability in both correlation and rMSE as a function of the number of L-DMRs, the correlation between predicted and CBC-derived proportions of monocytes and lymphocytes based on non L-DMRs varied considerably as a function of m (−0.18 to 0.25 across the range of m) and tended to be centered at 0 (). Similarly, the rMSE for monocytes and lymphocytes was as large as 47% and 48%, respectively, but stabilized at around m = 6,000 with an rMSE of approximately 15% for both monocytes and lymphocytes (Fig. S3).
Discussion
Using a publicly available data set consisting of PBMC-derived DNA methylation and CBC counts for 99 samples across 94 healthy non-diseased subjects, we have investigated the extent to which the constrained projection approach of Houseman et al.Citation18 provides reliable and accurate estimates of the underlying relative leukocyte distribution in blood. Owing to the fact that blood is a readily accessible tissue and because peripheral blood leukocytes have been suggested to directly or indirectly participate in the pathophysiology of a vast array of disease states,Citation22-Citation24 DNA methylation analyses using blood-derived genomic DNA have been conducted across a variety of different human diseasesCitation8,Citation9,Citation12,Citation25-Citation28 and also in the context of exposures.Citation29-Citation31 The validation analysis considered here is motivated both by (1) the increasing number of EWAS using blood-based assessment of DNA methylation and (2) the recognized potential for confounding based on underlying interpersonal differences in circulating immune profiles characteristic of such studies.Citation15 While several recent works have adjusted for CBC countsCitation20,Citation32 for identifying differential patterns of methylation in blood that are independent of the underlying distribution of leukocytes, in many cases CBC counts may not be readily available (or even feasible) and in any case cannot provide complete information on immune variability due to their inability to discriminate lymphocyte subtypes. While FACS can be used to identify lymphocyte subtypes, this method bears a relatively high cost per sample and generally requires fresh samples. The limitations of current approaches underscore the vast potential utility of DNA methylation-based methods and accompanying statistical techniques that are capable of accurately and reliably estimating the distribution of cell types.
Our initial analyses, which used the top 500 L-DMRs in CP, first focused on investigating the specificity of this approach. As DNA methylation was profiled in PBMCs (devoid of multinucleate granulocytes) for the samples in our target methylation data set, the percentage of granulocytes would be expected to be approximately zero potentially subject to some granulocyte contamination in the isolation process.Citation33 Our findings, which demonstrated a minimal predicted percentage of granulocytes across the target study samples (1%; mean across study samples) illustrate the specificity of CP and are even more noteworthy when considering that granulocytes typically comprise the vast majority of white blood cell types (50–70%) in the whole-blood of non-diseased individuals. As our target methylation data set consisted of technical replicate samples for five subjects, we were also interested in investigating the reproducibility of CP by comparing the predicted cell-type proportions within a replicate pair. Overall, our results demonstrated a high-degree of similarity in the predicted cell-type proportions within replicate pairs. The minor differences between the predicted cell-type proportions between replicate samples from the same subject is not unexpected given the less than perfect nature of cell sorting (>97% purity) to obtain S0, the role of measurement error in array-based DNA methylation assessmentCitation34 and the well-established issue of technical variability in DNA microarrays arising from plate/BeadChip effects.Citation35-Citation37
Our findings also demonstrated high consistency between the average CBC-derived and predicted percentage of monocytes and lymphocytes (17.9% and 17.6% for monocytes and 82.1% and 81.4% for lymphocytes), with rMSE of 5% and 6%, for monocytes and lymphocytes, respectively. Moreover, bias in our estimates of the proportion of monocytes appeared to be independent of most potential confounders in DNA methylation array analyses. Of those that showed some evidence of an association with cell type-specific prediction error (e.g., stress, depression and current SES status), none were significantly associated with the methylation status of the top 500 L-DMRs. While there were some covariates that exhibited significant associations with the top 500 L-DMRs (e.g., age, gender and ethnicity), these results are likely to be conservative as the models we fit controlled for only the CBC-derived proportion of lymphocytes and not individual lymphocyte subtypes, which were not available in the target data set. Moreover, removal of those specific L-DMRs followed by the subsequent estimate of cell-type proportions based on the remaining L-DMRs showed a very high correlation with the previously obtained estimates. Based on these findings, L-DMRs that exhibited co-variation with subject-specific characteristics do not seem to be substantially influencing our estimates of cell-type proportions.
Reinforcing the potential of CP for producing accurate cell-type predictions, we also observed a moderate-high correlation between predicted monocyte and lymphocyte proportions and those obtained from CBC counts. These results, taken together with the findings of our negative control analysis indicating poor prediction performance when CP is based on the least discriminative L-DMRs, stand as testament to the value of L-DMRs in deconvoluting cellular mixtures based on blood-derived DNA methylation profiles in a target methylation data set. While our reference data set allowed us to predict the proportion of specific lymphocyte subtypes (CD4T, CD8T, etc.), such a detailed speciation of lymphocytes was not available for the target data set considered here. As a result, this limited our ability to assess the predictive accuracy of CP for these cell types. We do note, however, that future work involving measurements of individual lymphocyte subtypes in a target data set is currently underway.
As the capacity to accurately predict the underlying relative leukocyte distribution in blood is principally driven by DMRs across leukocyte subtypes, Illumina’s most recent BeadArray, the HumanMethylation450 BeadArray, which simultaneously profiles the methylation status for >485,000 CpGs, is likely to reveal additional L-DMRs. In doing so, these additional L-DMRs could be added to our existing set of L-DMRs, which might further improve the accuracy and precision of cell-type predictions. As a cautionary note, attention should be given toward selecting L-DMRs containing SNPs at/near the targeted probe, which might affect the measurement of DNA methylation. Furthermore, while the top 500 L-DMRs used here comprised only autosomal CpG loci (X and Y linked loci were removed) due to the potential for gender-associated biases, the application of the methods described here to gender-specific data sets (e.g., ovarian cancer, prostate cancer, etc.) could be augmented by including both autosomal and non-autosomal L-DMRs. However, we expect only marginal differences in cell-type estimates, as only a small fraction of the top L-DMRs were associated with non-autosomal CpG loci (6 out of 500). Similarly, future work involving methylation profiling of additional sorted cell types, such as nucleated red blood cells present at birth and in cord blood, M1 and M2 macrophages, and myeloid derived suppressor cells, have the potential to further refine studies of infant cord blood methylation profiles.
It should also be noted that while confounding in blood-based assessment of DNA methylation by variation in circulating immune cells motivated the methods described in Houseman et al.,Citation18 the underlying proportion of leukocytes could also confound other leukocyte DNA biomarker relationships, including the relationship between telomere length, repetitive element DNA methylation,Citation13 or mitochondrial copy numberCitation14 and exposures or disease phenotypes. Thus, future applications might involve an extension of the methods of Houseman et al.Citation18 for deconvoluting cell mixtures using DNA methylation data and controlling for this confounding in studies of these and other leukocyte-based biomarkers.
Our sensitivity analysis of cell-type predictions as a function of the number of L-DMRs, m, used in CP, demonstrated that both the rMSE and the correlation between predicted and CBC-derived cell-type proportions were relatively stable as a function of m. While we and othersCitation19 have found that using the top 500 L-DMRs in CP works well, we recommend that investigators interested in implementing this methodology do so using a range of L-DMRs, ensuring that cell-type predictions remain relatively stable as a function of m. We also note that other algorithms to identify L-DMRs, i.e. ones that employ an approach other than omnibus F-statistics from one-way ANOVA, might result in different optimal number of L-DMRs. For example, t-statistics for pairwise comparisons of CpG-specific DNA methylation across leukocyte subtypes may actually result in a fewer number of total L-DMRs while maintaining or exceeding the prediction performance.
In summary, this work serves as further validation of the CP approach of Houseman et al.,Citation18 using an independent data set based on a large-scale EWAS focused on healthy non-diseased adults. The increasing numbers of EWAS that involve DNA methylation profiling in unfractioned whole-blood coupled with the well-established role of confounding due to cell-type distributions, highlight the promise and future applications of this technique.
Materials and Methods
Target samples S1, DNA methylation from heterogeneous mixture of cell types
To investigate the extent to which patterns of blood-based DNA methylation can be used for inferring the underlying distribution of cell types, we used publicly available data deposited in the Gene Expression Omnibus (GEO) database (accession number GSE37008). This study, which has been previously described,Citation20 consisted of epigenome-wide assessment of DNA methylation based on genomic DNA derived from purified peripheral blood mononuclear cells (PBMCs) from a community cohort of 94 non-diseased individuals in the Vancouver, BC lower mainland area.Citation38 Individuals in this study ranged in age from 24 to 45 y (median = 33, SD = 5.08), were predominantly female (63%; n = 59) and non-smokers (87%; n = 82).
The Illumina Infinium HumanMethylation27 array platform, which enables the quantitative assessment of the DNA methylation status of 27,578 CpG loci at single-nucleotide resolution, was used to measure DNA methylation in genomic DNA derived from PBMCs. The methylation status for each individual CpG locus was calculated as the ratio of fluorescent signals [β = Max(M,0)/(Max[M,0] + Max[U,0] + 100)], ranging from 0 (no methylation) to 1 (complete methylation), using the average probe intensity for the methylated (M) and unmethylated (U) alleles. CpG loci associated with X and Y chromosomes were removed from our analyses, due to gender-associated biases. The DNA methylation status was assessed in replicate for 5/94 of the individuals in this study (samples collected at the same time point), giving rise to a total of 99 samples that comprised the target set (S1) used in our validation analysis.
Assessment of cell-type proportions in target samples, S1
As previously described by ref. Citation20, blood-drawn samples were processed immediately with density-gradient centrifugation for isolation of peripheral blood mononuclear cells (PBMCs). At the time of blood draw, samples were subjected to complete blood count (CBC) with differential using an Advia 70 Hematology System (Siemens Medical) to estimate the proportions of lymphocytes, monocytes, basophils, eosinophils and neutrophils. In addition, in a subset of PBMC samples, subpopulations of lymphocytes were captured by immunomagnetic selection for CD14+ lymphocytes as well as CD3+ monocytes.
Reference samples S0, DNA methylation from isolated cells
As previously described,Citation10,Citation18 our reference set (S0) consisted of sorted, normal, human, peripheral blood leukocyte subtypes purchased from AllCells. Leukocytes were isolated from different, anonymous, non-diseased individuals’ whole-blood by magnetic-activated cell sorting (MACS) using a combination of negative and positive selection with highly specific cell surface antibodies conjugated to magnetic beads. The purity of separated cells was confirmed with flow cytometry to be >97% and included 46 white blood cell samples, comprising lymphoid [B cells, Natural Killer (NK) cells and Pan-T-cells] and myeloid (Monoctyes and Granulocytes)-derived cells (). Genomic DNA was extracted and purified from cell pellets using a commercially available method (Qiagen), treated with sodium bisulfite (Zymo Research) and subjected to methylation profiling using the Infinium HumanMethyation27 BeadArray (Illumina), the same platform used for the DNA methylation analysis of the target samples described above.
Table 1. Sorted white blood cell types in reference set, S0
Statistical methods
While a complete description of the constrained projection (CP) approach for predicting cell-type proportions based on DNA methylation signatures from a heterogeneous mixture of cells has been described previously by Houseman et al.,Citation18 below we summarize the salient aspects of this approach with specific attention given toward those that relate to this validation analysis. As described above, let S0 denote the reference sample of DNA methylation profiles from isolated cells, and let S1 denote the corresponding set of target DNA methylation profiles, which are assumed to arise from mixtures of the cell types isolated in S0 (). Here, S0 is comprised of the DNA methylation profiles for n0 specimens (n0 = 46 based on our reference data set), Y0i, i = 1, 2, …, n0, an m × 1 vector of DNA methylation measurements. Similarly, S1 consists of the DNA methylation profiles for n1 samples (n1 = 99 based on our target data set), Y1i, i = 1, 2, …, n1, for the same m CpG sites in Y0i (and in the same order). Each element in Yhi, h ∈ {0,1} corresponds to a specific, pre-selected L-DMR chosen to distinguish one or more of the cellular subtypes assayed in S0 and contributing to the mixtures measured in S1. As previously described,Citation10,Citation18 L-DMRs were identified by rank ordering CpGs based on the F-statistics for distinguishing cell types, obtained from a series of linear mixed effects models fit to each CpG independently among the specimens in S0. Assuming that S0 is comprised of K different cell types (K = 6 based on our reference data set), each of which has mean μk, we have that , where ci denotes cell type and ci = {1,2,…,K}. Therefore, M = (μ1,μ2,…,μK) represents an m × K matrix of mean methylation for the m selected L-DMRs across the K different leukocyte subtypes. Here, we used a series of mixed effects models (i.e., treating chip as a random effect) to obtain
.
Assuming that subject i assayed in S1 is a mixture of the K leukocyte subtypes assayed in the reference set S0, with mixing coefficients represented by a K × 1 vector Ωi, , where Ωik ≥ 0, then
. That is, the methylation profile of subject i in the target data are assumed to arise as the weighted methylation profile across the K leukocyte subjects, such that the contribution of each subtype, or otherwise the proportion of each leukocyte subtype, is reflected by ω. Thus, interest here is focused on the estimation of Ωi. Houseman et al.Citation18 demonstrate that Ωi can be estimated using constrained projection, i.e., by setting
to the value of ω that minimizes
with the constraint
and the additional constraint that
. The former constraint ensures non-negativity among for estimated proportion of particular cell type and the later ensures that the coefficients have the “multinomial” interpretation of additive proportions.
Bootstrap resampling was used to quantify uncertainty in the estimation of Ωi. Since there are several sources of variability, including variability in the observed methylation values for the samples in S1 and in the estimate of M, a parametric bootstrap procedure was used to obtain resampled estimates of the cell-type proportions, for each sample in S1. The standard deviation of the resampled estimates of the cell-type proportions were computed and used to construct 95% prediction intervals for
. Further details regarding the parametric bootstrap procedure are provided elsewhere.Citation18
In our examination, we focused first on obtaining the estimate followed by the subsequent comparison of
and Ωi(CBC), where Ωi(CBC) represents the proportions of the K leukocyte subjects obtained using complete blood cell count measurements. Additionally m, or the number of L-DMRs used in the constrained projection, is a tuning parameter. Thus, we also examined the sensitivity of
as value of m was varied from 20 to 10,000.
We note a few considerations that arise in the comparison of and Ωi(CBC). As previously mentioned, our target data set consisted of whole-blood, CBC counts of lymphocytes, monocytes, basophils, eosinophils and neutrophils (whereas DNA methylation was profiled in PBMCs). The percentage of these cells in whole-blood was taken to be the count of the various cell types per 10−9 liter of whole-blood dived by the sum of the counts over all cell types. The percentage of granulocytes was computed as: granulocyte(%) = basophil(%) + eosinophils(%) + neutrophil(%). Since DNA methylation was assessed in PBMCs, which contain a negligible proportion of granulocytes, the percentage of lymphocytes and monocytes in PBMCs were taken to be the percentage of these cell types in the absence of granulocytes, i.e., the count of these cell types per 10−9 liter of whole-blood by the sum of the counts of only lymphocytes and monocytes per 10−9 liter of whole-blood. Thus, Ωi(CBC) is a 1 × 3 vector, representing the proportions of lymphocytes, monocytes, and granulocytes in PBMCs.
In combination with the methylation data available for our target data, our reference data on isolated leukocyte subtypes, allowed us to obtain estimates of the proportions of each of the cell types given in . Since such a detailed speciation of leukocytes was not available from the CBC measurements in the target data—particularly for the lymphoid derived cell types—,we took our estimate of the proportion of lymphocytes to be the sum of the individual estimates of the lymphoid derived cells, i.e., Lymphocyte(%) = CD4 + Tcell(%) + CD8 + Tcell (%) + NK cell(%) + Bcell(%). Hence, represents a 1 × 3
cating the estimated proportions of lymphocytes, monocytes and granulocytes for sample i within the target data.
Given the potential for confounding in the analysis of DNA methylation data based on factors such as age, gender, race, smoking status, etc., we conducted a series of analyses aimed at examining the association between the prediction error and absolute prediction error [ and
and potential confounders. Specifically, we examined the extent to which bias in our predictions are associated with: age (yrs), gender, smoking status (yes/no), childhood socio-economic status (high/low), current socio-economic status (high/low), alcohol consumption (drinks per week), BMI, exercise (min. per week), stress (perceived stress scale questionnaire), depression (center for epidemiologic studies depression scale) and ethnicity (Caucasian/non-Caucasian). For each of the above factors, a linear mixed effects model was fit that modeled prediction error or absolute prediction error as the response, the potential confounder as the independent variable and a included random effect term for subject to account for correlated errors among replicate samples collected from the same subject. Unadjusted and false discovery rate adjusted P-values were computed for each of aforementioned factors. Along these lines, we also examined the association between the top 500 L-DMRs and each of the covariates described above. Further details regarding the methods used in the analysis are given in the Supplementary Material.
| Abbreviations: | ||
| CBC | = | complete blood cell |
| CP | = | constrained projection |
| EWAS | = | epigenome-wide association study |
| L-DMR | = | leukocyte differentially methylated regions |
| MAPE | = | median absolute prediction error |
| PBMC | = | peripheral blood mononuclear cell |
| WBC | = | white blood cell |
Additional material
Download Zip (1.9 MB)Acknowledgments
This work was supported by the US National Institutes of Health grants: R01 CA078609 to K.T.K., R25 CA134286, ES018175 and RD83459901 to M.R.K, R01 CA126831 to J.K.W. and R01 MH094609 to C.M.J.
Submitted
04/10/13
Revised
05/14/13
Accepted
06/17/13
Disclosure of Potential Conflicts of Interest
No potential conflicts of interest were disclosed.
Supplementary Material
Supplementary materials may be found here:
http://www.landesbioscience.com/journals/epigenetics/article/25430
References
- Rakyan VK, Down TA, Thorne NP, Flicek P, Kulesha E, Gräf S, et al. An integrated resource for genome-wide identification and analysis of human tissue-specific differentially methylated regions (tDMRs). Genome Res 2008; 18:1518 - 29; http://dx.doi.org/10.1101/gr.077479.108; PMID: 18577705
- Christensen BC, Houseman EA, Marsit CJ, Zheng S, Wrensch MR, Wiemels JL, et al. Aging and environmental exposures alter tissue-specific DNA methylation dependent upon CpG island context. PLoS Genet 2009; 5:e1000602; http://dx.doi.org/10.1371/journal.pgen.1000602; PMID: 19680444
- Baron U, Türbachova I, Hellwag A, Eckhardt F, Berlin K, Hoffmuller U, et al. DNA methylation analysis as a tool for cell typing. Epigenetics 2006; 1:55 - 60; http://dx.doi.org/10.4161/epi.1.1.2643; PMID: 17998806
- Bocker MT, Hellwig I, Breiling A, Eckstein V, Ho AD, Lyko F. Genome-wide promoter DNA methylation dynamics of human hematopoietic progenitor cells during differentiation and aging. Blood 2011; 117:e182 - 9; http://dx.doi.org/10.1182/blood-2011-01-331926; PMID: 21427290
- Ji H, Ehrlich LI, Seita J, Murakami P, Doi A, Lindau P, et al. Comprehensive methylome map of lineage commitment from haematopoietic progenitors. Nature 2010; 467:338 - 42; http://dx.doi.org/10.1038/nature09367; PMID: 20720541
- Teschendorff AE, Menon U, Gentry-Maharaj A, Ramus SJ, Gayther SA, Apostolidou S, et al. An epigenetic signature in peripheral blood predicts active ovarian cancer. PLoS ONE 2009; 4:e8274; http://dx.doi.org/10.1371/journal.pone.0008274; PMID: 20019873
- Wang L, Aakre JA, Jiang R, Marks RS, Wu Y, Chen J, et al. Methylation markers for small cell lung cancer in peripheral blood leukocyte DNA. J Thorac Oncol 2010; 5:778 - 85; http://dx.doi.org/10.1097/JTO.0b013e3181d6e0b3; PMID: 20421821
- Marsit CJ, Koestler DC, Christensen BC, Karagas MR, Houseman EA, Kelsey KT. DNA methylation array analysis identifies profiles of blood-derived DNA methylation associated with bladder cancer. J Clin Oncol 2011; 29:1133 - 9; http://dx.doi.org/10.1200/JCO.2010.31.3577; PMID: 21343564
- Pedersen KS, Bamlet WR, Oberg AL, de Andrade M, Matsumoto ME, Tang H, et al. Leukocyte DNA methylation signature differentiates pancreatic cancer patients from healthy controls. PLoS ONE 2011; 6:e18223; http://dx.doi.org/10.1371/journal.pone.0018223; PMID: 21455317
- Koestler DC, Marsit CJ, Christensen BC, Accomando W, Langevin SM, Houseman EA, et al. Peripheral blood immune cell methylation profiles are associated with nonhematopoietic cancers. Cancer Epidemiol Biomarkers Prev 2012; 21:1293 - 302; http://dx.doi.org/10.1158/1055-9965.EPI-12-0361; PMID: 22714737
- Reinius LE, Acevedo N, Joerink M, Pershagen G, Dahlén SE, Greco D, et al. Differential DNA methylation in purified human blood cells: implications for cell lineage and studies on disease susceptibility. PLoS ONE 2012; 7:e41361; http://dx.doi.org/10.1371/journal.pone.0041361; PMID: 22848472
- Langevin SM, Koestler DC, Christensen BC, Butler RA, Wiencke JK, Nelson HH, et al. Peripheral blood DNA methylation profiles are indicative of head and neck squamous cell carcinoma: an epigenome-wide association study. Epigenetics 2012; 7:291 - 9; http://dx.doi.org/10.4161/epi.7.3.19134; PMID: 22430805
- Marsit C, Christensen B. Blood-derived DNA methylation markers of cancer risk. Adv Exp Med Biol 2013; 754:233 - 52; http://dx.doi.org/10.1007/978-1-4419-9967-2_12; PMID: 22956505
- Hou L, Zhu ZZ, Zhang X, Nordio F, Bonzini M, Schwartz J, et al. Airborne particulate matter and mitochondrial damage: a cross-sectional study. Environ Health 2010; 9:48; http://dx.doi.org/10.1186/1476-069X-9-48; PMID: 20696069
- Adalsteinsson BT, Gudnason H, Aspelund T, Harris TB, Launer LJ, Eiriksdottir G, et al. Heterogeneity in white blood cells has potential to confound DNA methylation measurements. PLoS ONE 2012; 7:e46705; http://dx.doi.org/10.1371/journal.pone.0046705; PMID: 23071618
- Wieczorek G, Asemissen A, Model F, Turbachova I, Floess S, Liebenberg V, et al. Quantitative DNA methylation analysis of FOXP3 as a new method for counting regulatory T cells in peripheral blood and solid tissue. Cancer Res 2009; 69:599 - 608; http://dx.doi.org/10.1158/0008-5472.CAN-08-2361; PMID: 19147574
- Sehouli J, Loddenkemper C, Cornu T, Schwachula T, Hoffmüller U, Grützkau A, et al. Epigenetic quantification of tumor-infiltrating T-lymphocytes. Epigenetics 2011; 6:236 - 46; http://dx.doi.org/10.4161/epi.6.2.13755; PMID: 20962591
- Houseman EA, Accomando WP, Koestler DC, Christensen BC, Marsit CJ, Nelson HH, et al. DNA methylation arrays as surrogate measures of cell mixture distribution. BMC Bioinformatics 2012; 13:86; http://dx.doi.org/10.1186/1471-2105-13-86; PMID: 22568884
- Liu Y, Aryee MJ, Padyukov L, Fallin MD, Hesselberg E, Runarsson A, et al. Epigenome-wide association data implicate DNA methylation as an intermediary of genetic risk in rheumatoid arthritis. Nat Biotechnol 2013; 31:142 - 7; http://dx.doi.org/10.1038/nbt.2487; PMID: 23334450
- Lam LL, Emberly E, Fraser HB, Neumann SM, Chen E, Miller GE, et al. Factors underlying variable DNA methylation in a human community cohort. Proc Natl Acad Sci USA 2012; 109:Suppl 2 17253 - 60; http://dx.doi.org/10.1073/pnas.1121249109; PMID: 23045638
- Johnson WE, Li C, Rabinovic A. Adjusting batch effects in microarray expression data using empirical Bayes methods. Biostatistics 2007; 8:118 - 27; http://dx.doi.org/10.1093/biostatistics/kxj037; PMID: 16632515
- Chung FM, Tsai JC, Chang DM, Shin SJ, Lee YJ. Peripheral total and differential leukocyte count in diabetic nephropathy: the relationship of plasma leptin to leukocytosis. Diabetes Care 2005; 28:1710 - 7; http://dx.doi.org/10.2337/diacare.28.7.1710; PMID: 15983324
- Lewis SA, Pavord ID, Stringer JR, Knox AJ, Weiss ST, Britton JR. The relation between peripheral blood leukocyte counts and respiratory symptoms, atopy, lung function, and airway responsiveness in adults. Chest 2001; 119:105 - 14; http://dx.doi.org/10.1378/chest.119.1.105; PMID: 11157591
- Nadif R, Siroux V, Oryszczyn MP, Ravault C, Pison C, Pin I, et al. Epidemiological study on the Genetics and Environment of Asthma (EGEA). Heterogeneity of asthma according to blood inflammatory patterns. Thorax 2009; 64:374 - 80; http://dx.doi.org/10.1136/thx.2008.103069; PMID: 19131450
- Baccarelli A, Wright R, Bollati V, Litonjua A, Zanobetti A, Tarantini L, et al. Ischemic heart disease and stroke in relation to blood DNA methylation. Epidemiology 2010; 21:819 - 28; http://dx.doi.org/10.1097/EDE.0b013e3181f20457; PMID: 20805753
- Kim M, Long TI, Arakawa K, Wang R, Yu MC, Laird PW. DNA methylation as a biomarker for cardiovascular disease risk. PLoS ONE 2010; 5:e9692; http://dx.doi.org/10.1371/journal.pone.0009692; PMID: 20300621
- Mill J, Tang T, Kaminsky Z, Khare T, Yazdanpanah S, Bouchard L, et al. Epigenomic profiling reveals DNA-methylation changes associated with major psychosis. Am J Hum Genet 2008; 82:696 - 711; http://dx.doi.org/10.1016/j.ajhg.2008.01.008; PMID: 18319075
- Zhu X, Liang J, Li F, Yang Y, Xiang L, Xu J. Analysis of associations between the patterns of global DNA hypomethylation and expression of DNA methyltransferase in patients with systemic lupus erythematosus. Int J Dermatol 2011; 50:697 - 704; http://dx.doi.org/10.1111/j.1365-4632.2010.04804.x; PMID: 21595664
- Alegría-Torres JA, Barretta F, Batres-Esquivel LE, Carrizales-Yáñez L, Pérez-Maldonado IN, Baccarelli A, et al. Epigenetic markers of exposure to polycyclic aromatic hydrocarbons in Mexican brickmakers: a pilot study. Chemosphere 2013; 91:475 - 80; http://dx.doi.org/10.1016/j.chemosphere.2012.11.077; PMID: 23305747
- Joubert BR, Håberg SE, Nilsen RM, Wang X, Vollset SE, Murphy SK, et al. 450K epigenome-wide scan identifies differential DNA methylation in newborns related to maternal smoking during pregnancy. Environ Health Perspect 2012; 120:1425 - 31; PMID: 22851337
- Thapar M, Covault J, Hesselbrock V, Bonkovsky HL. DNA methylation patterns in alcoholics and family controls. World J Gastrointest Oncol 2012; 4:138 - 44; http://dx.doi.org/10.4251/wjgo.v4.i6.138; PMID: 22737275
- Byun HM, Nordio F, Coull BA, Tarantini L, Hou L, Bonzini M, et al. Temporal stability of epigenetic markers: sequence characteristics and predictors of short-term DNA methylation variations. PLoS ONE 2012; 7:e39220; http://dx.doi.org/10.1371/journal.pone.0039220; PMID: 22745719
- Bryk JA, Popovic PJ, Zenati MS, Munera V, Pribis JP, Ochoa JB. Nature of myeloid cells expressing arginase 1 in peripheral blood after trauma. J Trauma 2010; 68:843 - 52; PMID: 19996805
- Laird PW. Principles and challenges of genomewide DNA methylation analysis. Nat Rev Genet 2010; 11:191 - 203; http://dx.doi.org/10.1038/nrg2732; PMID: 20125086
- Leek JT, Storey JD. Capturing heterogeneity in gene expression studies by surrogate variable analysis. PLoS Genet 2007; 3:1724 - 35; http://dx.doi.org/10.1371/journal.pgen.0030161; PMID: 17907809
- Sun Z, Chai HS, Wu Y, White WM, Donkena KV, Klein CJ, et al. Batch effect correction for genome-wide methylation data with Illumina Infinium platform. BMC Med Genomics 2011; 4:84; http://dx.doi.org/10.1186/1755-8794-4-84; PMID: 22171553
- Teschendorff AE, Zhuang J, Widschwendter M. Independent surrogate variable analysis to deconvolve confounding factors in large-scale microarray profiling studies. Bioinformatics 2011; 27:1496 - 505; http://dx.doi.org/10.1093/bioinformatics/btr171; PMID: 21471010
- Miller GE, Chen E, Fok AK, Walker H, Lim A, Nicholls EF, et al. Low early-life social class leaves a biological residue manifested by decreased glucocorticoid and increased proinflammatory signaling. Proc Natl Acad Sci USA 2009; 106:14716 - 21; http://dx.doi.org/10.1073/pnas.0902971106; PMID: 19617551
- Koestler DC, Avissar-Whiting M, Houseman EA, Karagas MR, Marsit CJ. Differential DNA Methylation in Umbilical Cord Blood of Infants Exposed to Low Levels of Arsenic in Utero. Environ Health Perspect 2013; In press