
Abstract
The identification of genes that are differentially methylated in colorectal cancer (CRC) has potential value for both diagnostic and therapeutic interventions specifically in high-risk populations such as African Americans (AAs). However, DNA methylation patterns in CRC, especially in AAs, have not been systematically explored and remain poorly understood. Here, we performed DNA methylome profiling to identify the methylation status of CpG islands within candidate genes involved in critical pathways important in the initiation and development of CRC. We used reduced representation bisulfite sequencing (RRBS) in colorectal cancer and adenoma tissues that were compared with DNA methylome from a healthy AA subject’s colon tissue and peripheral blood DNA. The identified methylation markers were validated in fresh frozen CRC tissues and corresponding normal tissues from AA patients diagnosed with CRC at Howard University Hospital. We identified and validated the methylation status of 355 CpG sites located within 16 gene promoter regions associated with CpG islands. Fifty CpG sites located within CpG islands—in genes ATXN7L1 (2), BMP3 (7), EID3 (15), GAS7 (1), GPR75 (24), and TNFAIP2 (1)—were significantly hypermethylated in tumor vs. normal tissues (P < 0.05). The methylation status of BMP3, EID3, GAS7, and GPR75 was confirmed in an independent, validation cohort. Ingenuity pathway analysis mapped three of these markers (GAS7, BMP3 and GPR) in the insulin and TGF-β1 network—the two key pathways in CRC. In addition to hypermethylated genes, our analysis also revealed that LINE-1 repeat elements were progressively hypomethylated in the normal-adenoma-cancer sequence. We conclude that DNA methylome profiling based on RRBS is an effective method for screening aberrantly methylated genes in CRC. While previous studies focused on the limited identification of hypermethylated genes, ours is the first study to systematically and comprehensively identify novel hypermethylated genes, as well as hypomethylated LINE-1 sequences, which may serve as potential biomarkers for CRC in African Americans. Our discovered biomarkers were intimately linked to the insulin/TGF-B1 pathway, further strengthening the association of diabetic disorders with colon oncogenic transformation.
Keywords: :
Introduction
Colorectal cancer (CRC) arises from successive accumulation of genetic and epigenetic alterations during oncogenic transformation. DNA methylation is one of the most important epigenetic events that is thought to occur during the early stages of such oncogenic transformation.Citation1,Citation2 Early detection of colonic lesions is the most effective approach to reduce CRC incidence and mortality.Citation3 Therefore, molecular studies aimed at the identification of CRC-specific methylation markers may provide useful insights for our better understanding of CRC progression.Citation4,Citation5
DNA methylation of a number of genes and their significance in CRC has been reported.Citation1-Citation7 The hypermethylation of several gene promoters including APC, p16INK4a, and TIMP3 in CRCCitation8,Citation9 and other tumor suppressor genes were investigated by qualitative and quantitative approaches such as MSP, qPCR, and pyrosequencing.Citation10 The aberrant methylation of CpG islands within gene promoters and/or first exonic/intronic regions is a recognized epigenetic event that leads to transcriptional silencing of corresponding tumor suppressor genes in CRC and other cancers. Regardless of the biological consequences of methylation-induced silencing of tumor suppressor genes, this epigenetic alteration constitutes molecular signatures that can serve as promising biomarkers for early detection.Citation5,Citation6 Many genes are silenced by aberrant methylation in CRC, such genes have the potential to become useful biomarkers for early detection of colorectal neoplasia but need first to be validated using genome wide studies.Citation5,Citation6,Citation11,Citation12 The ability to detect aberrant DNA methylation from a wide range of biological specimens, including blood, stool, and paraffin-embedded formalin-fixed tissue, highlights its robustness and excellent potential to detect markers of clinical utility. In addition, DNA methylation patterns can be applied for the molecular classification of neoplasms as well as for the prediction of therapeutic responsiveness and prognosis.Citation7,Citation8 Finally, epigenetic therapy, as such, has been shown to be effective in treating hematologic malignancies and might be useful for treating solid organs cancers, including CRC.Citation9,Citation10,Citation13-Citation15 As our understanding for the role of epigenetic alterations in colon carcinogenesis improves, epigenetic-based therapies for CRC might be developed. In addition, the identification of the epigenetically deregulated signaling pathways may provide prudent means of selecting CRC patients who will be particularly responsive to targeted therapies.Citation5-Citation8,Citation16 We have shown that the prevalence and the incidence of colorectal cancer in the African American population is worse than the general population,Citation17-Citation24 and studies are underway to investigate the risk factors for this disparity. Therefore, epigenetic determinants are part of the parameters that need to be investigated in CRC from AA population. Our hypothesis was that there may be novel DNA methylation which contributes to CRC.
Quantitative approaches to identify DNA methylation differences between normal and cancer tissues could lead to the identification of a panel of highly specific methylated markers for the early detection of cancer. A systematic and comprehensive assessment of aberrantly methylated genes in CRCs has the potential not only to improve our understanding of the molecular biology of CRC, but also in the identification of methylated genes that might influence the clinical management of patients afflicted with this disease. In this study, we evaluated the methylation of cancer-associated genes in AAs, a population at high risk of CRC. We analyzed methylation profiles of ~1.5 million CpG sites encompassing more than 21 500 CpG Islands, spanning more than 17 000 genes and noncoding regions using EpiQuest™ DNA Methylation Analysis platform and Reduced Representation Bisulfite Sequencing (RRBS) technology.Citation25,Citation26 We introduced novel DNA methylation as an epigenetic factor that could be involved in CRC pathogenesis.
Results
Global methylation analysis revealed candidate genes
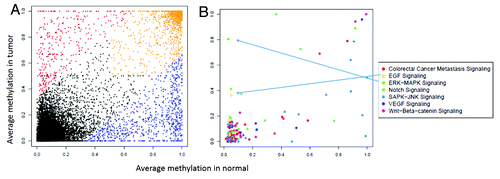
Sequencing data from the 6 samples that underwent genome-wide RRBS analysis (2 AA CRCs, 2 AA adenomas, and a blood and a normal colon tissue) were analyzed as described above in paired-wise fashion to determine differentially methylated CpG sites with relevance to colorectal neoplasia. displays the differences in methylation of the Long INterspersed Elements (LINE) in the genome. The data reflects a decrease in the methylation levels of these sequences from normal to cancer samples (). When comparing the methylation levels in coding and promoter regions, there were clear differences in methylation patterns between normal and adenoma (), as well as between normal and cancer samples (). These analyses displayed many specifically methylated sites in the colonic lesions that belong to known carcinogenic pathways ( and , Insets).
Figure 1. Ratio of average methylation in LINE regions to average methylation of the total genome (average methylation defined as fraction of CpG sites with methylation > 0.5).
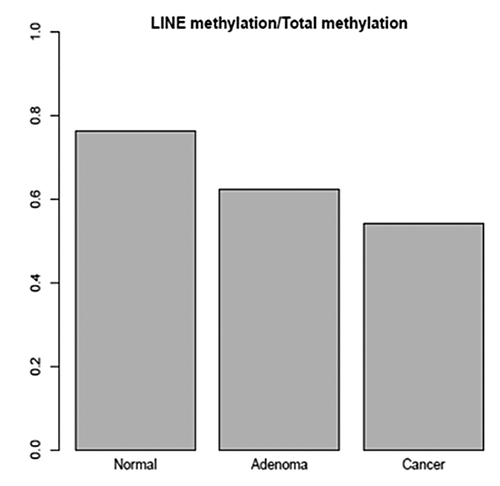
Figure 2. (A) Average methylation of promoter regions in normal and colon adenoma based on RefSeq genes annotations. Promoters that were hypermethylated only in normal colon are shown in red, while those hypermethylated only in colon adenoma are in blue, and promoters hypermethylated in both are shaded in orange. (B) Promoters from A filtered to include genes associated with various Gene Ontology (GO) terms. The Y-axis shows the average methylation in normal and the X-axis shows the average methylation in colonic adenomas.
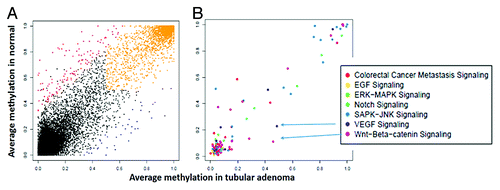
Figure 3. (A) Average methylation of promoters in tumor and normal based on RefSeq genes annotations. Promoters that were hypermethylated only in tumor are shown in red, those hypermethylated only in normal in blue and promoters hypermethylated in both are shaded orange. (B) Promoters from 3A filtered to include genes associated with various Gene Ontology (GO) terms. The Y-axis shows the average methylation in tumor and the X-axis shows the average in normal colon.
After sequence analysis and alignment to reference sequences, 355 CpG sites were found to be specifically methylated in CRCs from AA patients. These CpG sites were located in 14 promoter regions of 13 genes, including ACTB, ATXN7L1 (ampilicon 2 [amp 2]), BMP3, CDH5, EID3, GAS7 (amp1), GNAS, GPR75 (amp 2), HNRNPF (amp 1), NDRG4 (amp 1), Sept9, SPAG5-AS1, and TNFAIP2 (amp1 and amp2). The amplicons coordinates for the genes are listed in Table S1. These genes were further analyzed with regards to their relevance to colon cancer, other cancers, any pathology, and known carcinogenic pathways (WNT, EGFR, NOTCH pathways). Fifty CpG sites that showed the highest degree of differential methylation were located within six genes, namely: ATXN7L1 (2), BMP3 (7), EID3 (15), GAS7 (1), GPR75 (24), and TNFAIP2 (1), which were further investigated in an independent validation set.
Validation of the methylation status of the identified markers
Forty-two samples were used for the validation experiments. These samples correspond to cancer and corresponding matched normal tissues pairs.
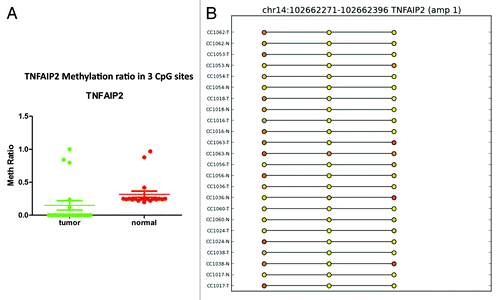
For the GPR75 gene, the methylation profile was successfully validated in 22 samples out of 42 that passed the validation test. Twenty-seven CpG sites in the GRP75 promoter were significantly (P < 0.0001) hypermethylated in cancer tissues compared with matched normal (). For EID3 (EP300 interacting inhibitor of differentiation 3), 34 of 42 samples passed validation. In tumor tissues, 17 CpG sites in the promoter region of EID3 showed higher methylation than normal tissues (). Twenty-four of 42 samples passed the methylation validation for BMP3. Comparison of 27 CpG sites in the validation set revealed hypermethylation (P < 0.0001) of BMP3 (bone morphogenetic protein 3) in tumor tissues (). GAS7 (growth arrest-specific 7 isoform) is expressed primarily in terminally differentiated brain cells and predominantly in mature cerebellar Purkinje neurons. Our data shows that in 18 validated samples, 17 CpG sites () were significantly (P < 0.0001) hypermethylated in tumor tissues. In contrast, in 24 validated samples the analysis of 3 CpG sites () in the promoter region of TNFAIP2 (tumor necrosis factor α-induced protein 2) showed hypomethylation (P < 0.0002) in tumor samples ().
Figure 4. RRBS CpG methylation validation via targeted bisulfite sequencing for GPR75 in colon cancer. (A) Validation of 27 CpG sites in cancer tissues compared with corresponding matched normal tissues (n = 22). CpG sites from the tumor group are plotted in red and CpG sites from the normal tissue group are shown in green. The Y-axis shows the average methylation and the X-axis shows the type of samples. This region of GPR75 promoter as a whole was significantly (P < 0.0001) hypermethylated in the tumor group. (B) The CpG sites depicted as lollipop and the color indicates the level of methylation from higher to lower in yellow > orange > red order.
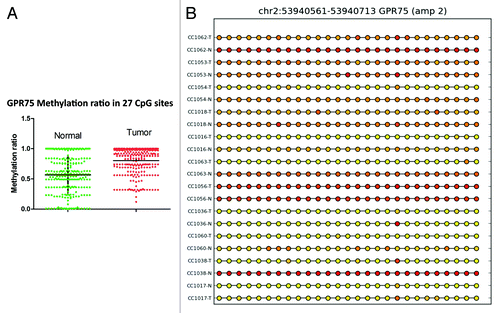
Figure 5. RRBS CpG methylation validation via targeted bisulfite sequencing for EID3 in colon cancer. (A) Validation of 17 CpG sites in cancer tissues compared with their corresponding matched normal tissues (n = 34). CpG sites from the tumor group are plotted in red and CpG sites from the normal tissue group are shown in green. The Y axis shows the average methylation and the X-axis shows the type of samples. This region of EID3 promoter as a whole was significantly (P < 0.0001) hypermethylated in the tumor group. (B) The CpG sites depicted as lollipop and the color indicate the level of methylation from higher to lower in yellow > orange > red order.
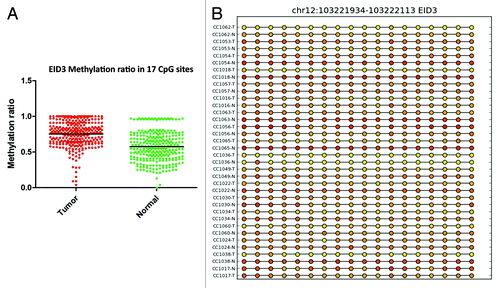
Figure 6. RRBS CpG methylation validation via targeted bisulfite sequencing for BMP3 in colon cancer. (A) Validation of 27 CpG sites in cancer tissues compared with their corresponding matched normal tissues (n = 24). CpG sites from the tumor group are plotted in red and CpG sites from the normal tissues group are shown in green. The Y-axis shows the average methylation and the X-axis shows the type of samples. This region of BMP3 promoter as a whole was significantly (P < 0.0001) hypermethylated in the tumor group. (B) The CpG sites depicted as lollipop and the color indicates the level of methylation from higher to lower in yellow > orange > red order.
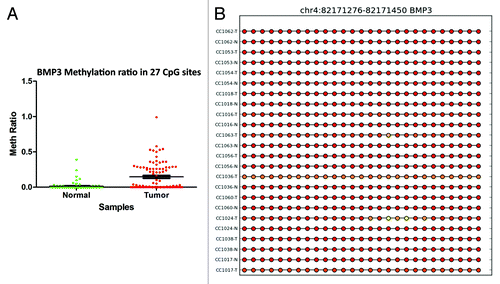
Figure 7. RRBS CpG methylation validation via targeted bisulfite sequencing for GAS7 in colon cancer. (A) Validation of 17 CpG sites in cancer tissues compared with their corresponding matched normal tissues (n = 18). CpG sites from the tumor group are plotted in red and CpG sites from the normal tissues group are shown in green. The Y-axis shows the average methylation and the X-axis shows the type of samples. This region of the GAS7 promoter as a whole was significantly (P < 0.0001) hypermethylated in the tumor group. (B) The CpG sites depicted as lollipop and the color indicates the level of methylation from higher to lower in yellow > orange > red order. CpG sites with no available data are represented by straight lines for two samples (CC1063N and CC1017N).
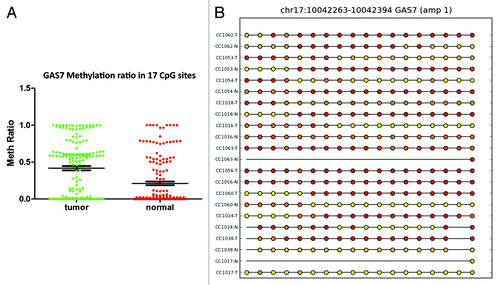
Figure 8. RRBS CpG methylation validation via targeted bisulfite sequencing for TNFAIP2 in colon cancer. (A) Validation of 3 CpG site in cancer tissues compared with their corresponding matched normal tissues (n = 24). CpG sites from the tumor group are plotted in red and CpG sites from the normal tissue group are shown in green. The Y-axis shows the average methylation and the X-axis shows the type of samples. This region of TNFAIP2 promoter as a whole was significantly (P < 0.0002) hypermethylated in the tumor group. (B) The CpG sites depicted as lollipop and the color indicates the level of methylation from higher to lower in yellow > orange > red order.
Ingenuity Pathway Analysis
The markers that have passed the methylation validation—GPR75, EID3, GAS7, and BMP3— were further analyzed using the Ingenuity Pathways Analysis software. Both BMP3 and GAS7 were located within the network of insulin and TGF-β1. It is also of interest that while GPR75 was not located in this network, other GPR proteins such as GPR19, GPR123, and GPR146 were also located in this same network along with GAS7 and BMP3 (Fig. S1). EID3, the other gene that was validated, was located on a different network, where SMC and Sept proteins were prevalent pointing to a different level of involvement when compared with the other validated genes (Fig. S2).
Discussion
A wide variety of methodological approaches have been applied for the determination of DNA methylation status in human tissues, particularly cancer tissues. Qualitative (MSP) and quantitative (Q-PCR, MethyLight, Bisulfite pyrosequencing) techniques have been widely used. These techniques, however, are still used at the gene-specific level. High-throughput technologies, such as methylation microarrays and next generation sequencing, have helped advance our understanding of epigenetic studies to the genomic level. We have recently published a microarray methylome study that illustrated a genome-wide methylation-based clustering of different genes and loci in colorectal neoplasia specimens as a function of disease status.Citation11 Herein, we used the reduced representation bisulfite sequencing (RRBS) to analyze methylome profiles in different colon tissues and validated a subset of highly methylated targets in an independent cohort of colorectal specimens.
RRBS, like some of the other methylation techniques, uses sodium bisulfite modified DNA that is digested with specific restriction endonucleases that enrich for GC rich regions allowing a focused sequencing of primarily CpG rich genomic regions. The application of this technique in the context of our study led to the identification of several potential markers that were selected based on the analysis of different combinations of pairs of samples (normal vs. adenoma, adenoma vs. cancer, and normal vs. cancer).
The global methylation of non-coding repetitive elements revealed a gradual hypomethylation of LINE sequences during the progression of colorectal carcinogenesis. Cancer samples showed less methylation in LINE sequences than adenoma samples and adenoma samples had even lower methylation of these repeat elements than normal colonic mucosa samples. Interestingly, this was a very specific phenomenon for LINE elements only, as we did not observe a similar methylation pattern for SINE sequences, which displayed very similar levels of methylation between various types of analyzed tissues. For a while, these sequences were referred to as “junk DNA” with no known functions. However, recent studies, primarily from the ENCODE project,Citation27-Citation31 have revealed that these sequences play major roles in DNA expression and regulation. More specifically, a recent study by Hur et al. has reported that LINE-1 hypomethylation led to the activation of multiple oncogenes in CRC, thus providing a mechanistic explanation for one of the biological roles of LINE elements hypomethylation in colon cancer.Citation32 These findings are of interest as they reflect the way methylation alterations also facilitate the recruitment of oncogenes in the carcinogenic pathway. The expression of these genes seems to be unleashed by hypomethylation of regulatory regions embedded within LINE sequences. A similar active role of LINE-1 hypomethylation in colorectal tumor development has been recently cited in Caucasians.Citation33
With regards to gene promoter regions, data analysis, and filtering led to the identification of specific CpG sites that were located within the following genes; ATXN7L1 (2), BMP3 (7), EID3 (15), GAS7 (1), GPR75 (24), and TNFAIP2 (1). Validation experiments allowed 4 of these genes to be successfully confirmed as potential methylation markers.
EID3, which was confirmed as a potential methylation marker, acts as a repressor of nuclear receptor-dependent transcription possibly by interfering with CREBBP-dependent co-activation.Citation34,Citation35 This gene may function as a co-inhibitor of other CREBBP/EP300-dependent transcription factors. Its methylation/silencing likely unleashes the expression of several genes that promote cell proliferation and division. IPA analysis positioned this gene within a network of Sept proteins, of which Sept9, a CRC stool marker, is a member.Citation36,Citation37 The association of EID3 with such a well-established marker further confirms the validity of the RRBS based data.
More interestingly, the other validated genes, BMP3 and GAS7, were located in a network of pathways that involve TGF-β1and insulin. While GPR75 was not located in this same network, probably because of lack of related functional data, other GPR proteins were within the TGF-β1network. The co-positioning of these methylated markers in the same pathway along with insulin and TGF-β1 is of relevance as it puts colon neoplasia in the larger context of diabetes associated molecules such as insulin and TGF-β1. African Americans are indeed well known to carry a heavier load of diabetes than the general population.Citation38,Citation39 Indeed, increased insulin production is common during neoplastic transformation. This is probably linked to the hormone signaling pathway, which have many elements in common with several growth factors signaling pathways such as TGF-β1. Higher levels of this growth factor have been reported in the serum of several types of cancer patients. In addition, it has been reported that insulin signaling directly interacts with that of the ras oncogene.Citation40 It is noteworthy that BMP3 methylation in stools has been found to be associated with CRC in IBD patients.Citation41 However, very few publications are available about these 4 markers, which attest to their status as novel markers in CRC.
The validation of the 3 methylated markers linked to the insulin/ TGF-β1network is highly significant and reliable. Indeed, when trying to validate another known methylation marker, CHD5, a well-established marker,Citation5,Citation22,Citation42 this marker did not pass the validation test. Also, another marker that was methylated in the genome-wide analyzed samples (TNFAIP2) turned out to be hypomethylated in the validation set. There are some genes (NDRG, Sept9,..) for which methylation status has already been established in other population, such as Caucasians. However, for the 4 genes (EID3, BMP3, GAS7, and GPR75) we report in African American patients, there are no other reports except for GAS7, which was reported in a recent Korean publication. For the other three genes, our report is the first in the context of colorectal cancer.Citation16 GAS7 hypermethylation has recently been shown in CRC compared with normal mucosa in Korean population, but no functional studies have been performed yet.Citation16 In another study of breast cancer, it has been shown that GAS7 and BMP3 harbor major epigenetic differences that affect gene expression and play a role in the induction and maintenance of different phenotypes.Citation43 No epigenetic data available for GPR75 or EID3 in any population. Therefore, their function analyses need to be further dissected.
As such, we can unequivocally report the detection of 4 novel methylation genes targets (EID3, BMP3, GAS7, and GPR75) in African American patients, since the validation cohort was primarily from this population. These 4 markers need to be validated in other populations and their function analyzed to further dissect their correlations to other known pathways, especially the insulin/growth factors ones.
As for the TNFAIP2 gene, this gene was found to be hypomethylated in the gene specific RRBS-analyzed validation cohort. This finding is more in line with its involvement in invasion and metastasis.Citation44 We are aware of the limitations of this study, such as the samples size, but due to the high cost and labor associated with the RRBS methodology, the number of samples in the validation set enhances the credibility of the RRBS genome wide results. As the technology becomes more accessible and cheaper, we plan larger size studies.
We recently reported a list of methylated genes that have been shown to be methylated in several studies but never made it to the CIMP gene list.Citation11 Of this list of 15 genes (table #), 4 were methylated in this RRBS data set. These genes, SFRP1, 3OST2, LAMA1, and KCNQ5, might be eligible now to make the CIMP gene list, since our RRBS data reflect their methylation status in the analyzed samples.
In conclusion, we here report the hypomethylation of LINE sequences in the path to colon oncogenic transformation. We also report new methylation markers associated with colon cancer in African Americans using genome-wide reduced representation bisulfite sequencing. Three of the markers identified here were associated with the insulin and TGF-β1pathway, stressing the correlation of growth factors and diabetes with colon oncogenic transformation.
Materials and Methods
Patients and tissue samples
The samples were collected from surgically removed colonic specimens received by the department of Pathology, Howard University Hospital. All samples were collected by an expert surgical pathologist from the operating room immediately after the surgical resection.
For the initial exploration of differential methylome profiling between patients with colorectal neoplasia vs. healthy subjects, DNA was extracted from 6 samples including 4 fresh frozen colonic lesions (2 adenomas and 2 CRC tumors) and a peripheral blood specimen as well as a normal colon tissue from an AA patient with a normal colonoscopy outcome. First, the blood DNA methylation profile was compared with that from the normal colon tissue to establish normal colon methylation pattern. Thereafter, pairwise comparisons between differentially methylated genes in adenoma vs. normal, cancer vs. normal, and adenoma vs. cancer led to the establishment of a list of genes that were specifically methylated in patients with colorectal neoplasia. The top 200 methylated genes in each list were further searched in the literature with regards to their involvement in cancer, colon cancer, or known cancer pathways (WNT, NOTCH, EGFR).
For the validation of the results obtained from the genome-wide methylation analysis, 42 pathologically confirmed CRC/matched normal cases, were selected. For these pairs of samples, tumor tissues were carefully identified by an expert pathologist, and the corresponding matched normal tissues were resected from the unaffected part of the colon at least 10 cm away from the tumor mass. Demographic, clinical, and pathological data for each patient were also obtained. Official informed consent was obtained from all participants. The research protocol was approved by Howard University Institutional Review Board.
DNA extraction
Genomic DNA from fresh frozen tissues was homogenized in lysis buffer consisting of 100 mM Tris–HCl (pH 8.5), 5 mM EDTA, 0.2% SDS, 200 mM NaCl. Proteinase K was freshly added at a final concentration of 300 µg/ml. Samples were incubated overnight at 55 °C to ensure that genomic DNA is completely dissociated from any contaminating nucleosomal or DNA binding proteins. After digestion, genomic DNA was extracted using a Qiagen’s genomic DNA extraction kit according to the manufacturer’s instructions. DNA quality and quantity was assessed using a NanoDrop spectrophotometer and also visualized using 0.8% agarose gel.
EpiQuest library construction
EpiQuest libraries were prepared from 200–500 ng genomic DNA digested with 60 units of TaqI and 30 units of MspI (NEB) sequentially. Size-selected TaqI-MspI fragments (40–120 bp and 120–350 bp) were filled-in and 3′-terminal-A extended, extracted with Zymo Research (ZR) DNA Clean and Concentrator™-5 kit. Ligation to pre-annealed adapters containing 5′- methyl-cytosine instead of cytosine was performed using the Illumina’s DNA preparation kit and protocol. Purified, adaptor ligated fragments were bisulfite-treated using the EZ DNA Methylation-Direct™ Kit (Zymo Research). Preparative-scale PCR was performed and DNA Clean and Concentrator™ -purified PCR products were subjected to a final size selection on a 4% NuSieve 3:1 agarose gel. SYBR-green-stained gel slices containing adaptor-ligated fragments of 130–210 bp or 210–460 bp in size were excised. Library material was recovered from the gel (Zymoclean™ Gel DNA Recovery Kit, ZR) and sequenced on an Illumina HiSeq Genome Analyzer.
EpiQuest Sequence alignments and data analysis
Sequence reads from bisulfite-treated EpiQuest libraries were identified using standard Illumina base-calling software and then analyzed using a Zymo Research proprietary analysis pipeline. Residual cytosines (Cs) in each read were first converted to thymines (Ts), with each such conversion noted for subsequent analysis. A reference sequence database was constructed from the 50-bp ends of each computationally predicted MspI-TaqI fragment in the 40–350 bp size range. All Cs in each fragment end were then converted to Ts; the converted reads were aligned to the converted reference by Bowtie. The number of mismatches in the induced alignment was then counted between the unconverted read and reference, ignoring cases in which a T in the unconverted read was matched to a C in the unconverted reference. For a given read, the best alignment was kept if the second-best alignment had 2 more mismatches, otherwise the read was discarded as non-unique The methylation level of each sampled cytosine was estimated as the number of reads reporting a C, divided by the total number of reads reporting a C or T. Fisher’s exact test or t test was performed for each CpG site that has at least 5 reads covered. Also, promoter, gene body, and CpG island annotations were added for each CpG. The software pipeline is implemented in Python.
Validation of DNA Methylation results via Targeted Bisulfite Sequencing
Primer design and optimization
For 16 regions, 22 primers for targeted bisulfite sequencing were designed and validated by Zymo Research. The Primers were synthesized by Integrated DNA Technologies (IDT). The primers’ quality control (QC) included testing for specific amplification of 1 ng bisulfite DNA (done in duplicate) using converted DNA QC criteria, which included robust and specific amplification of the bisulfite primers on real-time PCR (Roche LC 480; Ct values less than 40 cycles and CV < 10% for duplicates).
Bisulfite conversion and multiplex amplification
Samples were subject to sodium bisulfite treatment using the EZ DNA Methylation-Direct™ Kit. Targeted amplification of 22 validated amplicons and 42 bisulfite samples was done via Fluidigm 48.48 Access Array using Zymo Research’s Targeted sequencing service protocol. Sample loading, harvesting, and pooling was performed according to manufacturer’s protocol (Fluidigm).
Barcoding/adapterization PCR
Amplicon pools for each sample were diluted 1:100 and then amplified using barcoded adaptor-linkers received from Fluidigm according to manufacturer’s protocols. Reactions were cleaned up using the DNA Clean and Concentrator™-5 and the products were normalized by concentration and pooled.
Sequencing, alignment, and data analysis
Libraries were denatured, diluted, and sequenced on the Illumina MiSeq according to manufacturer’s protocols. The sequencing run was a 150-base paired-end run. Sequence reads were aligned and analyzed as described above.
Additional material
Download Zip (633.5 KB)Disclosure of Potential Conflicts of Interest
No potential conflicts of interest were disclosed.
Acknowledgments
This project was supported (in part) by the National Institute on Minority Health and Health Disparities of the National Institutes of Health under Award Number G12MD007597.
References
- Shen L, Kantarjian H, Guo Y, Lin E, Shan J, Huang X, Berry D, Ahmed S, Zhu W, Pierce S, et al. DNA methylation predicts survival and response to therapy in patients with myelodysplastic syndromes. J Clin Oncol 2010; 28:605 - 13; http://dx.doi.org/10.1200/JCO.2009.23.4781; PMID: 20038729
- Stevens RG, Swede H, Heinen CD, Jablonski M, Grupka M, Ross B, Parente M, Tirnauer JS, Giardina C, Rajan TV, et al. Aberrant crypt foci in patients with a positive family history of sporadic colorectal cancer. Cancer Lett 2007; 248:262 - 8; http://dx.doi.org/10.1016/j.canlet.2006.08.003; PMID: 16950561
- Suehiro Y, Wong CW, Chirieac LR, Kondo Y, Shen L, Webb CR, Chan YW, Chan AS, Chan TL, Wu TT, et al. Epigenetic-genetic interactions in the APC/WNT, RAS/RAF, and P53 pathways in colorectal carcinoma. Clin Cancer Res 2008; 14:2560 - 9; http://dx.doi.org/10.1158/1078-0432.CCR-07-1802; PMID: 18451217
- Weisenberger DJ, Siegmund KD, Campan M, Young J, Long TI, Faasse MA, Kang GH, Widschwendter M, Weener D, Buchanan D, et al. CpG island methylator phenotype underlies sporadic microsatellite instability and is tightly associated with BRAF mutation in colorectal cancer. Nat Genet 2006; 38:787 - 93; http://dx.doi.org/10.1038/ng1834; PMID: 16804544
- Mokarram P, Kumar K, Brim H, Naghibalhossaini F, Saberi-firoozi M, Nouraie M, Green R, Lee E, Smoot DT, Ashktorab H. Distinct high-profile methylated genes in colorectal cancer. PLoS One 2009; 4:e7012; http://dx.doi.org/10.1371/journal.pone.0007012; PMID: 19750230
- Simmer F, Brinkman AB, Assenov Y, Matarese F, Kaan A, Sabatino L, Villanueva A, Huertas D, Esteller M, Lengauer T, et al. Comparative genome-wide DNA methylation analysis of colorectal tumor and matched normal tissues. Epigenetics 2012; 7:1355 - 67; http://dx.doi.org/10.4161/epi.22562; PMID: 23079744
- Easwaran H, Baylin SB. Epigenetic abnormalities in cancer find a “home on the range”. Cancer Cell 2013; 23:1 - 3; http://dx.doi.org/10.1016/j.ccr.2012.12.018; PMID: 23328477
- Pandiyan K, You JS, Yang X, Dai C, Zhou XJ, Baylin SB, Jones PA, Liang G. Functional DNA demethylation is accompanied by chromatin accessibility. Nucleic Acids Res 2013; 41:3973 - 85; http://dx.doi.org/10.1093/nar/gkt077; PMID: 23408854
- Kikuchi J, Takashina T, Kinoshita I, Kikuchi E, Shimizu Y, Sakakibara-Konishi J, Oizumi S, Marquez VE, Nishimura M, Dosaka-Akita H. Epigenetic therapy with 3-deazaneplanocin A, an inhibitor of the histone methyltransferase EZH2, inhibits growth of non-small cell lung cancer cells. Lung Cancer 2012; 78:138 - 43; http://dx.doi.org/10.1016/j.lungcan.2012.08.003; PMID: 22925699
- Yeo W, Chung HC, Chan SL, Wang LZ, Lim R, Picus J, Boyer M, Mo FK, Koh J, Rha SY, et al. Epigenetic therapy using belinostat for patients with unresectable hepatocellular carcinoma: a multicenter phase I/II study with biomarker and pharmacokinetic analysis of tumors from patients in the Mayo Phase II Consortium and the Cancer Therapeutics Research Group. J Clin Oncol 2012; 30:3361 - 7; http://dx.doi.org/10.1200/JCO.2011.41.2395; PMID: 22915658
- Ashktorab H, Rahi H, Wansley D, Varma S, Shokrani B, Lee E, Daremipouran M, Laiyemo A, Goel A, Carethers JM, et al. Toward a comprehensive and systematic methylome signature in colorectal cancers. Epigenetics 2013; 8:807 - 15; http://dx.doi.org/10.4161/epi.25497; PMID: 23975090
- Zhang Y, Li Q, Chen H. DNA methylation and histone modifications of Wnt genes by genistein during colon cancer development. Carcinogenesis 2013; 34:1756 - 63; http://dx.doi.org/10.1093/carcin/bgt129; PMID: 23598468
- Shen H, Laird PW. In epigenetic therapy, less is more. Cell Stem Cell 2012; 10:353 - 4; http://dx.doi.org/10.1016/j.stem.2012.03.012; PMID: 22482500
- Cervera E, Candelaria M, López-Navarro O, Labardini J, Gonzalez-Fierro A, Taja-Chayeb L, Cortes J, Gordillo-Bastidas D, Dueñas-González A. Epigenetic therapy with hydralazine and magnesium valproate reverses imatinib resistance in patients with chronic myeloid leukemia. Clin Lymphoma Myeloma Leuk 2012; 12:207 - 12; http://dx.doi.org/10.1016/j.clml.2012.01.005; PMID: 22420986
- Rius M, Lyko F. Epigenetic cancer therapy: rationales, targets and drugs. Oncogene 2012; 31:4257 - 65; http://dx.doi.org/10.1038/onc.2011.601; PMID: 22179827
- Kim YH, Lee HC, Kim SY, Yeom YI, Ryu KJ, Min BH, Kim DH, Son HJ, Rhee PL, Kim JJ, et al. Epigenomic analysis of aberrantly methylated genes in colorectal cancer identifies genes commonly affected by epigenetic alterations. Ann Surg Oncol 2011; 18:2338 - 47; http://dx.doi.org/10.1245/s10434-011-1573-y; PMID: 21298349
- Laiyemo AO, Doubeni C, Brim H, Ashktorab H, Schoen RE, Gupta S, Charabaty A, Lanza E, Smoot DT, Platz E, et al. Short- and long-term risk of colorectal adenoma recurrence among whites and blacks. Gastrointest Endosc 2013; 77:447 - 54; http://dx.doi.org/10.1016/j.gie.2012.11.027; PMID: 23337636
- Ashktorab H, Brim H, Al-Riyami M, Date A, Al-Mawaly K, Kashoub M, Al-Mjeni R, Smoot DT, Al-Moundhri M, Al-Hashemi S, et al. Sporadic colon cancer: mismatch repair immunohistochemistry and microsatellite instability in Omani subjects. Dig Dis Sci 2008; 53:2723 - 31; http://dx.doi.org/10.1007/s10620-007-0189-3; PMID: 18299982
- Ashktorab H, Nouraie M, Hosseinkhah F, Lee E, Rotimi C, Smoot D. A 50-year review of colorectal cancer in African Americans: implications for prevention and treatment. Dig Dis Sci 2009; 54:1985 - 90; http://dx.doi.org/10.1007/s10620-009-0866-5; PMID: 19554449
- Ashktorab H, Smoot DT, Carethers JM, Rahmanian M, Kittles R, Vosganian G, Doura M, Nidhiry E, Naab T, Momen B, et al. High incidence of microsatellite instability in colorectal cancer from African Americans. Clin Cancer Res 2003; 9:1112 - 7; PMID: 12631615
- Brim H, Lee E, Abu-Asab MS, Chaouchi M, Razjouyan H, Namin H, Goel A, Schäffer AA, Ashktorab H. Genomic aberrations in an African American colorectal cancer cohort reveals a MSI-specific profile and chromosome X amplification in male patients. PLoS One 2012; 7:e40392; http://dx.doi.org/10.1371/journal.pone.0040392; PMID: 22879877
- Fatemi M, Paul TA, Brodeur GM, Shokrani B, Brim H, Ashktorab H. Epigenetic silencing of CHD5, a novel tumor-suppressor gene, occurs in early colorectal cancer stages. Cancer 2014; 120:172 - 80; http://dx.doi.org/10.1002/cncr.28316; PMID: 24243398
- Nouraie M, Hosseinkhah F, Brim H, Zamanifekri B, Smoot DT, Ashktorab H. Clinicopathological features of colon polyps from African-Americans. Dig Dis Sci 2010; 55:1442 - 9; http://dx.doi.org/10.1007/s10620-010-1133-5; PMID: 20225129
- Smoot DT, Collins J, Dunlap S, Ali-Ibrahim A, Nouraie M, Lee EL, Ashktorab H. Outcome of colonoscopy in elderly African-American patients. Dig Dis Sci 2009; 54:2484 - 7; http://dx.doi.org/10.1007/s10620-009-0965-3; PMID: 19757049
- Gu H, Smith ZD, Bock C, Boyle P, Gnirke A, Meissner A. Preparation of reduced representation bisulfite sequencing libraries for genome-scale DNA methylation profiling. Nat Protoc 2011; 6:468 - 81; http://dx.doi.org/10.1038/nprot.2010.190; PMID: 21412275
- Meissner A, Gnirke A, Bell GW, Ramsahoye B, Lander ES, Jaenisch R. Reduced representation bisulfite sequencing for comparative high-resolution DNA methylation analysis. Nucleic Acids Res 2005; 33:5868 - 77; http://dx.doi.org/10.1093/nar/gki901; PMID: 16224102
- Birney E. The making of ENCODE: Lessons for big-data projects. Nature 2012; 489:49 - 51; http://dx.doi.org/10.1038/489049a; PMID: 22955613
- Ecker JR, Bickmore WA, Barroso I, Pritchard JK, Gilad Y, Segal E. Genomics: ENCODE explained. Nature 2012; 489:52 - 5; http://dx.doi.org/10.1038/489052a; PMID: 22955614
- Gerstein M. Genomics: ENCODE leads the way on big data. Nature 2012; 489:208; http://dx.doi.org/10.1038/489208b; PMID: 22972285
- Gerstein MB, Kundaje A, Hariharan M, Landt SG, Yan KK, Cheng C, Mu XJ, Khurana E, Rozowsky J, Alexander R, et al. Architecture of the human regulatory network derived from ENCODE data. Nature 2012; 489:91 - 100; http://dx.doi.org/10.1038/nature11245; PMID: 22955619
- Maher B. ENCODE: The human encyclopaedia. Nature 2012; 489:46 - 8; http://dx.doi.org/10.1038/489046a; PMID: 22962707
- Hur K, Cejas P, Feliu J, Moreno-Rubio J, Burgos E, Boland CR, Goel A. Hypomethylation of long interspersed nuclear element-1 (LINE-1) leads to activation of proto-oncogenes in human colorectal cancer metastasis. Gut 2013; Forthcoming http://dx.doi.org/10.1136/gutjnl-2012-304219; PMID: 23704319
- Benard A, van de Velde CJ, Lessard L, Putter H, Takeshima L, Kuppen PJ, Hoon DS. Epigenetic status of LINE-1 predicts clinical outcome in early-stage rectal cancer. Br J Cancer 2013; 109:3073 - 83; http://dx.doi.org/10.1038/bjc.2013.654; PMID: 24220694
- Båvner A, Matthews J, Sanyal S, Gustafsson JA, Treuter E. EID3 is a novel EID family member and an inhibitor of CBP-dependent co-activation. Nucleic Acids Res 2005; 33:3561 - 9; http://dx.doi.org/10.1093/nar/gki667; PMID: 15987788
- Guerineau M, Kriz Z, Kozakova L, Bednarova K, Janos P, Palecek J. Analysis of the Nse3/MAGE-binding domain of the Nse4/EID family proteins. PLoS One 2012; 7:e35813; http://dx.doi.org/10.1371/journal.pone.0035813; PMID: 22536443
- Carmona FJ, Azuara D, Berenguer-Llergo A, Fernández AF, Biondo S, de Oca J, Rodriguez-Moranta F, Salazar R, Villanueva A, Fraga MF, et al. DNA methylation biomarkers for noninvasive diagnosis of colorectal cancer. Cancer Prev Res (Phila) 2013; 6:656 - 65; http://dx.doi.org/10.1158/1940-6207.CAPR-12-0501; PMID: 23694962
- Church TR, Wandell M, Lofton-Day C, Mongin SJ, Burger M, Payne SR, Castaños-Vélez E, Blumenstein BA, Rösch T, Osborn N, et al, PRESEPT Clinical Study Steering Committee, Investigators and Study Team. Prospective evaluation of methylated SEPT9 in plasma for detection of asymptomatic colorectal cancer. Gut 2014; 63:317 - 25; PMID: 23408352
- McCormack S, Grant SF. Genetics of obesity and type 2 diabetes in African Americans. J Obes 2013; 2013:396416; http://dx.doi.org/10.1155/2013/396416; PMID: 23577239
- Ricci-Cabello I, Ruiz-Pérez I, Nevot-Cordero A, Rodríguez-Barranco M, Sordo L, Gonçalves DC. Health care interventions to improve the quality of diabetes care in African Americans: a systematic review and meta-analysis. Diabetes Care 2013; 36:760 - 8; http://dx.doi.org/10.2337/dc12-1057; PMID: 23431094
- Giovannucci E, Harlan DM, Archer MC, Bergenstal RM, Gapstur SM, Habel LA, Pollak M, Regensteiner JG, Yee D. Diabetes and cancer: a consensus report. Diabetes Care 2010; 33:1674 - 85; http://dx.doi.org/10.2337/dc10-0666; PMID: 20587728
- Kisiel JB, Yab TC, Nazer Hussain FT, Taylor WR, Garrity-Park MM, Sandborn WJ, Loftus EV, Wolff BG, Smyrk TC, Itzkowitz SH, et al. Stool DNA testing for the detection of colorectal neoplasia in patients with inflammatory bowel disease. Aliment Pharmacol Ther 2013; 37:546 - 54; http://dx.doi.org/10.1111/apt.12218; PMID: 23347191
- Cai C, Ashktorab H, Pang X, Zhao Y, Sha W, Liu Y, Gu X. MicroRNA-211 expression promotes colorectal cancer cell growth in vitro and in vivo by targeting tumor suppressor CHD5. PLoS One 2012; 7:e29750; http://dx.doi.org/10.1371/journal.pone.0029750; PMID: 22235338
- Rønneberg JA, Fleischer T, Solvang HK, Nordgard SH, Edvardsen H, Potapenko I, Nebdal D, Daviaud C, Gut I, Bukholm I, et al. Methylation profiling with a panel of cancer related genes: association with estrogen receptor, TP53 mutation status and expression subtypes in sporadic breast cancer. Mol Oncol 2011; 5:61 - 76; http://dx.doi.org/10.1016/j.molonc.2010.11.004; PMID: 21212030
- Chen LC, Chen CC, Liang Y, Tsang NM, Chang YS, Hsueh C. A novel role for TNFAIP2: its correlation with invasion and metastasis in nasopharyngeal carcinoma. Mod Pathol 2011; 24:175 - 84; http://dx.doi.org/10.1038/modpathol.2010.193; PMID: 21057457