Abstract
L1 is an insertional mutagen that is capable of mediating permanent gene disruption in mammalian genomes. However, currently available L1 retrotransposition vectors exhibit low or unstable transgene expression when expressed in somatic cells and tissues. This restriction limits their potential utility in long-term screening procedures or somatic mutagenesis applications. In this study, we addressed this problem by developing a minicircle, nonviral L1 retrotransposition vector using a scaffold/matrix attachment region (S/MAR) in the vector backbone and evaluated its utility in human cell lines. The S/MAR-based L1 retrotransposition vector provides stable, elevated levels of L1 expression compared to the currently used EBNA1-based L1 vector. In addition, the S/MAR elements effectively mediate sustained levels of L1 retrotransposition in prolonged cell culturing without suffering from epigenetic silencing by DNA methylation or from vector integration problems even in the absence of selection pressure. These findings indicate that the simple inclusion of S/MAR in the vector backbone increased levels of L1 expression and retrotransposition that can be used as an effective tool to generate insertional mutagenesis in large-scale somatic mutagenesis applications in mammalian cells.
For the Erratum, click here.
DOI: 10.4161/epi.6.7.16675
Danny Rangasamy
Volume 6, Issue 7
Page 951
Introduction
Insertional mutagenesis, which is the ability to insert a new sequence into a gene and disrupt its function in individual cells or whole animals, has emerged as a powerful strategy for rapid gene discovery. Transposons are widely being adopted as a tool to deliver a gene trap, owing to their efficient splicing and disruption of genes function. Mammalian retrotransposons such as long interspersed nuclear element 1 (LINE-1 or L1) offer potential advantages over the Sleeping Beauty and PiggyBac transposons as they carry out the random disruption of genes at a high frequency of insertion throughout the genome.Citation1–Citation3 Unlike other transposons, L1 mobilizes itself to a new genomic location by a ‘copy and paste’ mechanism, thus offering an infinite source of insertional mutagens for efficient gene knockout in mammals.Citation4,Citation5 Moreover, L1 insertions are stable and permanent in all progeny of the initial integrated cells, and the inserted sequence of L1 itself serves a molecular tag to facilitate identification of the affected gene in the genomic DNA.Citation6 These inherent features of the L1 retrotransposon make it a valuable tool in gene discovery applications. An active L1 is 6 kb in size, consisting of an internal promoter in the 5′-UTR, two open reading frames (ORF1 and ORF2), and a weak polyadenylation tail at the 3′-end. ORF1 encodes a protein with RNA-binding and chaperone activity while ORF2 encodes a protein with critical endonuclease and reverse transcriptase activities that are required for retrotransposition. The endonuclease generates a single-stranded nick in the target DNA, and the reverse transcriptase uses the nicked DNA to prime reverse transcription of the L1 RNA, followed by stable integration of the L1 transcript into a new genomic location. The L1 element has been extensively studied over the past decade and was shown to generate retrotransposition or insertional mutagenesis in both mouse and human cells and in transgenic mouse models. However, almost all L1 retrotransposition assays to date have been performed by cloning an active L1 into Epstein-Barr virus (EBNA1)-based episomal vectors that confer autonomous replication capabilities free from host cell-regulating factors. For easy detection of mutagenesis in the genomic DNA, the L1 retrotransposition cassette also contained a copy of the neomycin resistance gene or a visual EGFP marker disrupted by an antisense intron at the 3′-end of the L1 element. This reporter gene expresses or becomes functionally active only after L1 transcription, splicing and integration into the genome of the host cell.Citation6
Although exceptionally active in some mammalian cells, the L1 retrotransposition cassette currently in use has two significant shortcomings that precludes its use in long-term somatic mutagenesis screens.Citation5,Citation7,Citation8 First, the L1-containing EBNA1 vector is prone to vector loss or chromosomal integration within a few generations of cell growth, even in the presence of selective media. A second disadvantage is transcriptional silencing or poor expression of L1 elements in certain somatic cell types, which then requires lengthy selection and screening procedures. Several approaches have been devised to reduce these limitations, including the development of codon-optimized L1 sequencesCitation4,Citation9 or the use of more active L1 elementsCitation10,Citation11 or efficient L1 retrotransposition cassettesCitation11,Citation12 in EBNA1 vector backbones. However, many studies to date have featured very few somatic L1 insertions, with a strong signal bias towards the germ-line and brain cells of mice.Citation13,Citation14 Several studies have used an EBNA1 vector containing a strong viral CMV/L1 fusion promoter to overcome this stage and tissue-specificity and to increase the efficiency of L1 expression in both human and mice somatic cells.Citation6,Citation13,Citation15 Although the fusion promoter increases the highest initial levels of L1 expression in somatic cells, subsequent expression declines sharply within a few generations of cell growth, presumably due to transcriptional silencing of the L1 promoter or dilution of the vector in proliferating cells. Furthermore, this short burst of initial overexpression often results in too many L1 insertions within a single cell, leading to difficulties in screening the colonies and in some cases cell-death or apoptosis.Citation16,Citation17 An ideal system for somatic mutagenesis and gene discovery is constant and moderate expression of the L1 retrotransposon through multiple rounds of cell division without the limitations of transcriptional silencing or loss of vector in quiescent or post-mitotic cells.
Recent developments in a nonviral episomal system suggest that the creation of a vector containing a chromosomal scaffold/matrix attachment region (S/MAR) could overcome some of the limitations imposed by the EBNA1-based episomal vector. S/MAR is an AT-rich genomic fragment that is present in all mammalian chromosomes.Citation18 The S/MAR element specifically interacts with the nuclear matrix, chromosome scaffold factors and other cellular factors, and is known for its long-term mitotic stability, resistance to gene silencing and cosegregation with host chromosomes upon cell division.Citation19,Citation20 These unique properties of S/MAR prompted us to explore its ability to facilitate L1 retrotransposition and compare its expression profile with that of a currently used EBNA1-based vector in cultured human cells. Here we report that simple inclusion of the S/MAR in the vector backbone improved the levels of L1 expression and prolonged retrotransposition activity in human cells without any transcriptional silencing or dilution of vector, even in the absence of selective antibiotics.
Results
Development of an episomal vector expressing L1 insertional mutagens.
While testing L1 retrotransposons as an insertional mutagen in human cells, we noticed the complete disappearance of retrotransposition activity within a few days of cell culturing when using the currently available L1 retrotransposition cassette, pRP99-L1-EGFP in an EBNA1-based episomal vector (data not shown). Because this construct contained the highly active human L1 element L1RP under the control of its endogenous promoter and CpG-rich regions in its 5′-UTR, we hypothesized that the methylation status of these CpG islands might inhibit the L1 expression from EBNA1-based L1 vector, even though EBNA1 acts as an extrachromosomal entity in the host cell nucleus.Citation7 To obviate this effect, we created an S/MAR-based L1 retrotransposition cassette. This was identical to the widely used pRP99-L1-EGFP,Citation6,Citation13 except that the fragment containing the EBNA-1 antigen was replaced by the human β-interferon S/MAR sequence fused with a luciferase marker under the control of the CMV promoter (). Like pRP99-L1-EGFP, the S/MAR-based L1 retrotransposition cassette (pSMAR-L1-EGFP) contained a full-length L1RP retrotransposon tagged at its 3′UTR with an antisense EGFP gene, which is driven by a CMV promoter. The EGFP gene was disrupted by 960 bp of γ-globin intron in the same orientation as the L1 transcript. This arrangement ensures that functional EGFP expression occurs only after the L1 retrotransposition event or insertional mutagenesis; that is, after L1 expression, γ-globin intron splicing, reverse transcription and insertion of the L1 copy into the genomic DNA of the host cell.Citation6 Like the pRP99-L1-EGFP cassette, the levels of EGFP expression from the pSMAR-L1-EGFP transfected cells could be measured under UV light, allowing us to detect near real-time L1 retrotransposition events in living cells without cell staining.
To determine the effect of the vector backbone on L1 expression and retrotransposition efficacy from each of the L1 retrotransposition cassettes, HeLa and HEK293 cells were transfected with either pRP99-L1-EGFP or pSMAR-L1-EGFP. We then compared their ability to promote the mutagenesis by analyzing the retrotransposed EGFP expression, with pDsRed-N1 used as a reporter to normalize transfection efficiency. An inactive L1 element (pRP99-muL1-EGFP or pSMAR-muL1-EGFP) that contained two missense mutations in ORF1 to abrogate retrotransposition activity was used as a negative control.Citation13 For both expression cassettes, the retrotransposed EGFP-positive cells were detected readily in HeLa and HEK293 cells at 72 h post-transfection, whereas cells transfected with inactive L1 did not express any EGFP. To determine whether EGFP expression was a result of retrotransposition, we conducted a PCR-based analysis of genomic DNA to confirm the presence of the retrotransposed or spliced EGFP in these cells (). The intron-less EGFP (∼0.5 kb in size) was indeed amplified from cells transfected with either active L1 expression vectors but not from cells transfected with mutant L1 vectors, indicating the occurrence of retrotransposition events in these cells. In addition, we assessed whether EGFP expression was directly related to L1 transcript levels by quantitative real-time RT-PCR analysis (). A close correlation between the relative abundance of L1 transcripts, ORF1p and ORF2p (required for L1 propagation) and retrotransposition activity was observed for both pRP99-L1-EGFP and pSMAR-L1-EGFP cassettes. The levels of L1 transcripts had almost doubled within 72 h post-transfection, suggesting that the pRP99-L1-EGFP and pSMAR-L1-EGFP gene delivery systems mediate comparable levels of transient somatic mutagenesis without any noticeable limitations.
S/MAR-based L1 vector mediates persistently high levels of somatic mutagenesis.
Recent studies on the S/MAR element suggest that the plasmids containing S/MAR sequence promote extrachromosomal stability by interacting with host cell regulatory proteins for long-term transgene expression without being subjected to vector loss or dilution in dividing cells.Citation21,Citation22 To better understand the fundamental properties of S/MAR that endow L1 with its activity and mutagenic power, we compared the levels of L1 retrotransposition frequency between pRP99-L1-EGFP and pSMAR-L1-EGFP systems in HEK293 cells using flow cytometric analysis as described previously.Citation23 Cells transfected with either the pRP99-L1-EGFP or pSMAR-L1-EGFP vectors were initially enriched by applying antibiotics selection (hygromycin or G418) for 9 days. After eliminating untransfected cells, equal numbers of stably transfected cells (1 × 10³ cells) were plated on lower-dose antibiotic selection media and the number of EGFP-expressing cells was counted by FACS analysis for at least 15 days. As a negative control, cells transfected with either the pRP99-muL1-EGFP or pSMAR-muL1-EGFP were used to monitor the false positive frequency for background correction. None of these negative control cells showed fluorescent intensity above 0.01% of background level throughout the experiments. A retrotransposition rate was estimated by plotting the percentage of fluorescent cells versus time-points and calculating the slope of a line created by exponential regression.Citation23 The slope of the regression curves (y) are 0.838e0.189x (R2 = 0.981) and 0.716e0.181x (R2 = 0.983), respectively for S/MAR-L1-EGFP and RP99-L1-EGFP vectors; where x is a day post-transfection. Five days after cell culturing, the percent of retrotransposition rate was calculated as 2.1% ± 0.21 and 1.77% ± 0.26, respectively for S/MAR-L1-EGFP and RP99-L1-EGFP. Although these values are not significantly different at 5 days, the levels of retrotransposition from pRP99-L1-EGFP were always found to be less when compared with pSMAR-L1-EGFP (). The difference was particularly striking when percentages of retrotransposition were compared at 15 days after cell growth, showing up to 34% higher in the S/MAR-based L1 (14.4% versus 10.7%) than that from EBNA1-based L1 vector system. Consistence with this, a doubling time of the retrotransposition frequency was also calculated as 2.97 and 3.18 days, respectively for S/MAR-L1-EGFP and RP99-L1-EGFP using the formula described by previously.Citation24 Taken together, these data suggest that inclusion of the S/MAR sequence in the vector backbone significantly increases the L1 retrotransposition events over a period of cell culturing (p = 0.0001).
To assess whether the increased level of retrotransposition value was directly related to L1 transcripts levels, we isolated total RNA from population of transfected cells at various time points and performed quantitative real-time PCR analysis using L1-specific primers. The results are summarized in and shown as the copy numbers of L1 transcripts after normalizing the data to the housekeeping gene HPRT1. The absolute levels of the L1 transcripts ORF1 and ORF2 increased in pSMAR-L1-EGFP transfected cells (ANOVA analysis, p = 0.007) compared with pRP99-L1-EGFP transfected cells. This increase in the levels of L1 transcripts was consistent with the higher expression of retrotransposed EGFP seen in FACS assays. Although it is difficult to assess how much of the increase in transcripts was due to expression from the episomally maintained vectors and how much was from the newly integrated L1s, the overall increases in the expression of EGFP and L1 transcripts supports the idea that pSMAR-L1-EGFP increases the frequency of L1 retrotransposition in cultured human cells.
It has been previously shown that S/MAR elements can be maintained episomally without the need for virus-encoded proteins or antibiotic selection pressure.Citation21,Citation25 For gene discovery applications, particularly in whole animals, such an L1 retrotransposition cassette is an indispensable tool for long-term mutagenesis studies. To ascertain whether the S/MAR-based L1 vector can function as a stable episome, we stably transfected HEK293 cells with either pRP99-L1-EGFP or pSMAR-L1-EGFP cassettes and cultured them in the presence and absence of antibiotic selection for 50 days (equivalent to approximately 50 generations). The cells were maintained in an actively growing state by regular passaging and the percentage of cells expressing retrotransposed EGFP were assessed by flow cytometry at various time points. As shown in , the retrotransposed EGFP expression from the S/MAR-based L1 vector remained stable for the whole period, even in the absence of selection pressure. In contrast, the EGFP-expression from EBNA1-based vector, the most commonly used L1 vector, declined abruptly within a few days; the rate of vector loss or dilution over the 50 days of growth was about 28 and 55% (one-way ANOVA, p < 0.0001) in the presence and absence of antibiotic selection, respectively. This vast difference in the behavior of these two episomal cassettes suggests that the S/MAR sequence in the L1 vector backbone confers sustained episomal stability and thus provides a continuous, high level of L1 expression in cultured cells for at least 50 generations, even in the absence of antibiotic selection. This data corroborates other recent studies with this series of episomal vectors, which demonstrated that inclusion of the S/MAR improves transgene expression levels by promoting expression-permissive states in nearby cloned genes.
Assessing the episomal state of L1 vectors in somatic cells.
The variability in transgene expression is usually attributed to the copy number and to vector integration within the host genome, which is subjected to the influence of chromosomal regulatory elements adjacent to the integration site. Episomal vectors such as EBNA1- and S/MAR-based vectors supposedly function as autonomous minichromosomes that replicate once per cell cycle and segregate equally into daughter cells. In addition, transgene expression may occur independently of the host cell chromosomal environment. Given the persistent expression of the S/MAR-based L1 vector but not EBNA1-L1, we set out to determine the episomal status of these cassettes in host nuclei. Fluorescence in situ hybridization (FISH) was used to simultaneously visualize episomal and integrated DNA as single sharp signal of low intensity or intense doublets signals, respectively, on metaphase spreads of chromosomes.Citation26,Citation27 Although the episomes in some mammalian cells have been reported to give raise to a faint signal of doublets due to anaphase delay or late replication of episomes,Citation28 FISH assay would reasonably allow us to judge the episome versus integrated signals by colocalization of the signal intensity with the host chromosomes. HEK293 cells, stably transfected with either the S/MAR-L1-EGFP or pRP99-L1-EGFP cassette, were subjected to FISH analysis after 10 and 50 cell generations using the EBNA1-specific or S/MAR-specific sequence as a probe. This probe set specifically hybridizes with exogenously introduced vector but not with L1 elements in the genome of the host cell. FISH analyses showed that no intense double signals were seen on metaphase spreads from S/MAR-L1-EGFP-transfected cells even after 50 generations, indicating the maintenance of this vector as an episome throughout the experiments ( and B). These cells always contained fluorescent spots that are not associated with host chromosomes, as shown by applying increased shear forces during chromosome spreading. In addition, the position of fluorescent spots also varied between cells derived from the same clone, indicating a non-integrated state of this episomal vector within the host cells. In contrast to this, the pRP99-L1-EGFP cassettes were frequently found to be integrated with the host-chromosomal DNA as intense signal doublets across the chromosome arms. Although pRP99-L1-EGFP was initially maintained as episome through as many as 10 cell generations without any noticeable integration with the host genome, by 50 generations many of these vectors displayed FISH signals consistent with an integrated vector ( and D). The sites and number of vector integrations also varied from cell to cell, as seen in metaphase spreads displaying double signals at various chromosomal loci. Taken together, these observations suggest that unlike pS/MAR-L1-EGFP, the pRP99-L1-EGFP vector is not mitotically stable and is more inclined to integrate with the host genome after prolonged cell culture. The integration of the EBNA1-based L1 vector but not S/MAR suggests that vector integration is mostly likely due to the vector backbone itself. Consistent with this view, the EBNA1 vector has been shown to become unstable and integrate with host genomic DNA when it contained the repetitive IR3 sequence as an insert.Citation29
In a parallel set of experiments, we estimated the copy number of vector molecules per cell by analyzing metaphase spreads of 10 different cell clones from both S/MAR-L1-EGFP and pRP99-L1-EGFP-transfected cells. Based on fluorescent signal, 2.2 ± 0.92 copies of the S/MAR-L1-EGFP vector were present in the average cell, and almost all transfected cells maintained this copy number episomally over 50 cell generations regardless of the presence or absence of selective pressure (). Strikingly, we were able to rescue all the S/MAR plasmids in E. coli. Extrachromosomal DNAs extracted from cells that had been cultured for 50 days were all found to contain S/MAR plasmids identical to the original input plasmid DNA used for the transfection (data not shown). In contrast, the number of copies of pRP99-L1-EGFP varied from cell to cell and vector integration was more frequent, but some vectors were still found to be maintained as episomes in the host cell (). The average number of pRP99-L1-EGFP vectors integrated with the host chromosomes was 41.6 ± 15.3 per cell after 50 generations of cell culture in the presence of antibiotic selection. Interestingly, within these cells, an average of 4.2 ± 1.8 vectors per cell still existed as episomes on metaphase spreads and were not associated with any chromosomal sites. This suggests that the host cells retained only 10% of pRP99-L1-EGFP vectors as episomes after 50 days of continuous cell growth. Consistent with this, we were not able to rescue all the vectors from host cells as episomal plasmids in E. coli using either total DNA or DNA from the Hirt extracts (data not shown). Interestingly, despite the presence of twice the number of pRP99-L1-EGFP (average 4.2 per cell) episomes compared with the pS/MAR-L1-EGFP (average 2.2 per cell), the levels of L1 retrotransposition continued to decline sharply over 50 days of cell growth, indicating that the EBNA1-L1 vector might be subjected to transcriptional gene silencing, presumably via epigenetic modifications. Nevertheless, the cells are still capable of expressing very low levels of the L1 retrotransposition for 50 cell generations.
Epigenetic silencing of the L1 promoter in EBNA1-based L1 vectors.
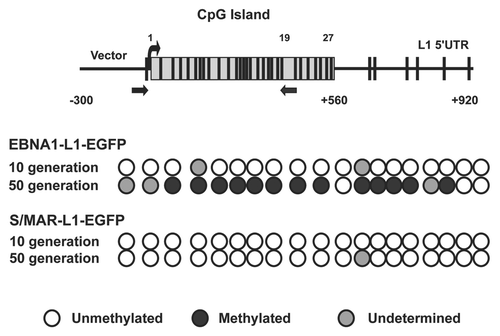
Having seen the retention of multiple copies of both L1 vectors as episomes in HEK293 cells, we set out to investigate the mechanism by which the S/MAR-based L1 vector but not EBNA1-L1 mediates high levels of persistent retrotransposition in somatic cells. As the 5′UTR of the L1 promoter contains a CpG island,Citation30,Citation31 we hypothesized that the difference in expression between S/MAR and EBNA1-based vectors could be due to the methylation status of the L1 promoter. The presence of CpG methylation at the promoter can suppress gene expression by preventing the binding of transcriptional factors around the transcription start site;Citation32 in some cases, DNA methylation also initiates heterochromatin formation, leading to permanent gene silencing.Citation33
The L1 promoter is enriched in CpG-rich dinucleotides at its 5′UTR, forming a CpG island of 534 bp. Indeed, the L1 promoter is known to become hypermethylated in several somatic cell types such that its expression is silenced in an epigenetic manner.Citation34 Thus, to examine CpG methylation, we performed bisulfite sequencing of the L1 promoter from S/MAR-L1-EGFP- and pRP99-L1-EGFP-transfected cells after 10 and 50 cell generations (). Bisulfite primers were specifically designed to sequence the region covering 19 CpG dinucleotides in the L1 promoter. This primer set would hybridize with an exogenously introduced vector but not with endogenous L1 promoters present in the host cells. Sequence analysis of at least 10 different clones of each amplicon showed complete conversion of unmethylated cytosine residues to uracil by DNA bisulfite modification. The sequencing data was analysed using the BiQ-Analyzer software.Citation35 The S/MAR-L1-EGFP vector characterized by strong L1 expression did not show any CpG methylation, even after 50 cell generations. In contrast, the L1 promoter in pRP99-L1-EGFP exhibited significant CpG methylation, in patterns ranging from 13 to 16 methylated CpG dinucleotides. This strongly suggested that the differential expression of L1 retrotransposons might be related to methylation of the CpG island upstream of the L1 start site. Interestingly, the pRP99-L1-EGFP isolated after 10 cell generations was found to contain little or no CpG methylation at its promoter, although methylation became more apparent after prolonged cell culturing for 50 generations. Therefore, the success of the S/MAR-based L1 system in mediating sustained L1 expression appears to be due to the lack of DNA methylation at its promoter even after continuous cell growth, which enables high levels of persistent retrotransposition in cells. Taken together, these results demonstrate that the S/MAR-based L1 retrotransposition cassette is an alternative tool that can overcome both vector integration and epigenetic silencing of host cell environment. This study also implies that strong, stable L1 retrotransposition can be achieved simply by transfecting a limited number of cells with the S/MAR-based L1 vector, obviating the need for lengthy screening procedures for insertional mutagenesis and gene discovery approaches in mammalian cells.
Discussion
A traditional approach to gene discovery in mammals is the use of N-ethyl-N-nitrosourea as a mutagen to create loss or gain-of-function gene mutations. Finding the causal point mutation in such lines is difficult and time consuming. Alternatively, insertional mutagenesis may be performed in mouse germ line and ES cells, which requires the generation of adult mice from ES cells. To overcome some of these time-consuming processes, several laboratories have used the DNA transposons such as the SB transposon for gene tagging in somatic cells and tissues.Citation36 However, one limitation of currently available SB transposons is the difficulty of co-delivering the transposase-encoding DNA sequences along with the SB transposon for gene insertion. In addition, low transfer efficiency and the lack of sustained transposase expression has been reported a problem in somatic cells. An efficient, simple, inexpensive transposition assay vector would thus have tremendous potential in somatic mutagenesis applications. Recent progress in L1 biology and the availability of an L1 retrotransposition cassette has attracted attention as it has widened the set of existing tools to carry out insertional mutagenesis in cultured cell lines.Citation14 Unlike other DNA transposons, the L1 retrotransposon moves by a ‘copy and paste’ mechanism. Its insertion in a new genomic location is random and permanent in all progeny cells and tissues. Stable and high levels of insertional mutagenesis can be rapidly achieved by screening a limited number of cell clones transfected with the L1 retrotransposition cassette, obviating the need for lengthy colony screening procedures.
At present, the L1 retrotransposon is available for insertional mutagenesis that is based on a vector containing the viral protein EBNA1. Although this expression cassette has been widely used for insertional mutagens in mouse models of L1 retrotransposition in ES cells transfection and subsequent blastocyst injection,Citation37 the current L1 system has so far met with limited success in somatic mutagenesis due to its poor expression in several somatic cells and tissues.Citation3,Citation5 To harness the power of L1 as a mutagenic vehicle, the present study carried out in cultured human cells and compared the retrotransposition properties of the S/MAR-based L1 cassette with the currently used EBNA1-based L1 cassette. Under identical conditions, the S/MAR-based L1 cassette showed increased retrotransposition efficiency and supported higher levels of L1 expression, even though the average copy number of the S/MAR-L1 vector was estimated to be two per cell compared to more than 40 per cell in EBNA1-L1 transfected cells. This demonstrates that the inclusion of the S/MAR sequence in the vector backbone mediates high levels of sustained L1 expression in human cells as a stable episome. This is consistent with previously published reports for pEPI in human hematopoietic ES cells, HeLa and mouse liver cells.Citation21,Citation38,Citation39 In addition, there was no indication of S/MAR-L1 integration into the host chromosomes by FISH analysis of metaphase chromosomal spreads, which allows the clear distinction of integrated and episomal sequences as double labels on sister chromatids and individual hybridization signals, respectively. Almost all the cells maintained their vector copy number with or without selection pressure for a period of 50 days, illustrating the stability of the S/MAR-based L1 transposition cassette in cultured human cell lines.
Like the S/MAR-based vector, EBNA1 is also an extrachromosomal plasmid that is supposed to function as a mammalian origins of replication due to its ability to recruit ORC complexes at its viral sequence elements.Citation40 The maintenance of this vector is accomplished by the viral origin of replication, OriP and the nuclear antigen, EBNA-1, which act together to replicate the episome and maintain it long-term in dividing cells.Citation41 The EBNA1 vector was originally chosen for L1 retrotransposition assays because it replicates episomally without any interference from host cell regulatory factors. Additionally, EBNA1 persists in the nucleus of target cells as multicopy episomes, avoiding the risk of vector integration that is required for achieving stable and high rates of retrotransposition in cell culture assays. Surprisingly, we found that the chromosomal integrations of the EBNA1-based L1 are commonly frequent in cultured human cells. Consistent with this, we also observed a significant rate of vector loss or dilution over the 50 days of culturing even in the presence of selective medium. These results are unlikely to be due to the nicked or linearized plasmids as repeated experiments with supercoiled plasmid DNA prepared by CsCl-ethidium bromide gradients gave similar results (data not shown). At present, it is not known why EBNA1-based L1 construct is prone to chromosomal integration. Given the repetitive nature of L1 sequences, it is possible that L1-carrying EBNA1 becomes unstable and is rearranged and integrated with the host chromosomes through homologous recombination, similar to previous reports of the integration of EBNA1 vectors that contained the repetitive IR3 region as an insert.Citation29
Epigenetic factors such as DNA methylation state or chromatin structure often influence the functional states of episomes.Citation42 A change in cytosine methylation within the promoter region of L1 plays an important role in the transcriptional silencing and inactivation of L1 retrotransposition. Thus, identifying the methylation states of CpG dinucleotides in the L1 promoter is potentially helpful in understanding the stability and the functional state of L1-containing episomal vectors.Citation30,Citation31 Using bisulfite methylation analysis, the present study demonstrates differential methylation patterns of the L1 promoters in two different L1 expression cassettes. Given that EBNA1-based pRP99-L1-EGFP vectors but not pS/MAR-L1 vectors are prone to genome integration, it is not surprising that extensive CpG methylation occurred at the L1 promoter in the pRP99-L1-EGFP vector, resulting in transcriptional silencing of the L1 transgene. It has recently been proposed that transcriptional silencing is a series of events that may be initiated from DNA methylation and eventually leads to heterochromatin formation for permanent gene silencing. Indeed, DNA methylation in the SB transposon has been shown to initiate and recruit inactive heterochromatic markers such as H3-trimethyl-K9 and HP1α for permanent transgene silencing.Citation33 Strikingly, the CpG island of the L1 promoter remained unmethylated in S/MAR-based L1 vector, suggesting that the presence of S/MAR sequence might protect the L1 promoter from DNA methylation and transcriptional silencing. Consistent with our results, a recent study of S/MAR containing the liver-specific antitrypsin promoter also reports that, in the presence of S/MAR, the promoter is not subject to CpG methylation or gene silencing.Citation22 Moreover, the S/MAR containing vector has been shown to be associated with H3-trimethyl-K4, which is a marker of active chromatin and signals the transcriptional activation of transgene expression.Citation22
The detailed molecular mechanisms underlining the protective effect of S/MARs on L1 expression are presently unknown. S/MAR is an AT-rich sequence usually found between genes as a genetic boundary that independently organizes its chromosomal domains into structures that are permissive for gene expression.Citation25 A transgene flanked by S/MAR sequences may therefore constitute an autonomous chromatin domain whose expression would remain independent of the adjacent chromosomal environment. Given its AT-rich content, S/MAR could function as an insulator to protect the active chromatin from inactive chromatin by ensuring that DNA remains unmethylated and easily accessible for gene expression. In fact, the AT-rich sequence in the human GSPT1 gene was shown to form a boundary between methylated and unmethylated DNA.Citation43 Consistent with this view, it has been recently proposed that S/MAR sequences might act as entry sites for regulatory proteins like histone acetyl transferases and other transcriptional machinery that mediate long-range hyperacetylation and DNA hypomethylation in synergy with enhancers and thereby, may activate the expression of nearby inserted genes. Thus, inclusion of the S/MAR element into the L1 vector backbone could confer an active conformational structure to the L1 promoter, allowing it to interact with cellular factors that keep it in an unmethylated and transcriptionally active state in somatic cells. Taken together, the results of this study demonstrate that the S/MAR-based L1 vector is capable of overcoming transcriptional silencing to provide sustained, selection-free replication of the L1 retrotransposition cassette in host cells. To our knowledge, this is the first report that demonstrates L1 expression in the absence of virally encoded transacting factors for L1 retrotransposition in cultured somatic cells.
Materials and Methods
Plasmid constructs.
The EBNA1-based L1 expression cassette (pRP99-L1-EGFP) and retrotransposition-defective vector (pRP99-muL1-EGFP) were kindly provided by Professor H.H. Kazazian, University of Pennsylvania, USA. The S/MAR-based L1 vector was created by inserting an L1 expression cassette derived from pRP99-L1-EGFP that contained a full-length active L1RP tagged with an antisense EGFP gene at its 3′UTR into the SalI and SmaI sites of pEPI-luciferase (obtained from Professor Hans Lipps, University of Witten, Germany), in which the CMV promoter drives the expression of a luciferase gene fused with the S/MAR sequence. This construct confers resistance to G418 in mammalian cells. In the same manner, the retrotransposition-defective vector pS/MAR-muL1-EGFP was constructed by swapping the SalI and SmaI-fragment of active L1 from pS/MAR-L1-EGFP with an inactive L1 fragment derived from pRP99-muL1-EGFP plasmid. The plasmid DNA was amplified in E. coli DH10B cells and isolated using an endotoxin-free Maxi prep kit (Qiagen).
Cell culture and transfection.
HEK293 and HeLa cells were grown in high glucose DMEM (Invitrogen) supplemented with 2 mM L-glutamine, 10% FCS and 1% penicillin-streptomycin. For transfection, exponentially growing cells (∼2 × 10⁵) were seeded in 6-well plates and transfected with 1 µg of either pRP99-L1-EGFP or pS/MAR-L1-EGFP using Lipofectamine-2000 (Invitrogen) following the manufacturer's protocol. To examine transfection efficiency, pDsRed-N1 (Clontech) was used as a reporter. Cell populations were used 72 h after post-transfection without antibiotic selection for transient retrotransposition assays. To create stable cell populations, antibiotic selection was begun 24 h after transfection and continued for 9 days. The pRP99-L1-EGFP-transfected cells were enriched by growing in 200 µg/ml hygromycin (Hyg) while pS/MAR-L1-EGFP-cells were grown in 300 µg/ml Geneticin (G418). After 9 days of antibiotic selection, the untransfected cells were completely eliminated and both antibiotic selections generated an almost equal number of transformed cells, as observed by FACS analysis. These cell populations were trypsinized, plated at low density (1 × 10³ cells) and maintained in low dose selective medium (75 µg/ml hygromycin or G418) until further analysis.
Retrotransposition assay.
The retrotransposition assay and the determination of retrotransposition frequency were performed as previously described.Citation23 The numbers of retrotransposed EGFP-positive and -negative cells were determined by flow sorting with a FACSVantage DiVa cell sorter (Becton-Dickinson). Over 10,000 individual fluorescent events were acquired using a 530/30 bandpass filter for the EGFP protein signal obtained with fluorescence emission centered at 530 nm. Cells transfected with the pRP99-muL1-EGFP or pS/MAR-muL1-EGFP were used as negative controls to determine background fluorescence throughout the experiment. The percentage of cells that fluoresced below the negative control threshold was considered the false positive frequency. Each experimental group was analyzed in triplicate; two independent transfections per construct were analyzed at each time point.
PCR analysis of retrotransposed cells.
Genomic DNA was isolated from cells using a QIAamp DNA kit (Qiagen). PCR was carried out to examine the structure of the EGFP reporter gene that integrated with the host cell genomic DNA with the Geno-5′ (5′-TAT TGC CGA TCC CCT CAG AAG A-3′) and Geno-3′ (5′-CAA GGA CGA CGG CAA CTA CAA G-3′) primers. Amplifications were performed in 50 µl containing 1.25 U Taq polymerase, 2.5 mM MgCl2, 1x PCR buffer (Fermentas), 0.2 mM each dNTP, 5 µM each primer and 250 ng genomic DNA or 1 ng plasmid DNA template. After an initial step at 95°C for 5 min, 30 cycles of amplification were performed (95°C for 30 s, 58°C for 15 s and 72°C for 2 min), followed by a final step at 72°C for 8 min. The amplified products were visualized on a 1.2% agarose gel. Genomic DNA from retrotransposition-defective cells was used as a negative control.
Quantitative RT-PCR.
Total RNA was isolated using an RNeasy Kit (Qiagen) and digested with TurboDNase I (Ambion). About 2 µg of purified RNA was used in cDNA synthesis with 0.1 µg of random decamer primers using the RETROScript RT Kit (Ambion). The resulting cDNAs were used as templates for QPCR with L1-specific primer sets using SYBR Green PCR master mix and a 7900HT Thermal Cycler (Applied Biosystems). In this assay, cDNA synthesis performed in the absence of reverse transcriptase served as negative controls. The primers used were as follows: for ORF1, forward 5′-GGT TAC CCT CAA AGG AAA GCC-3′, reverse 5′-GCC TGG TGA CAA AAT CTC-3′; for ORF2, forward 5′-AAA TGGTGCTGGGAAAACTG-3′, reverse 5′-GCC ATT GCT TTT GGT GTT TT; and for HPRT1, forward 5′-CCT GGC GTC GTG ATT AGT GAT-3′, reverse 5′-AGA CGT TCA GTC CTG TCC ATA-3′. The fold differences were determined by comparing the ΔCT value of each product normalized to HPRT1 for each reaction as described previously.Citation44 The data presented is the average of three independent experiments with each experiment performed in triplicate and analyzed using the Relative Expression Software Tool (http://rest.gene-quantification.info/). For absolute quantification of L1 copies, a serial dilution of L1 plasmid DNA was used to generate a standard curve and quantified copy number as described in reference Citation45.
Fluorescence in situ hybridization.
Metaphase chromosome spreads, pretreatment of slides for FISH analysis, probe labeling and hybridization were performed as previously describedCitation29 with minor modifications. The cells were pretreated with Colcemid (final concentration 100 µg/ml) for 1 h at 37°C before fixation. Spreading of metaphase chromosomes was done on the slide as gently as possible; in some cases increased shear forces were applied by dropping the cells onto the slides from at least 10-cm away. For probe labeling, 500 ng of PCR-amplified EBNA1 or S/MAR fragments were labeled with digoxigenin-dUTP by nick translation according to the manufacturer's protocol (Fermentas) and visualized with anti-digoxigenin-Cy3 antibody (Jackson ImmunoResearch). Slides were mounted in Vectashield (Vector Labs) containing DAPI (1.5 µg/ml; Sigma). The images were photographed using an Olympus IX81 fluorescence microscope and overlaid using Adobe Photoshop.
DNA methylation analysis.
DNA was extracted from cells using the Qiagen DNA Mini kit (Qiagen). About 4 µg of DNA was treated with the Methyl-Easy DNA bisulphite modification kit (Human Genetic Signatures) according the manufacturer's instructions. The primers used for bisulfite sequencing of the L1 promoter were designed using the Methyl Primer Express version 1.0 software (Applied Biosystems). To overcome non-specific interaction with the host-cell L1s, we designed a forward primer (5′-GGG TAT TAG TTG TTA GTA AGT TTG TTA G-3′) that binds specifically at the junction of both L1 vectors and a reverse primer (5′-AAA AAA AAC TCC CTA ACC CCT TAC-3′) for the L1 region. About 60 ng bisulfited DNA was subjected to PCR amplification using the following conditions: Initial denaturation at 94°C for 3 min, 35 cycles of 94°C for 1 min, 52°C for 2 min and 72°C for 2 min followed by 72°C for 10 min. The amplicons were analyzed on 1.5% agarose gels and isolated with the MinElute Gel extraction kit (Qiagen). The purified PCR products were cloned into the pGEM-T easy vector (Promega) and sequenced. The sequences of at least 10 different clones of each amplicon were analyzed with using BiQ Analyzer software (http://biq-analyzer.bioinf.mpi-inf.mpg.de/) to assess the sequence quality and to visualize the DNA methylation data.
Statistical analysis.
Statistical significance was determined by applying unpaired t-test and one-way ANOVA analysis of GraphPad Software (version 5) to the data, as specified.
Abbreviations
| L1 or LINE-1 | = | long interspersed nuclear elements |
| UTR | = | untranslated region |
| ORF | = | open reading frame |
| EGFP | = | enhanced green fluorescent protein |
| S/MAR | = | scaffold/matrix attachment region |
| EBNA1 | = | Epstein-Barr virus nuclear antigen |
Figures and Tables
Figure 1 Design of the L1 retrotransposition cassette for somatic mutagenesis. (A) Schematic diagrams of L1-EGFP expression cassettes used for L1 retrotransposition assays in cultured human cells. The left part shows the newly designed S/MAR-based L1 episomal system. pS/MAR-L1-EGFP encoding resistance to geneticin (G418) and S/MAR sequence fused with luciferase reporter (LUC). The right part shows the currently available EBNA1-based L1 episomal system. pRP99-L1-EGFP encoding resistance to hygromycin (Hygro) and EBNA1 for replication in mammalian cells. In both expression systems, L1 transcription is driven by its own 5′UTR, which harbors an internal promoter. The L1 retrotransposon contains an intron-interrupted EGFP reporter in the 3′UTR region with its own CMV promoter and polyadenylation signal (pA). The EGFP indicator cassette is in the antisense orientation relative to L1. Only when EGFP is transcribed from the L1 promoter, spliced, reverse transcribed and integrated into the genome does a cell become GFP-positive. As a negative control, inactive L1 (pS/MAR-muL1-EGFP or pRP99-muL1-EGFP) containing two missense mutations in ORF1 was used. Arrows depict the location of the geno-5 (left) and geno-3 (right) primers used in the PC R assay shown below. SD, splice donor; SA, splice acceptor. (B) Detection of L1 retrotransposition events in cultured human cells. The geno-5 and geno-3 primers that flank the intron in EGFP were used for PCR amplification of genomic DNA and products were analyzed on a 1.2% agarose gel. PCR products of 1.49 kb (corresponding to the intron-containing transgene) and 530 bp (corresponding to the retrotransposed insertion that lacks the 909 bp intron) are shown. Negative, genomic DNA from untransfected cells; Vector, 1 ng plasmid DNA; Marker, 1 kb-plus DNA marker (Invitrogen). As a negative control for retrotransposition, inactive L1 (pS/MAR-muL1-EGFP and pRP99-muL1-EGFP) vectors were used. (C) Quantitative real-time RT-PC R analysis of L1 transcripts was conducted in control cells (transfected with retrotransposition-defective vector) or pRP99-L1-EGFP and pS/MAR-L1-EGFP-transfected cells 72 h post-transfection. The data are shown as relative fold change of L1 ORF1 and L1 ORF2 mRNA levels compared to control cells after normalizing to the housekeeping gene HPRT1. The levels of mRNA expression in control cells was set to 1. Each point represents the averages of three independent experiments. *p = 0.001. Error bars show s.d. (n = 3).
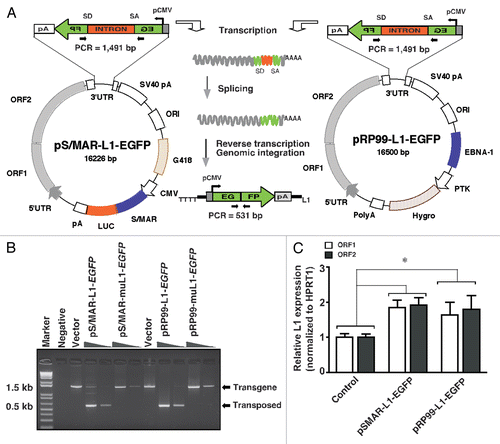
Figure 2 The S/MAR-based L1 system mediates high and sustained retrotransposition frequency. (A) Percentage of EGFP fluorescent cells from a stable population was plotted over time for pS/MAR-L1-EGFP and pRP99-L1-EGFP transfected cells. Each time point represents cell populations from three independent transfections. Sampling and analysis were performed at 5, 7, 9, 10, 12 and 15 days after plating of stably transfected cells. The retrotransposition rates were estimated from the slope of a line created by linear regression. The error bars indicate s.d. (n = 3). (B) The expression levels of L1 transcripts in a stable population of cells as shown in the top part. The absolute expression levels of L1 ORF1 and L1 ORF2 mRNAs was determined by quantitative real-time PCR using a plasmid DNA standard curve. The mean copy numbers of ORF1 and ORF2 are plotted on the y-axis with error bars representing standard error of three assays. One-way analysis of variance, p = 0.007. (C) Equal numbers of HEK293 cells (1 × 10³ cells) stably transfected with either pS/MAR-L1-EGFP or pRP99-L1-EGFP were cultured in the presence (+) or the absence (−) of selective antibiotics for 50 days. The mean percentage EGFP-expressing cells remaining at various time points are shown for each group after assessing L1 retrotransposition by flow cytometry. One-way analysis of variance, p < 0.0001. Error bars show s.d. (n = 3).
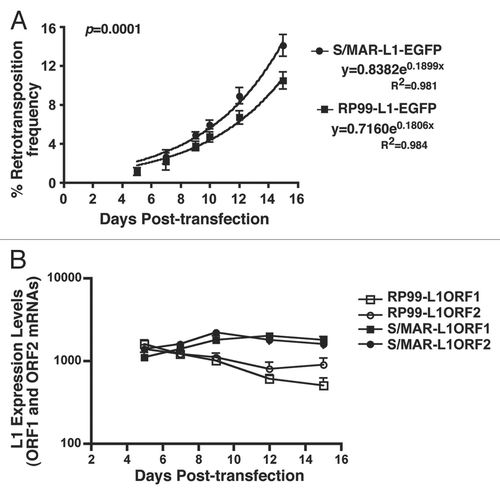
Figure 3 FISH analysis of the L1 episomes on metaphase chromosomes. Metaphase spreads from HEK293 cells containing pS/MAR-L1-EGFP vector (A and B) were probed with an S/MAR-specific probe after 10 and 50 cell generations, respectively. FISH analysis of cells transfected with pRP99-L1-EGFP and probed with an EBNA-1-specific sequence after 10 and 50 cell generations are shown in (C and D), respectively. Nuclei were stained with DAPI (blue) and FISH probes (red). The colored and white arrows on metaphase chromosomal spreads indicate the integrated vectors as close double labels on sister chromatids and episomal vectors as individual hybridization signals. Scale bar represents 10 µm. (E and F) Quantification of the number of FISH signals per nucleus in HEK293 cells stably transfected with pS/MAR-L1-EGFP or pRP99-L1-EGFP vectors and grown for 50 cell generations in the presence of selective antibiotics. Individual FISH signals on metaphase spreads from 10 different transformed cells were analyzed for each construct and counted under fluorescence microscopy. The mean number of episomal (red column) or the integrated (blue column) vectors are shown for each construct.
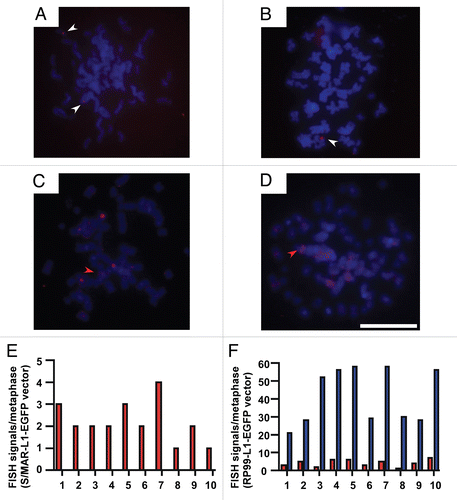
Figure 4 DNA methylation analysis. Schematic representation of CpG sites distribution within 5′UTR of the L1 promoter from +1 to +920 bp (relative to the transcription start site) in the adjacent 5′-vector region. Vertical lines above indicate the position and numbering of CpG dinucleotides; the box represents the CpG island in the L1 promoter (ending at +560 bp). Primers used for bisulfite sequencing are indicated by arrows. We analyzed the methylation status of 19 CpG sites (1–19) within the CpG island by bisulfite sequencing. The corresponding methylation of these CpG sites is illustrated below. Circles represent CpG sites and the methylation status for each construct is shown by row as displayed by BiQ-Analyzer. Solid black circles indicate the presence of DNA methylation while white circles indicate the absence of DNA methylation.
Acknowledgements
The author thanks Preethi Eldi for technical assistant in cell culturing. This work was supported by a grant from the Australian National Health and Medical Research Council (418021 to D.R.).
References
- An W, Boeke JD. Transposon technology and vertebrate functional genomics. Genome Biol 2005; 6:361
- Babushok DV, Ostertag EM, Courtney CE, Choi JM, Kazazian HH Jr. L1 integration in a transgenic mouse model. Genome Res 2006; 16:1 - 3
- Ostertag EM, Madison BB, Kano H. Mutagenesis in rodents using the L1 retrotransposon. Genome Biol 2007; 8:16
- An W, Han JS, Wheelan SJ, Davis ES, Coombes CE, Ye P, et al. Active retrotransposition by a synthetic L1 element in mice. Proc Nat Acad Sci USA 2006; 103:18662 - 18667
- Collier LS, Largaespada DA. Transposons for cancer gene discovery: Sleeping Beauty and beyond. Genome Biol 2007; 8:15
- Ostertag EM, DeBerardinis RJ, Goodier JL, Zhang Y, Yang N, Gerton GL, et al. A mouse model of human L1 retrotransposition. Nat Gene 2002; 32:655 - 660
- Han JS, Szak ST, Boeke JD. Transcriptional disruption by the L1 retrotransposon and implications for mammalian transcriptomes. Nature 2004; 429:268 - 274
- Yang N, Zhang L, Zhang Y, Kazazian HH Jr. An important role for RUNX3 in human L1 transcription and retrotransposition. Nucl Acids Res 2003; 31:4929 - 4940
- Han JS, Boeke JD. A highly active synthetic mammalian retrotransposon. Nature 2004; 429:314 - 318
- Brouha B, Meischl C, Ostertag E, de Boer M, Zhang Y, Neijens H, et al. Evidence consistent with human L1 retrotransposition in maternal meiosis I. Am J Hum Genet 2002; 71:327 - 336
- An W, Han JS, Schrum CM, Maitra A, Koentgen F, Boeke JD. Conditional activation of a single-copy L1 transgene in mice by Cre. Genesis 2008; 46:373 - 383
- Kubo S, Seleme MC, Soifer HS, Perez JL, Moran JV, Kazazian HH Jr, et al. L1 retrotransposition in non-dividing and primary human somatic cells. Proc Nat Acad Sci USA 2006; 103:8036 - 8041
- Muotri AR, Chu VT, Marchetto MC, Deng W, Moran JV, Gage FH. Somatic mosaicism in neuronal precursor cells mediated by L1 retrotransposition. Nature 2005; 435:903 - 910
- Kano H, Godoy I, Courtney C, Vetter MR, Gerton GL, Ostertag EM, et al. L1 retrotransposition occurs mainly in embryogenesis and creates somatic mosaicism. Genes Dev 2009; 23:1303 - 1312
- Prak ET, Dodson AW, Farkash EA, Kazazian HH Jr. Tracking an embryonic L1 retrotransposition event. Proc Nat Acad Sci USA 2003; 100:1832 - 1837
- Belgnaoui SM, Gosden RG, Semmes OJ, Haoudi A. Human LINE-1 retrotransposon induces DNA damage and apoptosis in cancer cells. Cancer Cell Int 2006; 6:13
- Wallace NA, Belancio VP, Deininger PL. L1 mobile element expression causes multiple types of toxicity. Gene 2008; 419:75 - 81
- Girod PA, Nguyen DQ, Calabrese D, Puttini S, Grandjean M, Martinet D, et al. Genome-wide prediction of matrix attachment regions that increase gene expression in mammalian cells. Nat Methods 2007; 4:747 - 753
- Ehrhardt A, Haase R, Schepers A, Deutsch MJ, Lipps HJ, Baiker A. Episomal vectors for gene therapy. Curr Gene Ther 2008; 8:147 - 161
- Harraghy N, Gaussin A, Mermod N. Sustained transgene expression using MAR elements. Curr Gene Ther 2008; 8:353 - 366
- Argyros O, Wong SP, Niceta M, Waddington SN, Howe SJ, Coutelle C, et al. Persistent episomal transgene expression in liver following delivery of a scaffold/matrix attachment region containing non-viral vector. Gene Ther 2008; 15:1593 - 1605
- Stehle IM, Postberg J, Rupprecht S, Cremer T, Jackson DA, Lipps HJ. Establishment and mitotic stability of an extra-chromosomal mammalian replicon. BMC Cell Biol 2007; 8:33
- Ostertag EM, Prak ET, DeBerardinis RJ, Moran JV, Kazazian HH Jr. Determination of L1 retrotransposition kinetics in cultured cells. Nucl Acids Res 2000; 28:1418 - 1423
- Noutsopoulos D, Vartholomatos G, Kolaitis N, Tzavaras T. SV40 large T antigen upregulates the retrotransposition frequency of viral-like 30 elements. J Mol Biol 2006; 361:450 - 461
- Jenke AC, Stehle IM, Herrmann F, Eisenberger T, Baiker A, Bode J, et al. Nuclear scaffold/matrix attached region modules linked to a transcription unit are sufficient for replication and maintenance of a mammalian episome. Proc Nat Acad Sci USA 2004; 101:11322 - 11327
- Sun TQ, Livanos E, Vos JM. Engineering a mini-herpesvirus as a general strategy to transduce up to 180 kb of functional self-replicating human mini-chromosomes. Gene Ther 1996; 3:1081 - 1088
- Baiker A, Maercker C, Piechaczek C, Schmidt SB, Bode J, Benham C, et al. Mitotic stability of an episomal vector containing a human scaffold/matrix-attached region is provided by association with nuclear matrix. Nat Cell Biol 2000; 2:182 - 184
- Nanbo A, Sugden A, Sugden B. The coupling of synthesis and partitioning of EBV's plasmid replicon is revealed in live cells. EMBO J 2007; 26:4252 - 4262
- Huertas D, Howe S, McGuigan A, Huxley C. Expression of the human CFTR gene from episomal oriP-EBNA1-YACs in mouse cells. Hum Mol Genet 2000; 9:617 - 629
- Hata K, Sakaki Y. Identification of critical CpG sites for repression of L1 transcription by DNA methylation. Gene 1997; 189:227 - 234
- Burden AF, Manley NC, Clark AD, Gartler SM, Laird CD, Hansen RS. Hemimethylation and non-CpG methylation levels in a promoter region of human LINE-1 (L1) repeated elements. J Biol Chem 2005; 280:14413 - 14419
- Farthing CR, Ficz G, Ng RK, Chan CF, Andrews S, Dean W, et al. Global mapping of DNA methylation in mouse promoters reveals epigenetic reprogramming of pluripotency genes. PLoS Gene 2008; 4:1000116
- Ikeda R, Kokubu C, Yusa K, Keng VW, Horie K, Takeda J. Sleeping beauty transposase has an affinity for heterochromatin conformation. Mol Cell Biol 2007; 27:1665 - 1676
- Lee HS, Kim BH, Cho NY, Yoo EJ, Choi M, Shin SH, et al. Prognostic implications of and relationship between CpG island hypermethylation and repetitive DNA hypomethylation in hepatocellular carcinoma. Clin Cancer Res 2009; 15:812 - 820
- Bock C, Reither S, Mikeska T, Paulsen M, Walter J, Lengauer T. BiQ Analyzer: visualization and quality control for DNA methylation data from bisulfite sequencing. Bioinformatics (Oxford, England) 2005; 21:4067 - 4068
- Ivics Z, Li MA, Mates L, Boeke JD, Nagy A, Bradley A, et al. Transposon-mediated genome manipulation in vertebrates. Nat Methods 2009; 6:415 - 422
- Rangwala SH, Kazazian HH Jr. The L1 retrotransposition assay: A retrospective and toolkit. Methods 2009; 49:219 - 226
- Papapetrou EP, Ziros PG, Micheva ID, Zoumbos NC, Athanassiadou A. Gene transfer into human hematopoietic progenitor cells with an episomal vector carrying an S/MAR element. Gene Ther 2006; 13:40 - 51
- Schaarschmidt D, Baltin J, Stehle IM, Lipps HJ, Knippers R. An episomal mammalian replicon: sequence-independent binding of the origin recognition complex. EMBO J 2004; 23:191 - 201
- Stillman B. Origin recognition and the chromosome cycle. FEBS Lett 2005; 579:877 - 884
- Stoll SM, Calos MP. Extrachromosomal plasmid vectors for gene therapy. Curr Opin Mol Ther 2002; 4:299 - 305
- Jackson DA, Juranek S, Lipps HJ. Designing nonviral vectors for efficient gene transfer and long-term gene expression. Mol Ther 2006; 14:613 - 626
- Millar DS, Paul CL, Molloy PL, Clark SJ. A distinct sequence (ATA AA)n separates methylated and unmethylated domains at the 5′-end of the GSTP1 CpG island. J Biol Chem 2000; 275:24893 - 24899
- Lee SH, Eldi P, Cho SY, Rangasamy D. Control of chicken CR1 retrotransposons is independent of Dicer-mediated RNA interference pathway. BMC Biol 2009; 7:53
- Lee C, Kim J, Shin SG, Hwang S. Absolute and relative QPCR quantification of plasmid copy number in Escherichia coli. J Biotechnol 2006; 123:273 - 280